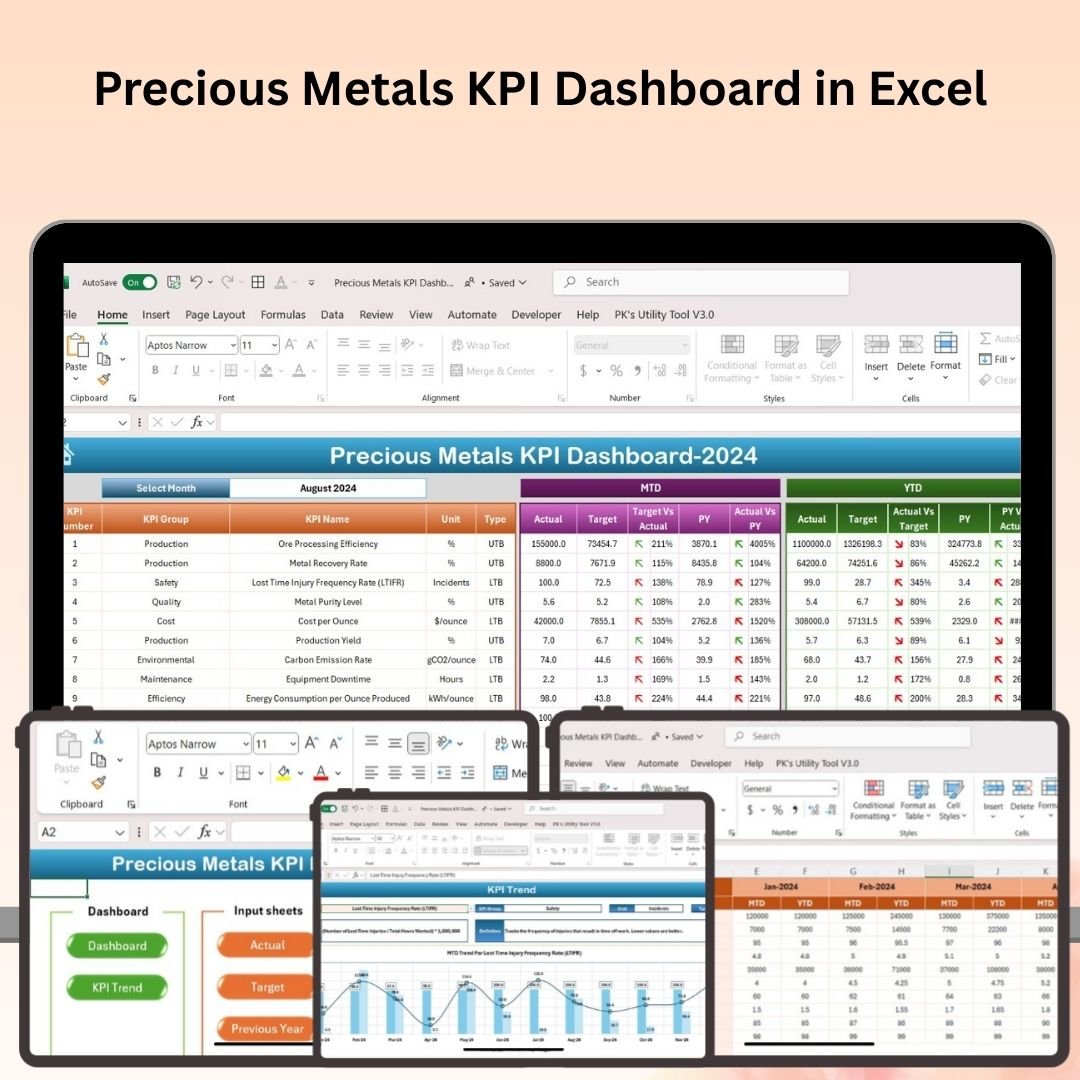


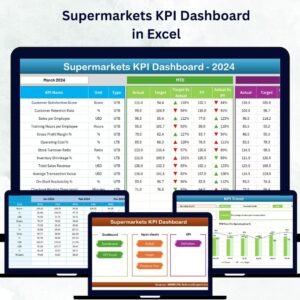
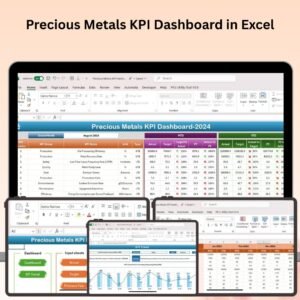
The Precious Metals KPI Dashboard in Excel is an essential tool for businesses and investors in the precious metals industry. Whether you’re managing mining operations, refining, or trading precious metals like gold, silver, platinum, or palladium, this comprehensive Excel-based dashboard allows you to track key performance indicators (KPIs) related to production, market prices, profitability, and operational efficiency.
With real-time tracking, customizable reports, and easy-to-read charts, this dashboard helps you monitor critical metrics and make data-driven decisions to optimize your operations and investments in the precious metals market.

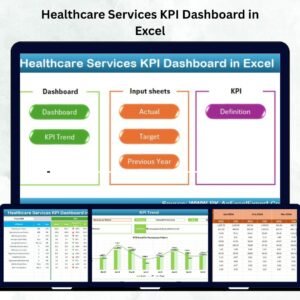
Key Features of the Precious Metals KPI Dashboard in Excel:
🔑 Comprehensive Performance Monitoring
Track key KPIs such as metal production volumes, market prices, extraction costs, profit margins, and refining efficiency to evaluate overall business performance.
💰 Profitability Analysis
Monitor the profitability of your precious metal operations by analyzing cost-of-production, market fluctuations, and revenue, allowing you to optimize your financial strategies.
📈 Market Price Tracking
Keep an eye on the current prices of gold, silver, platinum, and palladium, and analyze price trends to make informed decisions regarding buying, selling, or refining.
📊 Production and Operational Efficiency
Track metal production output, refining efficiency, and mining yields to ensure your operations are running at optimal levels.
📅 Customizable Reports
Generate customizable reports and dashboards to present KPIs to stakeholders, clients, or investors, making it easy to communicate the health of your precious metals operations.
🚀 Why You’ll Love the Precious Metals KPI Dashboard in Excel:
✅ Track Market and Production Metrics – Monitor metal production volumes, market prices, and refining output to assess your business’s performance in real-time.
✅ Optimize Profit Margins – Analyze cost-of-production and market prices to optimize profitability and make informed pricing decisions.
✅ Monitor Production Efficiency – Track production rates and refining yields to identify inefficiencies and optimize operations.
✅ Make Data-Driven Decisions – Use real-time data and detailed reports to make decisions about metal extraction, refining, buying, and selling.
✅ Customizable and User-Friendly – The Excel interface makes it easy to customize, update, and analyze your precious metals operations, regardless of your experience level.
✅ Keep Investors and Stakeholders Informed – Share key insights with stakeholders using easy-to-read reports and dashboards that summarize critical performance metrics.
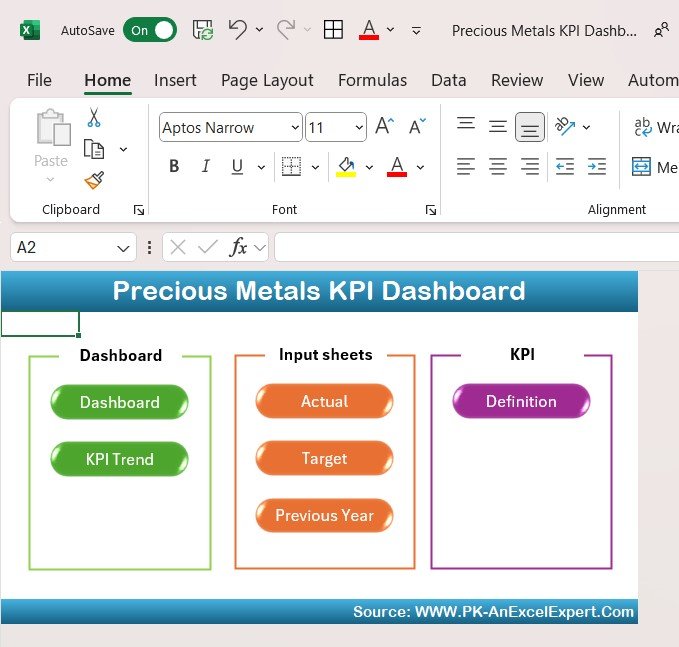
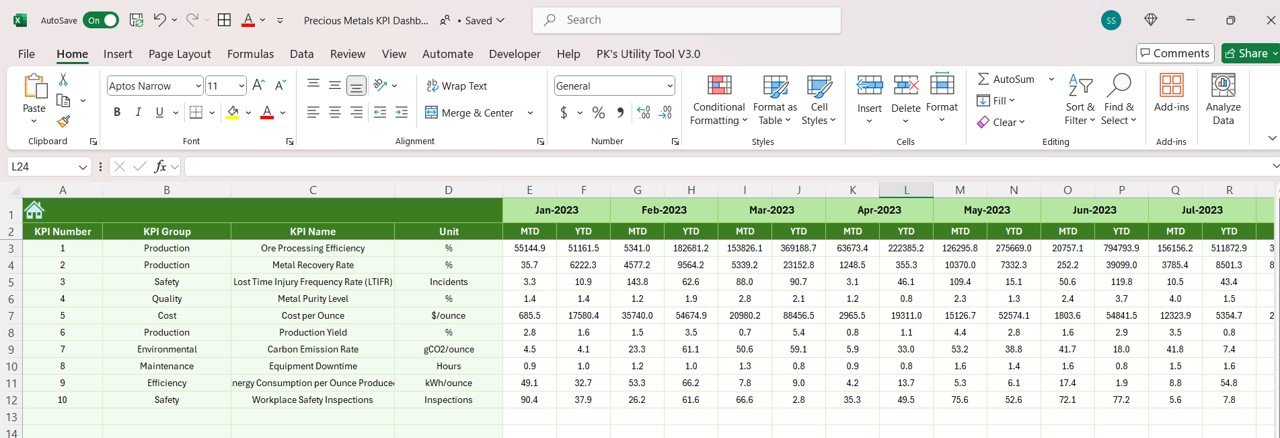
What’s Inside the Precious Metals KPI Dashboard in Excel:
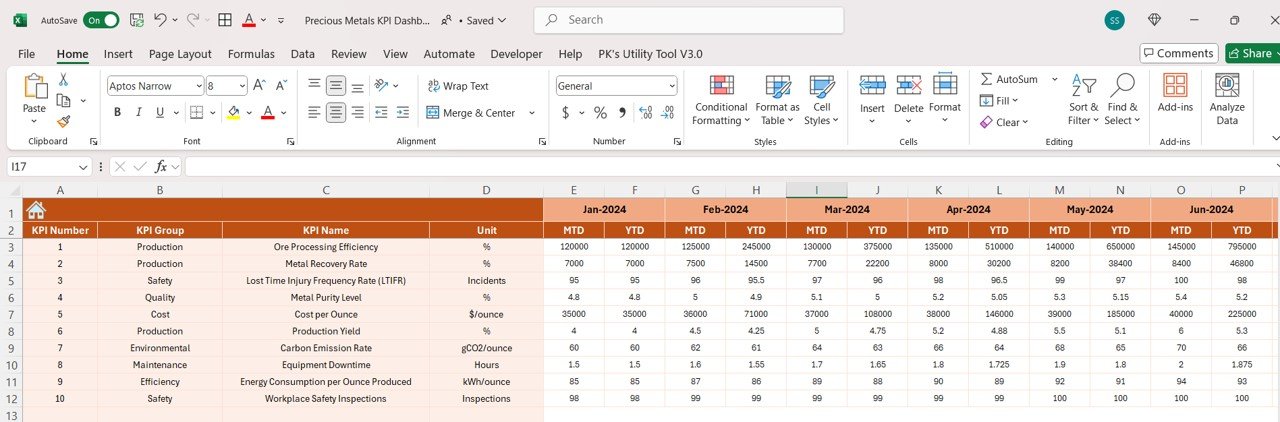
- Production Tracking: Track the total production volume for each metal, including gold, silver, platinum, and palladium, as well as extraction costs.
- Market Price Monitoring: Monitor the prices of precious metals and identify trends, helping you make informed decisions regarding market entry or exit.
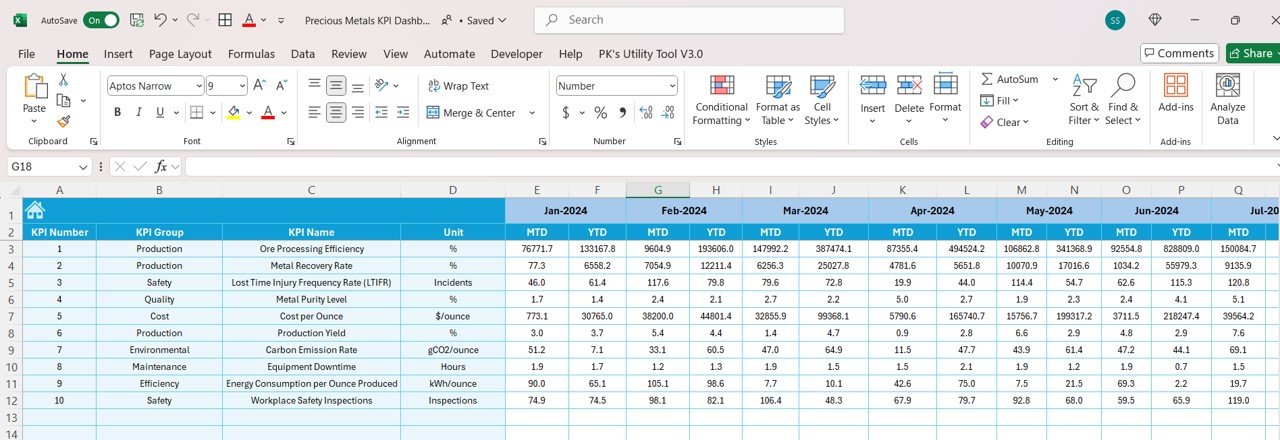
- Profitability Analysis: Measure the profitability of your operations by analyzing cost-of-production and comparing it against market prices.
- Operational Efficiency Metrics: Track mining yields, refining efficiency, and extraction costs to ensure you are maximizing production efficiency and minimizing waste.
- Cost and Revenue Tracking: Compare operational costs with revenues from metal sales to ensure your business stays financially viable.
- Customizable Reports: Create reports tailored to your needs, showcasing detailed insights into your business’s operations and market performance.
How to Use the Precious Metals KPI Dashboard in Excel:
1️⃣ Download the Template – Instantly access your Excel file upon purchase.
2️⃣ Input Production Data – Enter data such as metal production volume, cost-of-production, and refining details into the dashboard.
3️⃣ Monitor Market Prices – Track and input market prices of precious metals like gold, silver, and platinum to evaluate your trading strategies.
4️⃣ Analyze Profitability and Efficiency – Monitor KPIs like profit margins, production efficiency, and refining yields to assess and optimize your operations.
5️⃣ Generate Reports – Create customized reports to showcase key insights to stakeholders, clients, or investors.
Who Can Benefit from the Precious Metals KPI Dashboard in Excel:
- Mining Operators
- Refining Companies
- Precious Metals Traders
- Business Owners in the Precious Metals Industry
- Investors in Precious Metals
- Financial Analysts
- Data Analysts in Precious Metals Operations
The Precious Metals KPI Dashboard in Excel is the perfect tool for anyone in the precious metals industry looking to track, optimize, and report on key performance metrics. Whether you’re involved in mining, refining, or trading, this tool helps you make smarter, data-driven decisions to ensure profitability and operational efficiency.
Click here to read the Detailed blog post
https://www.pk-anexcelexpert.com/precious-metals-kpi-dashboard-in-excel/
Visit our YouTube channel to learn step-by-step video tutorials
Youtube.com/@PKAnExcelExpert


Reviews
There are no reviews yet.