In the modern energy landscape, data drives every watt of success. Power plants and generation companies must track efficiency, safety, and reliability across multiple units — all while maintaining profitability and sustainability. Managing these metrics manually can be complex and time-consuming.
That’s where the Power Generation KPI Dashboard in Power BI comes in — a ready-to-use, interactive solution that transforms raw operational data into clear, actionable insights.
Built entirely in Microsoft Power BI, this dashboard helps energy executives, engineers, and analysts monitor performance across plants, track MTD (Month-to-Date) and YTD (Year-to-Date) results, and compare them against targets — all in one visual report.
By connecting to your Excel-based data, the dashboard updates automatically, offering real-time visibility into every critical KPI — from generation efficiency to equipment reliability and safety compliance.
⚙️ Key Features of the Power Generation KPI Dashboard in Power BI
⚡ Interactive Summary Page – View total KPIs, MTD Target Met & Missed counts, and detailed tables with dynamic visuals.
📊 KPI Trend Page – Analyze monthly and yearly trends for each KPI using combo charts.
📘 KPI Definition Page – Access a drill-through page explaining each KPI’s formula, type (LTB/UTB), and definition.
📆 Month & KPI Group Slicers – Filter data interactively for focused insights.
📈 MTD and YTD Analysis – Compare actual vs target and previous year data in one view.
💡 Visual Indicators (▲/▼) – Instantly identify areas of improvement or decline with color-coded arrows.
🧮 Excel Integration – Seamless data import and refresh from Excel sheets (Input_Actual, Input_Target, KPI_Definition).
🧭 Zero Coding Required – Completely no-code; perfect for analysts and decision-makers.
🏭 Multi-Plant Ready – Filter results by location, department, or KPI category.
📂 Structure of the Dashboard
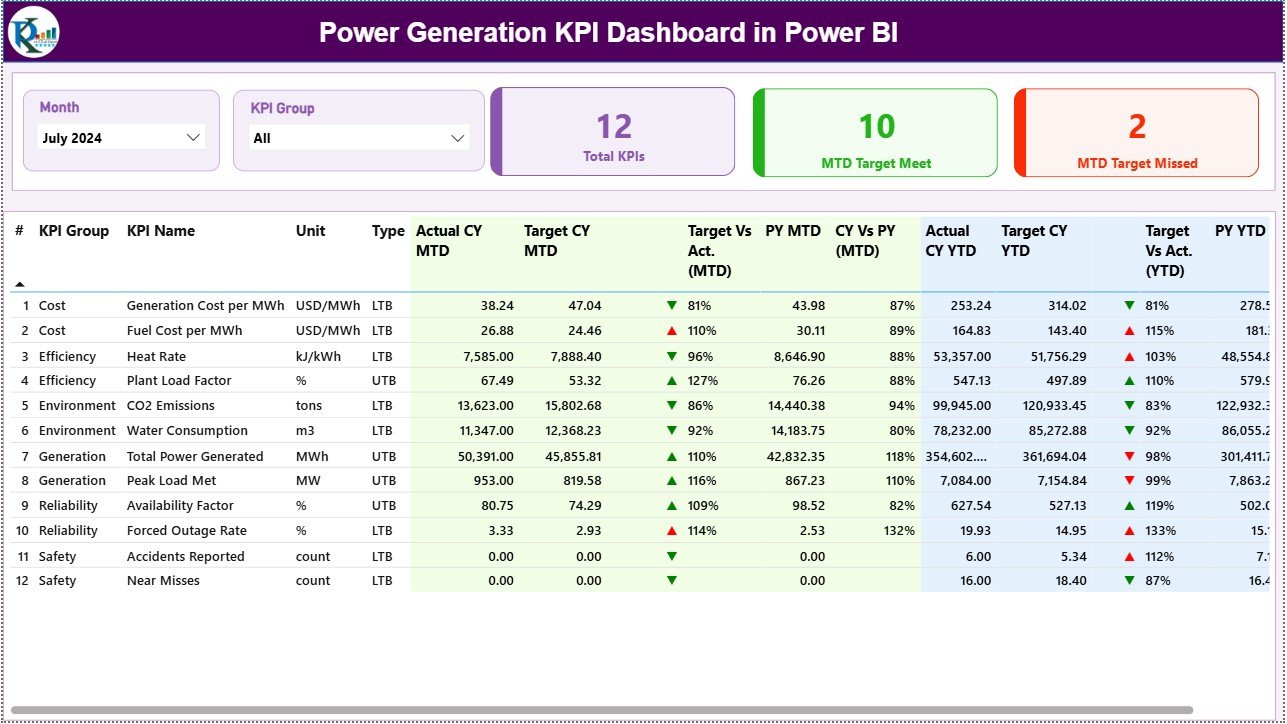
1️⃣ Summary Page – Performance Overview
The main page shows total KPIs, MTD performance, and detailed KPI comparisons.
It includes:
-
Total KPIs Count
-
MTD Target Met Count
-
MTD Target Missed Count
-
Comprehensive KPI Table with columns for KPI Group, Unit, Actual CY MTD/YTD, Targets, PY comparisons, and percentage achievements.
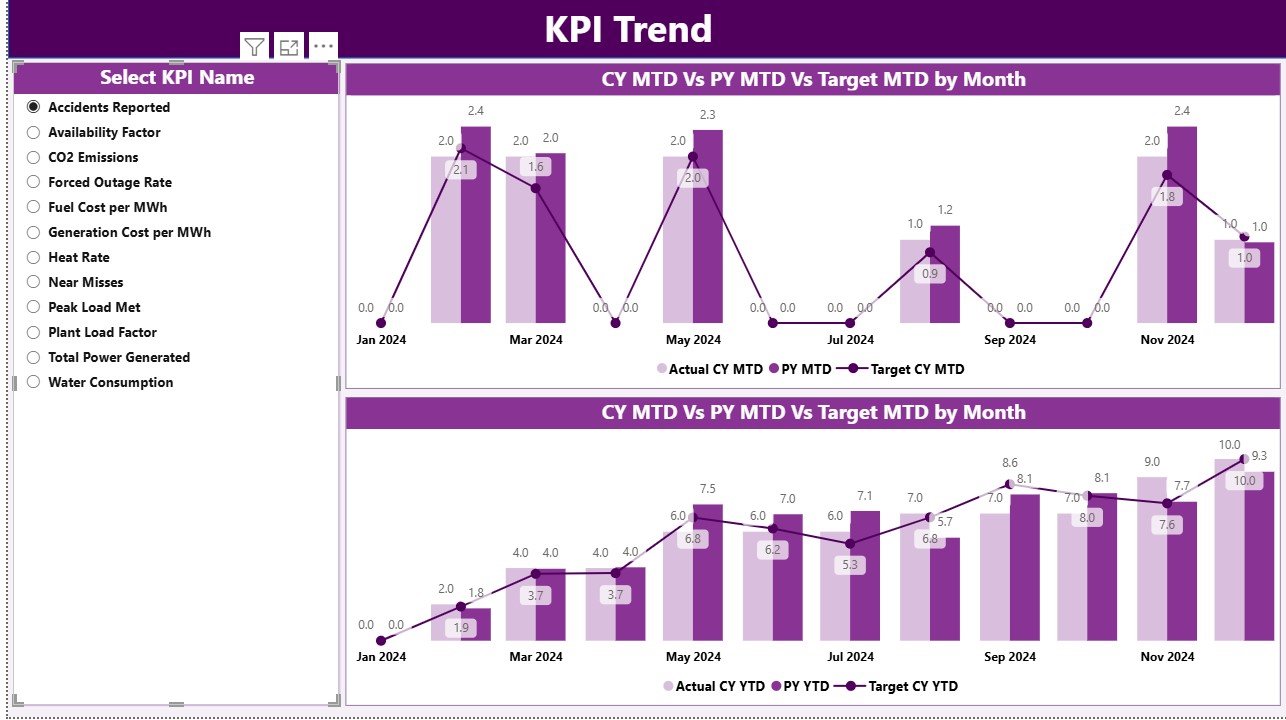
2️⃣ KPI Trend Page – Performance Visualization
Analyze any KPI’s historical data with:
-
Dropdown Selector (KPI Name)
-
Combo Charts for MTD and YTD (Actual, Target, PY values)
-
Dynamic interaction with slicers to explore monthly or cumulative performance.
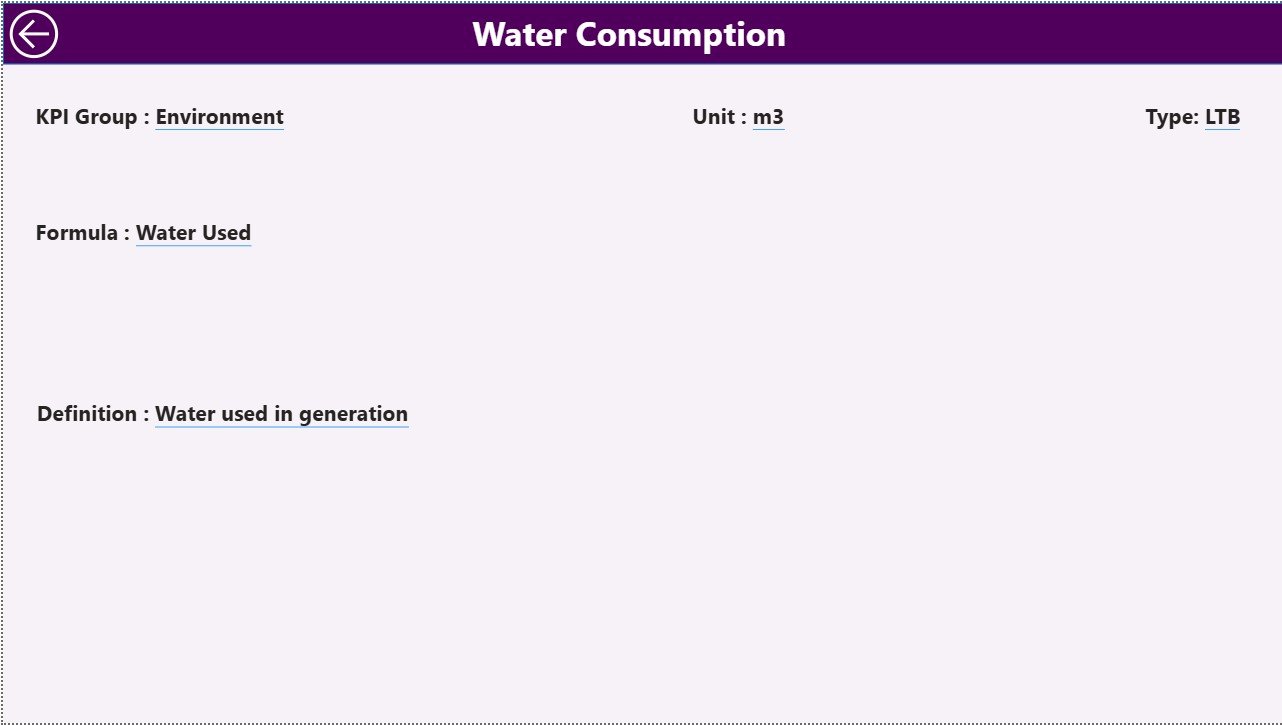
3️⃣ KPI Definition Page – KPI Reference Library
Drill through any KPI to see its complete definition, unit, formula, and classification (UTB/LTB).
A back button allows easy navigation back to the Summary Page.
🔋 Excel Data Source Structure
The dashboard connects to an Excel file with three sheets:
📄 Input Actual: Records all monthly actual performance data for MTD and YTD.
📄 Input Target: Contains target values for each KPI.
📄 KPI_Definition: Defines KPI names, units, formulas, and descriptions.
Just update your Excel sheet each month — and Power BI will refresh automatically.
🌍 KPIs You Can Track
⚙️ Operational Efficiency
-
Plant Load Factor (PLF %)
-
Heat Rate (kCal/kWh)
-
Auxiliary Power Consumption (%)
-
Capacity Utilization (%)
🧰 Maintenance & Reliability
-
Mean Time Between Failures (MTBF)
-
Mean Time to Repair (MTTR)
-
Forced Outage Rate (%)
-
Availability Factor (%)
🛡️ Safety & Compliance
-
Lost Time Injury Frequency Rate (LTIFR)
-
Environmental Compliance Rate (%)
-
Incident Severity Index
💰 Financial
-
Generation Cost per MWh
-
Revenue per MWh
-
Profit Margin (%)
These KPIs provide a holistic picture of operational, safety, and financial performance for any power plant or generation facility.
🚀 Advantages of the Power Generation KPI Dashboard in Power BI
✅ Centralized Reporting: All KPIs integrated into one platform.
✅ Real-Time Insights: Auto-refresh keeps data up-to-date.
✅ Data Visualization: Combo charts and indicators simplify complex analytics.
✅ Excel-Friendly: Update via Excel, no coding required.
✅ Enhanced Transparency: Drill-through definitions promote clarity.
✅ Scalable & Customizable: Add plants, KPIs, or filters easily.
🧠 Best Practices
📌 Define KPIs clearly with formulas and units.
📌 Keep Excel data formatted consistently.
📌 Use green/red color indicators for clarity.
📌 Automate refresh schedules in Power BI Service.
📌 Align every KPI to strategic energy goals.
📌 Review MTD/YTD trends monthly.
👥 Who Can Benefit
🏭 Plant Managers: Track equipment reliability and generation performance.
⚙️ Maintenance Teams: Identify recurring issues quickly.
📊 Analysts & Executives: Evaluate cost efficiency and production trends.
🛡️ Safety Officers: Monitor incidents and compliance KPIs.
💼 Finance Teams: Analyze cost per MWh and profit margins.
Whether managing a single facility or an entire generation network, this dashboard ensures data-driven energy management.


Reviews
There are no reviews yet.