Ports manage massive purchasing volumes every day. From equipment, spare parts, fuel, and maintenance services to large-scale infrastructure materials, purchasing decisions directly affect operational efficiency, cost control, and vessel turnaround time. Because port operations are time-sensitive and capital-intensive, even small purchasing inefficiencies can lead to delays, higher costs, and operational disruption. However, when purchasing data remains scattered across spreadsheets and static reports, visibility drops and decision-making slows down.
That is exactly why the Port Purchasing Dashboard in Power BI becomes a powerful and essential solution.
This ready-to-use Power BI dashboard transforms raw port purchasing data into clear, interactive, and actionable insights. Instead of manually reviewing purchase orders, delivery logs, and supplier reports, port authorities and procurement teams can monitor budgeted cost, actual cost, ordered vs received quantities, delivery delays, vendor performance, and financial risk—all from one centralized dashboard. Moreover, because the solution is built in Power BI, it delivers enterprise-level analytics without manual reporting effort.
✨ Key Features of the Port Purchasing Dashboard in Power BI
📊 Centralized Purchasing Visibility
Track all port purchasing KPIs in one interactive dashboard instead of managing multiple reports.
💰 Budget vs Actual Cost Control
Instantly identify overspending, underutilized budgets, and savings opportunities.
🚢 Ordered vs Received Quantity Tracking
Monitor procurement fulfillment and prevent supply gaps at terminals.
⏱️ Delivery Delay Analysis
Identify items, suppliers, or ports causing frequent delivery delays.
🧑🤝🧑 Vendor Performance Monitoring
Evaluate supplier efficiency, pricing discipline, and reliability using data-driven insights.
📦 What’s Inside the Port Purchasing Dashboard in Power BI
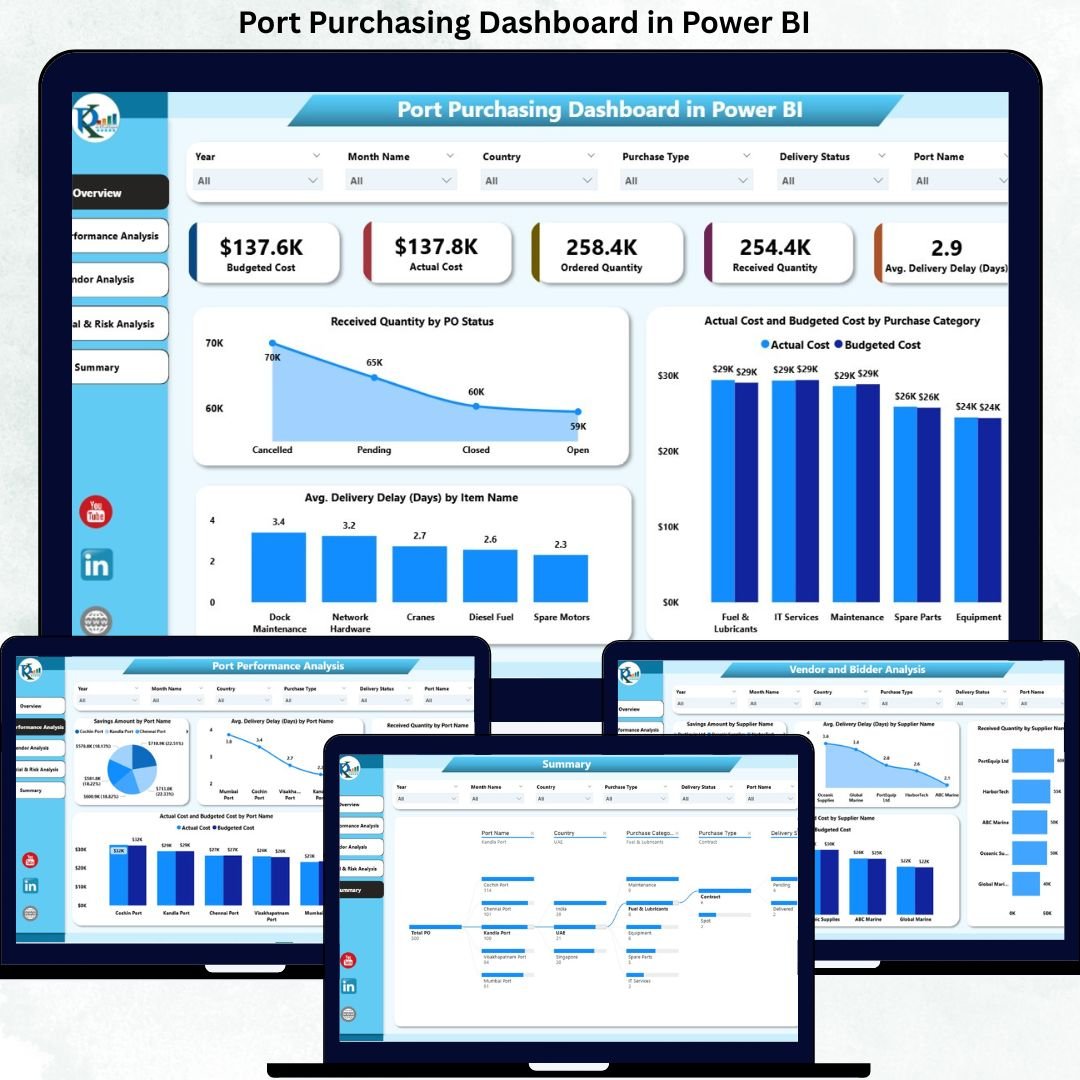
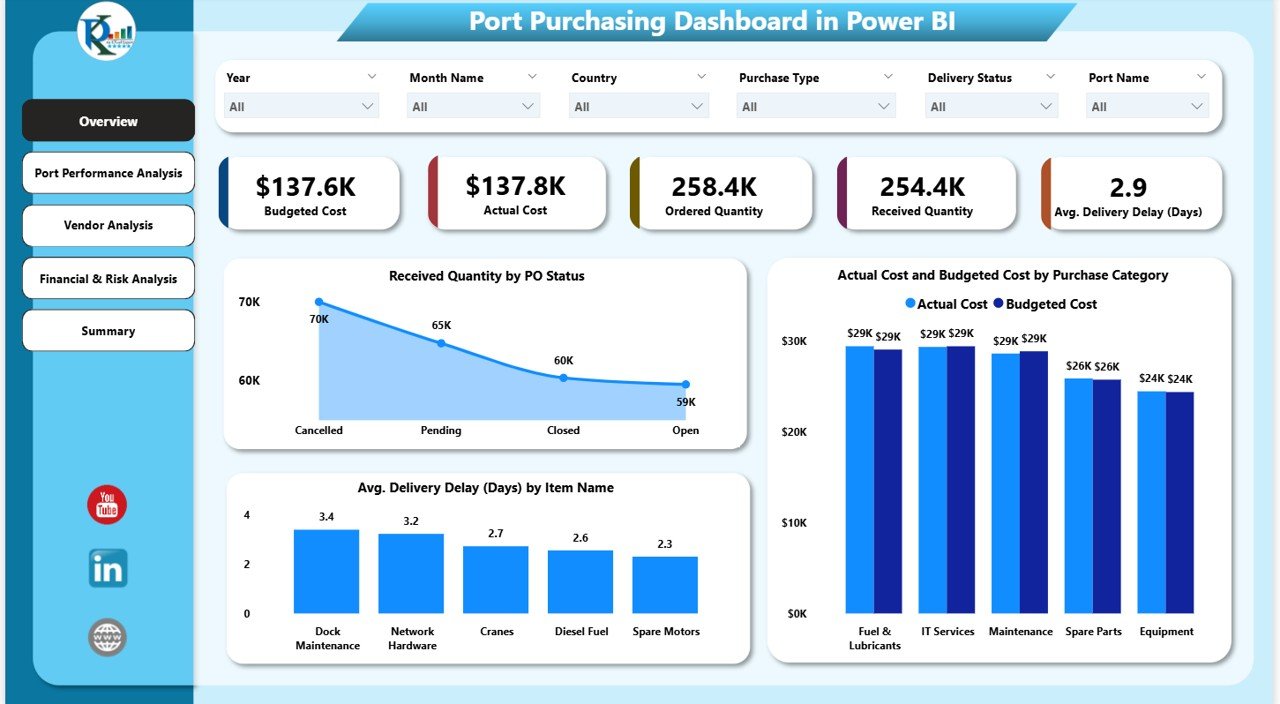
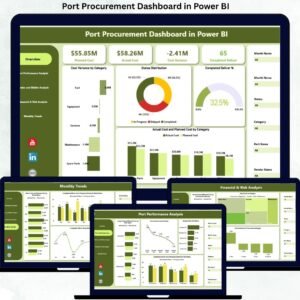
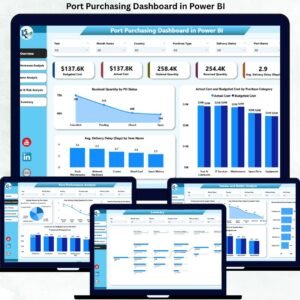
🖥️ Overview Section – Executive Purchasing Snapshot
The Overview section provides leadership with an instant summary of purchasing performance.
KPI Cards Included
-
Budgeted Cost – Planned purchasing spend
-
Actual Cost – Real cost incurred
-
Ordered Quantity – Total quantity ordered
-
Received Quantity – Quantity delivered
-
Average Delivery Delay (Days) – Overall delivery efficiency
Key Overview Charts
-
Received Quantity by PO Status – Identify pending and completed orders
-
Actual Cost vs Budgeted Cost by Purchase Category – Detect overruns early
-
Average Delivery Delay (Days) by Item Name – Pinpoint problematic items
These visuals allow procurement and finance leaders to assess purchasing health in seconds.
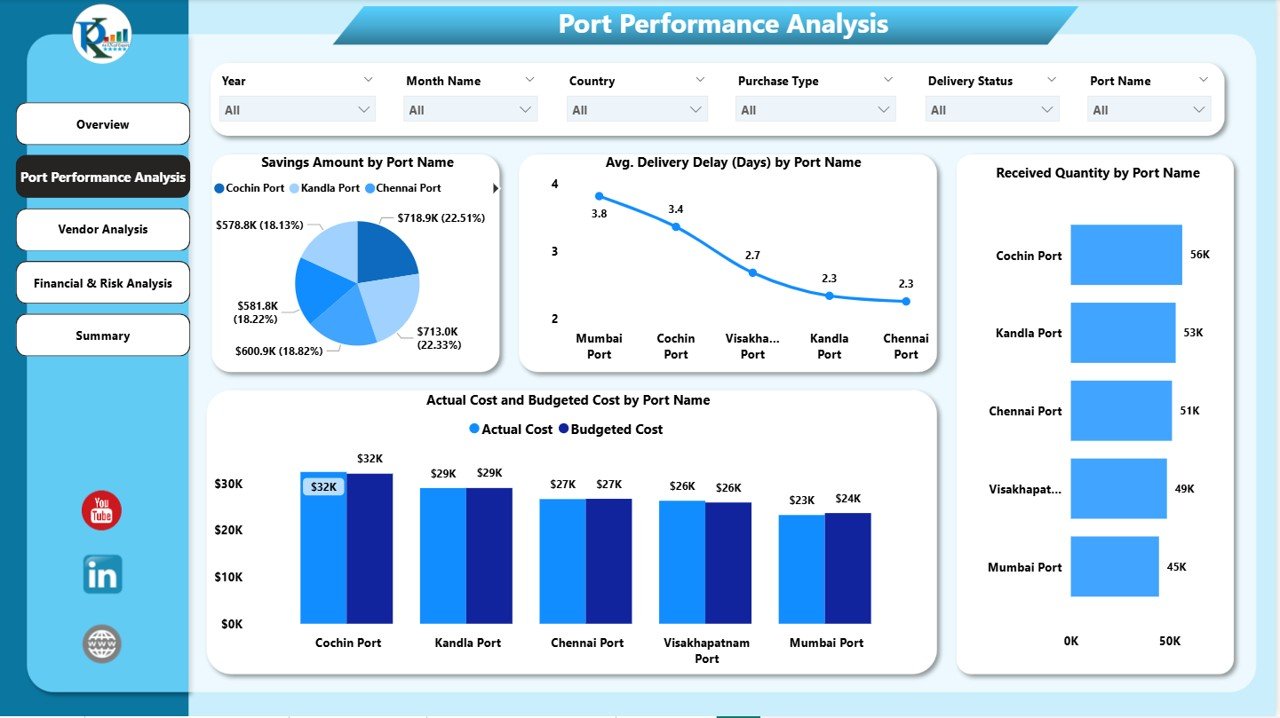
⚓ Port Performance Analysis – Location-Level Insights
This section evaluates purchasing efficiency across different port locations.
Charts Included
-
Savings Amount by Port Name – Measure procurement efficiency
-
Average Delivery Delay (Days) by Port Name – Identify operational bottlenecks
-
Received Quantity by Port Name – Support capacity and logistics planning
-
Actual Cost vs Budgeted Cost by Port Name – Track cost discipline
This analysis helps management prioritize improvements at underperforming ports.
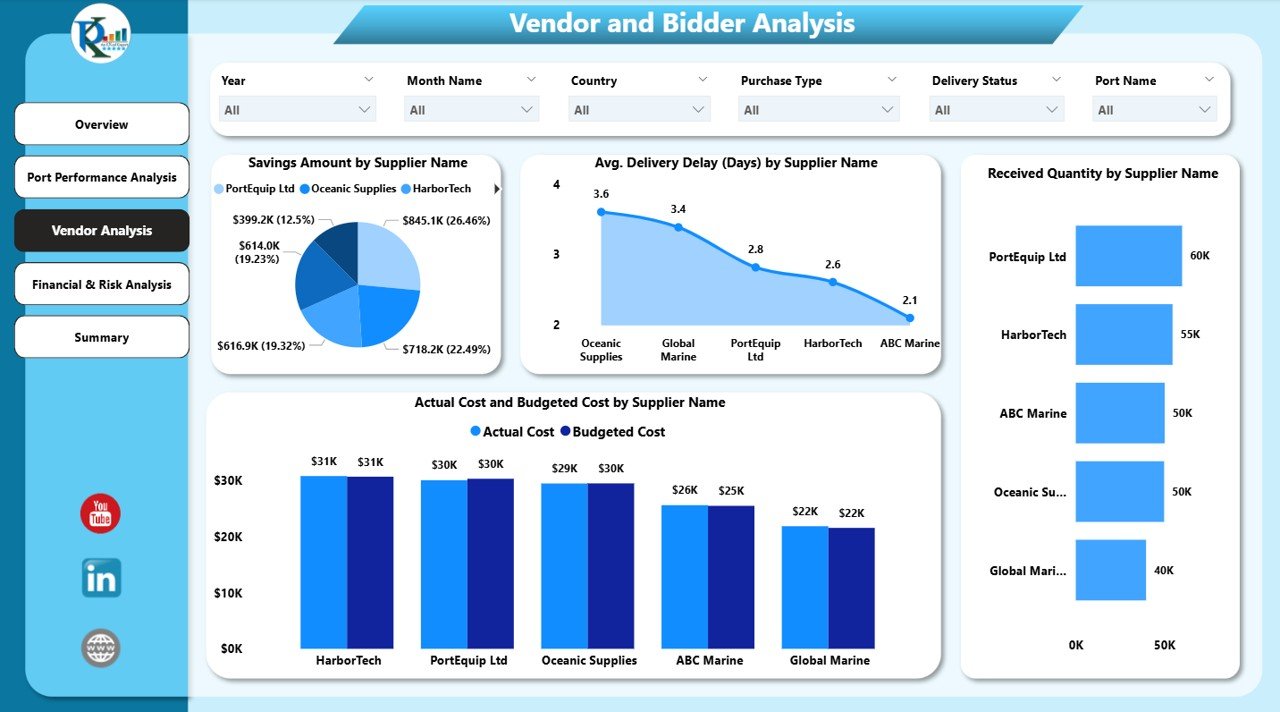
🧑🤝🧑 Vendor Analysis – Supplier Performance Monitoring
Suppliers play a critical role in port procurement. This section provides a clear vendor-level performance view.
Charts Included
-
Savings Amount by Supplier Name – Identify value-generating vendors
-
Average Delivery Delay (Days) by Supplier Name – Detect unreliable suppliers
-
Received Quantity by Supplier Name – Understand supplier dependency
-
Actual Cost vs Budgeted Cost by Supplier Name – Strengthen negotiations
These insights help procurement teams renegotiate contracts and reduce supplier risk.
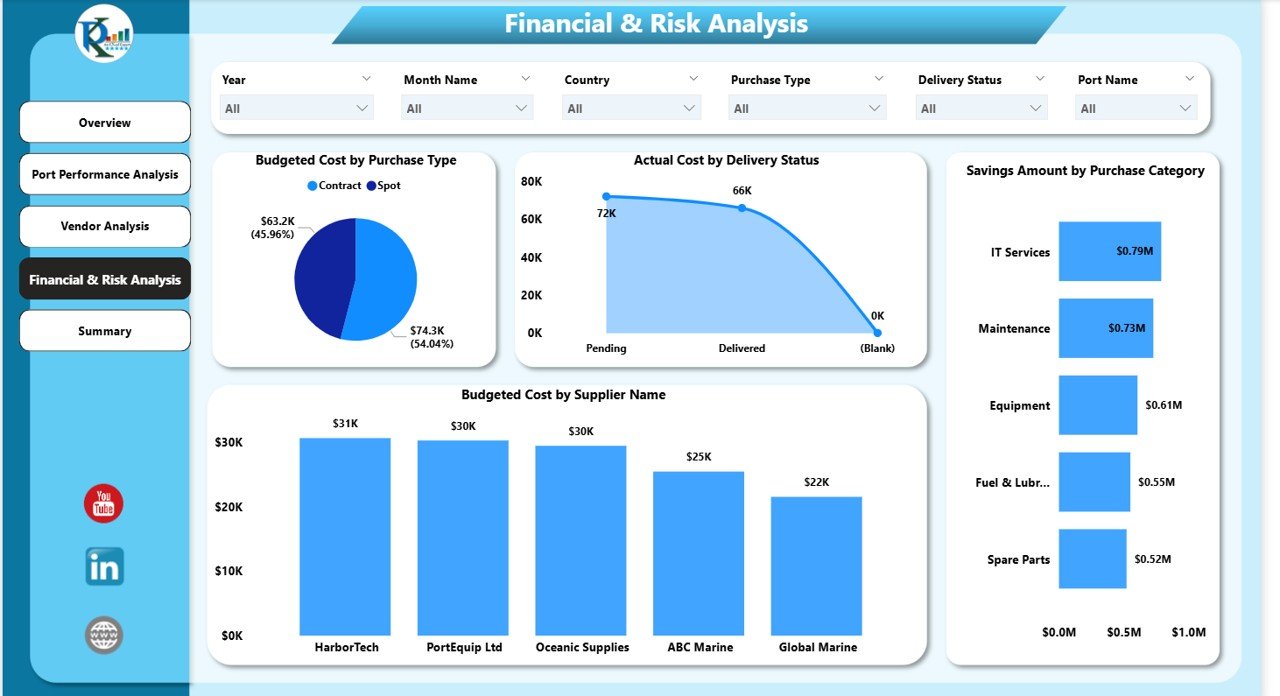
💰 Financial & Risk Analysis – Cost Exposure Visibility
This section focuses on financial risk and dependency analysis.
Charts Included
-
Budgeted Cost by Purchase Type – Planned spend distribution
-
Actual Cost by Delivery Status – Impact of delays on cost
-
Budgeted Cost by Supplier Name – Supplier concentration risk
This analysis supports stronger financial governance and risk mitigation.
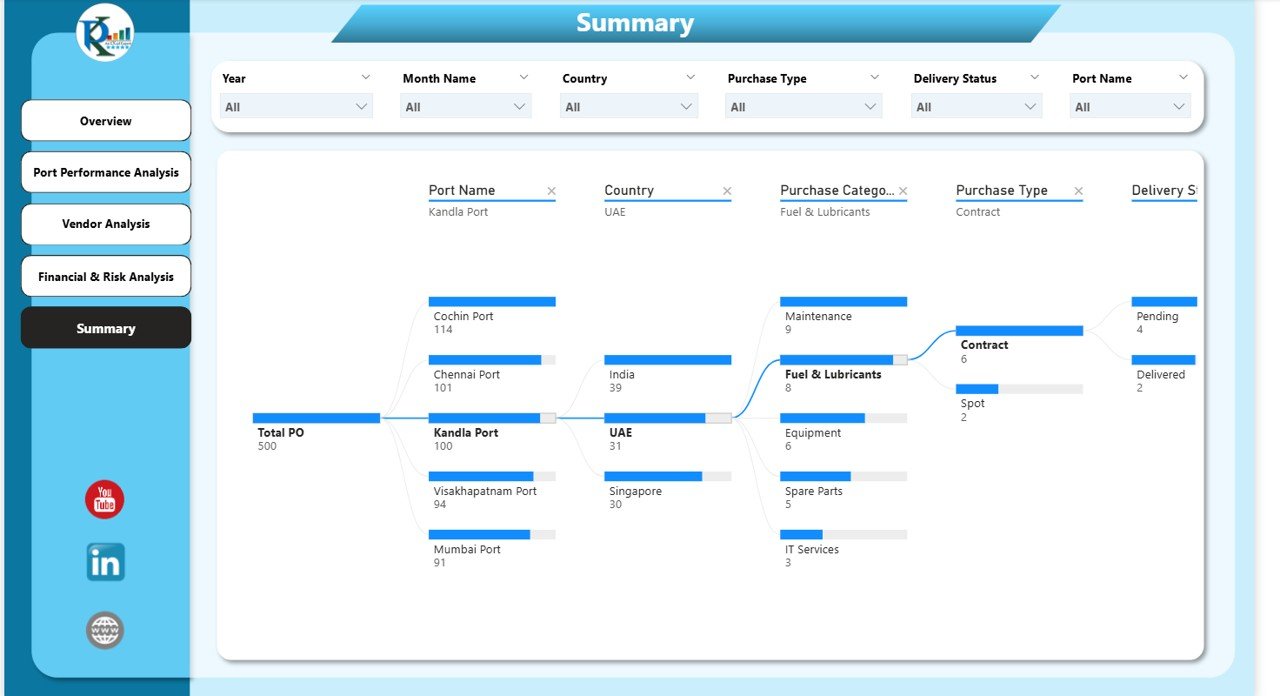
🧩 Summary Section – Decomposition Tree Analysis
The interactive Decomposition Tree allows deep drill-down analysis by:
-
Port
-
Supplier
-
Purchase Category
-
Delivery Status
-
Item Name
This feature enables root-cause analysis and strategic decision-making.
🎯 Who Can Benefit from This Dashboard
-
⚓ Port Authorities & Terminal Operators
-
📦 Procurement & Purchasing Teams
-
💼 Finance & Cost Control Teams
-
🚢 Operations & Logistics Managers
-
🧠 Senior Management & Decision-Makers
📘 Click here to read the Detailed blog post
Watch the step-by-step video tutorial:


Reviews
There are no reviews yet.