


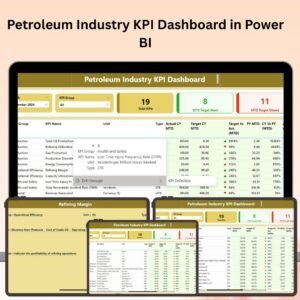
The Petroleum Industry KPI Dashboard in Power BI is a comprehensive tool designed for companies in the petroleum sector to track, analyze, and optimize their key performance indicators (KPIs). Whether you’re managing upstream or downstream operations, refining, logistics, or supply chain management, this Power BI dashboard provides real-time insights into critical metrics like production efficiency, operational costs, environmental impact, and safety performance.
With interactive charts, real-time data tracking, and customizable reports, this dashboard enables petroleum industry professionals to make informed decisions, optimize operations, and ensure compliance with industry standards. It’s the perfect solution for improving operational efficiency, reducing costs, and driving sustainability in the petroleum sector.

Key Features of the Petroleum Industry KPI Dashboard in Power BI:
🔍 Comprehensive Performance Tracking
Track key industry-specific KPIs like production volume, drilling performance, equipment downtime, refining output, and operational efficiency, all in one centralized dashboard.
📊 Production and Operational Efficiency Monitoring
Monitor production metrics such as barrels per day (BPD), well performance, and energy consumption, and analyze equipment downtime to improve operational efficiency.
💸 Cost Tracking and Financial Performance
Track costs related to extraction, refining, transportation, and logistics. Analyze profit margins, operational costs, and return on investment (ROI) to manage profitability.
🌱 Environmental and Safety Metrics
Track environmental impact metrics, such as emissions, waste management, and sustainability efforts, as well as safety performance indicators, such as accidents and compliance with safety regulations.
📈 Real-Time Data Analysis
Get real-time updates on key performance metrics, allowing you to track progress and make timely adjustments to improve efficiency and reduce costs.
📅 Customizable Reports and Dashboards
Generate tailored reports with in-depth insights into various KPIs, allowing managers to focus on specific areas of performance and share progress with stakeholders.
🚀 Why You’ll Love the Petroleum Industry KPI Dashboard in Power BI:
✅ Optimize Production Efficiency – Track and analyze key metrics like BPD, well performance, and downtime to maximize production output.
✅ Monitor Operational Costs – Keep an eye on costs related to extraction, refining, and logistics to optimize your operational budget.
✅ Ensure Compliance – Track safety and environmental metrics to ensure compliance with industry regulations and reduce risk.
✅ Enhance Decision-Making – Use real-time data insights to make informed decisions that improve operational performance, reduce costs, and increase profitability.
✅ Improve Sustainability – Monitor environmental impact data to ensure your operations align with sustainability goals and regulations.
✅ Customizable for Your Needs – Tailor the dashboard to suit your specific petroleum operations, whether you’re focused on production, refining, or logistics.
What’s Inside the Petroleum Industry KPI Dashboard in Power BI:
- Production Metrics: Monitor daily production volumes, well performance, and other operational efficiency indicators to track production output.
- Financial Performance Tracking: Track costs and ROI related to extraction, refining, and logistics operations, optimizing your overall profitability.
- Safety and Compliance Metrics: Track accidents, safety incidents, and compliance with regulations to improve workforce safety and ensure regulatory compliance.
- Environmental Metrics: Measure your company’s environmental impact through key metrics like emissions, energy consumption, and waste management.
- Downtime and Equipment Tracking: Track equipment performance, downtime, and maintenance costs to improve operational efficiency and reduce downtime.
- Real-Time Data Updates: Use interactive dashboards that update in real-time to provide the latest insights into your petroleum operations.
How to Use the Petroleum Industry KPI Dashboard in Power BI:
1️⃣ Download the Template – Instantly access your Power BI file upon purchase.
2️⃣ Input Operational Data – Enter data related to production volume, costs, safety metrics, environmental performance, and downtime into the dashboard.
3️⃣ Monitor Key Metrics – Track key metrics like production output, well performance, and financial KPIs to ensure operational efficiency.
4️⃣ Analyze Environmental Impact – Use the dashboard to monitor environmental and sustainability metrics, ensuring compliance with industry standards.
5️⃣ Generate Reports – Create detailed, customized reports to present your findings to stakeholders or use for internal analysis.
Who Can Benefit from the Petroleum Industry KPI Dashboard in Power BI:
- Petroleum Companies
- Production Managers
- Operations Teams
- Environmental Compliance Teams
- Safety Managers
- Finance and Budgeting Teams
- Business Owners in the Petroleum Sector
- Data Analysts in Oil and Gas
The Petroleum Industry KPI Dashboard in Power BI is a crucial tool for optimizing production, monitoring financial performance, tracking environmental impact, and ensuring safety compliance. It helps companies in the petroleum sector make informed decisions, reduce costs, and improve operational efficiency.
Click here to read the Detailed blog post
https://www.pk-anexcelexpert.com/petroleum-industry-kpi-dashboard-in-power-bi/
Visit our YouTube channel to learn step-by-step video tutorials
Youtube.com/@PKAnExcelExpert


Reviews
There are no reviews yet.