Managing performance across departments, teams, and business units is no longer optional—it is mission-critical. Yet many organizations still struggle with scattered Excel files, manual MIS reports, and delayed presentations that fail to deliver timely insights. As a result, leaders often miss targets, overlook risks, and react too late.
That’s exactly where the Performance Management KPI Dashboard in Power BI becomes a game-changer 🚀.
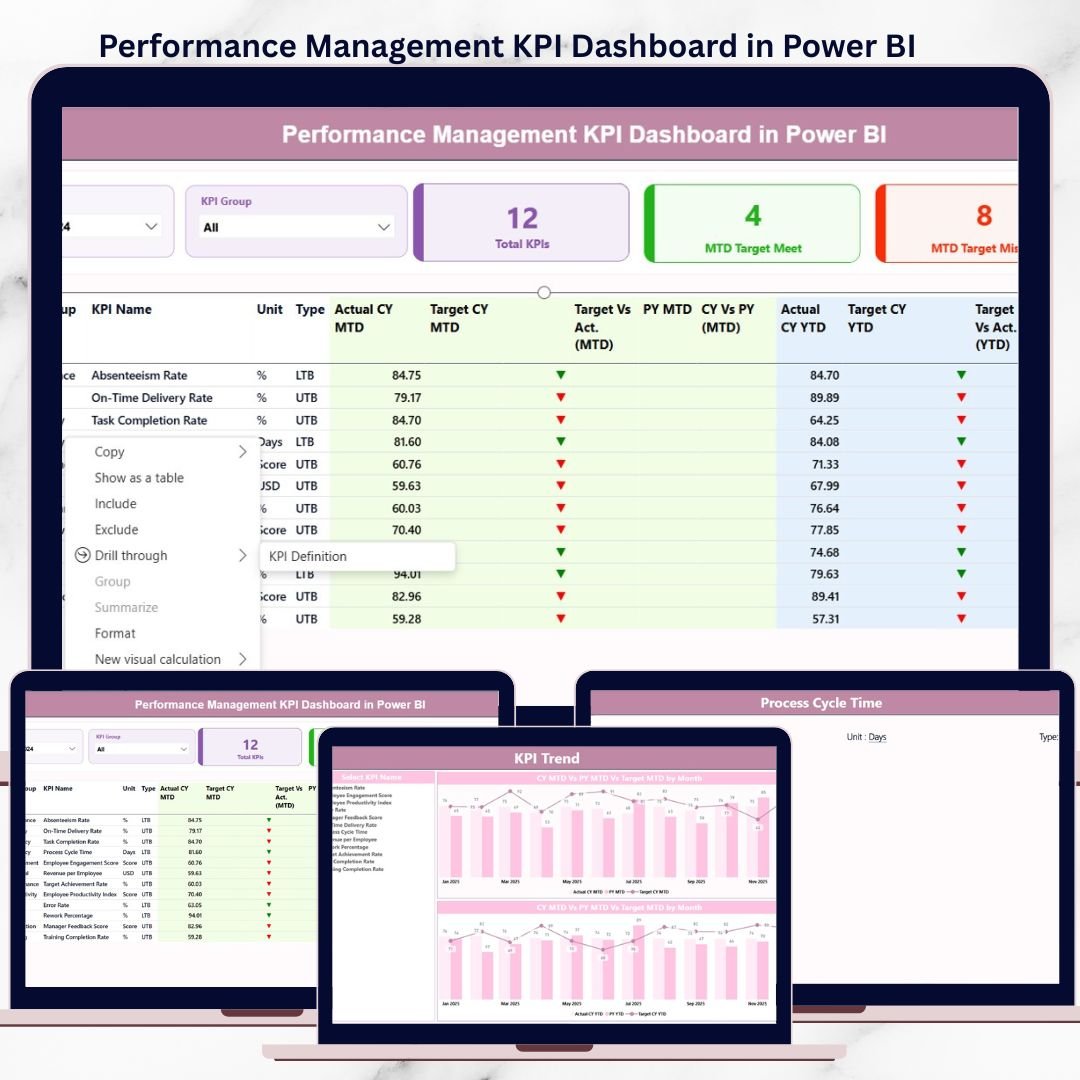
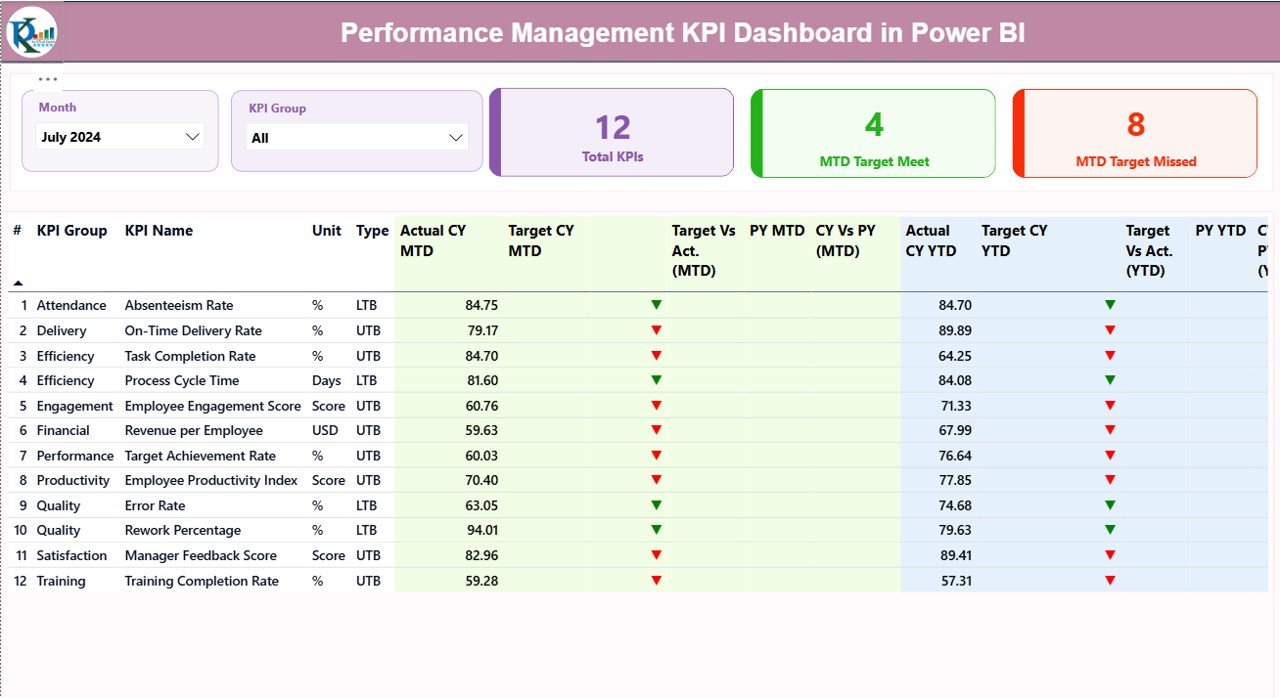
This ready-to-use Power BI dashboard is designed to give leadership teams a single, clear, and interactive view of performance across the organization. Instead of drowning in raw data, you get instant visibility into MTD and YTD performance, target achievement, and year-over-year trends—all in one powerful dashboard.
Built with a structured Excel data model and advanced Power BI visuals, this dashboard eliminates manual calculations and transforms performance discussions into data-driven decisions.
## 🔑 Key Features of Performance Management KPI Dashboard in Power BI
📊 Centralized KPI Monitoring – Track all business KPIs on a single dashboard without switching between reports.
📅 Month & KPI Group Slicers – Instantly filter performance by month and KPI category.
🎯 MTD & YTD Analysis – Monitor short-term progress and long-term performance trends.
📈 Target vs Actual Comparison – Clearly identify target achievement and performance gaps.
🔁 Year-over-Year Comparison – Compare current year performance with previous year results.
🚦 Visual Status Indicators – Instantly spot issues using green ▲ and red ▼ icons.
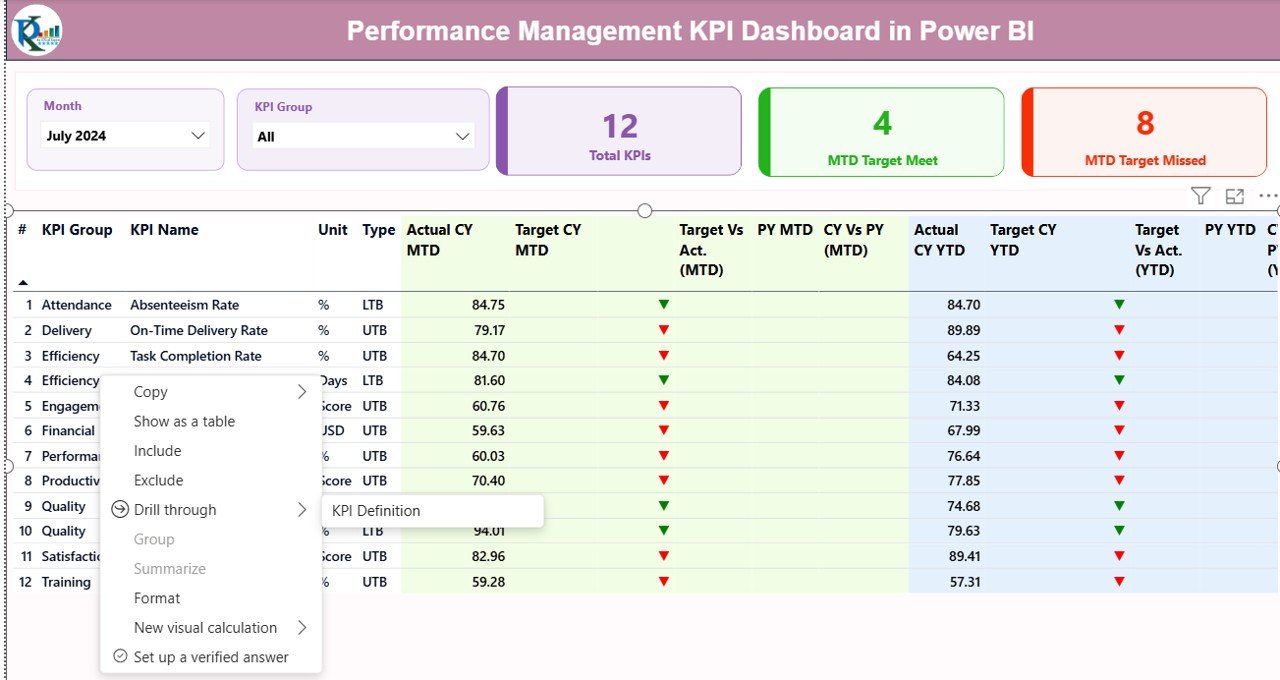
🔍 Drill-Through KPI Definitions – View KPI formulas, definitions, and logic with a single click.
⚡ Automated Calculations – No manual formulas or complex Power BI setup required.
## 📦 What’s Inside the Performance Management KPI Dashboard in Power BI
This digital product includes a fully designed Power BI file powered by structured Excel input sheets:
📌 Summary Page
Acts as the performance control panel with KPI cards, slicers, and a detailed KPI performance table showing MTD and YTD results.
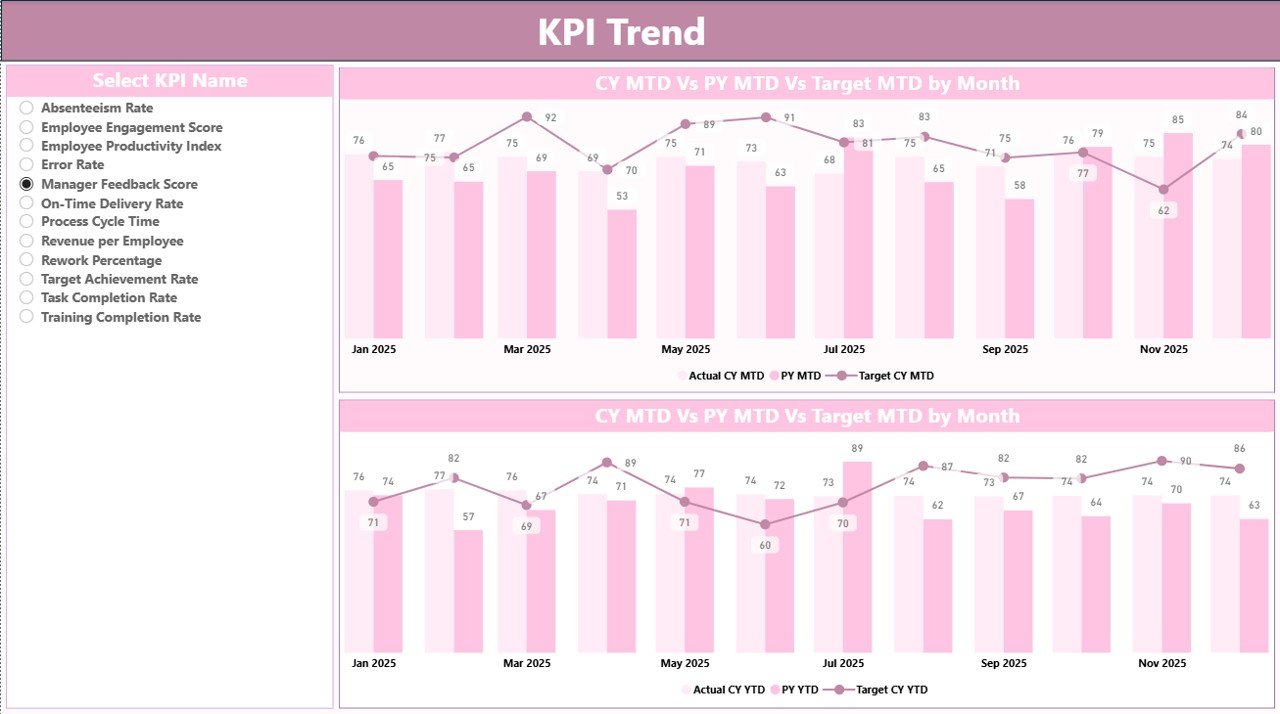
📌 KPI Trend Page
Provides visual trend analysis using combo charts for current year actuals, previous year actuals, and targets—helping you identify growth, decline, and seasonality.
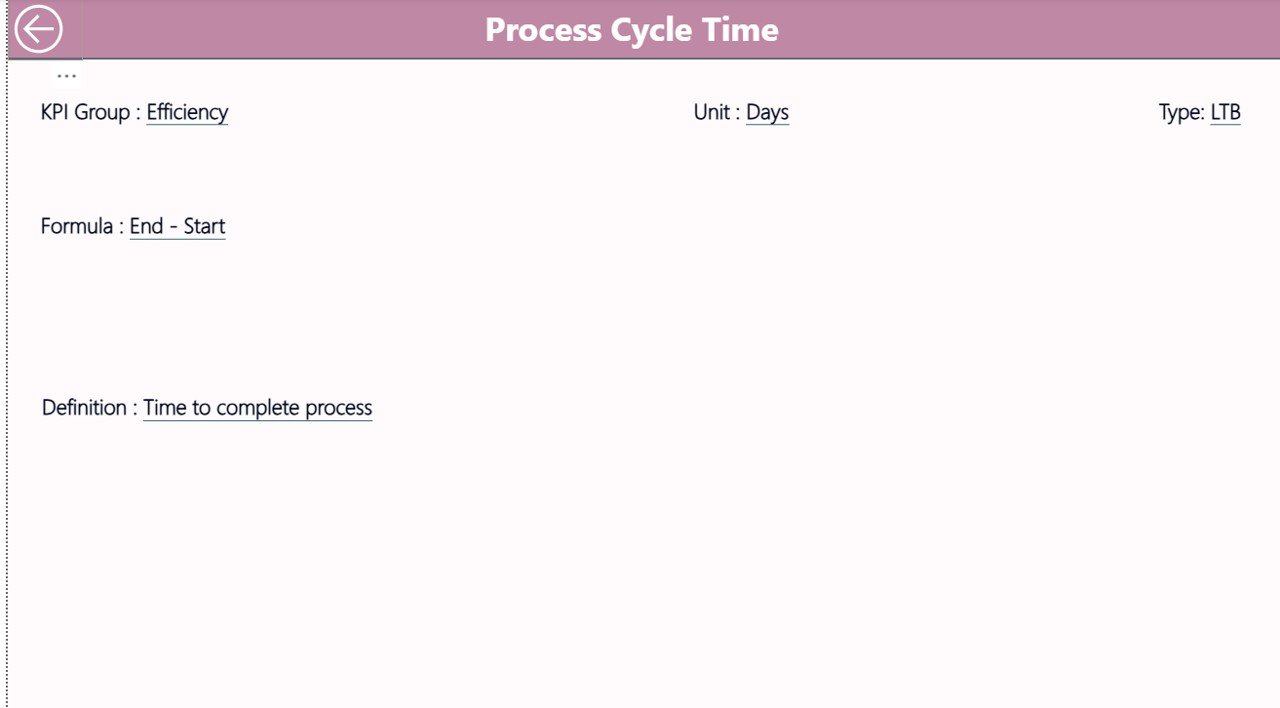
📌 KPI Definition (Drill-Through) Page
A hidden reference page that displays KPI formula, definition, unit, and type (LTB / UTB) for complete transparency.
📊 Excel Data Model
Includes Input_Actual, Input_Target, and KPI Definition sheets for easy and error-free data updates.
## 🛠️ How to Use the Performance Management KPI Dashboard in Power BI
Using this dashboard is simple—even for non-technical users:
1️⃣ Update monthly KPI actuals in the Excel Input_Actual sheet
2️⃣ Update targets in the Excel Input_Target sheet
3️⃣ Maintain KPI structure in the KPI Definition sheet
4️⃣ Refresh the Power BI dashboard
5️⃣ Use slicers, visuals, and drill-through to analyze performance
No advanced Power BI knowledge required. Focus on insights, not calculations.
## 👥 Who Can Benefit from This Performance Management KPI Dashboard in Power BI
This dashboard is ideal for:
🏢 Senior Leadership & CXOs – Get instant performance visibility
📊 Business Heads & Operations Managers – Track targets and execution
📈 PMO & Strategy Teams – Align KPIs with organizational goals
💼 HR & Finance Teams – Monitor efficiency and outcomes
🧠 MIS & Analytics Teams – Reduce manual reporting effort
It works seamlessly across industries such as corporate enterprises, consulting, manufacturing, IT services, healthcare, education, and more.
Click here to read the detailed blog post
Watch the step-by-step video tutorial:


Reviews
There are no reviews yet.