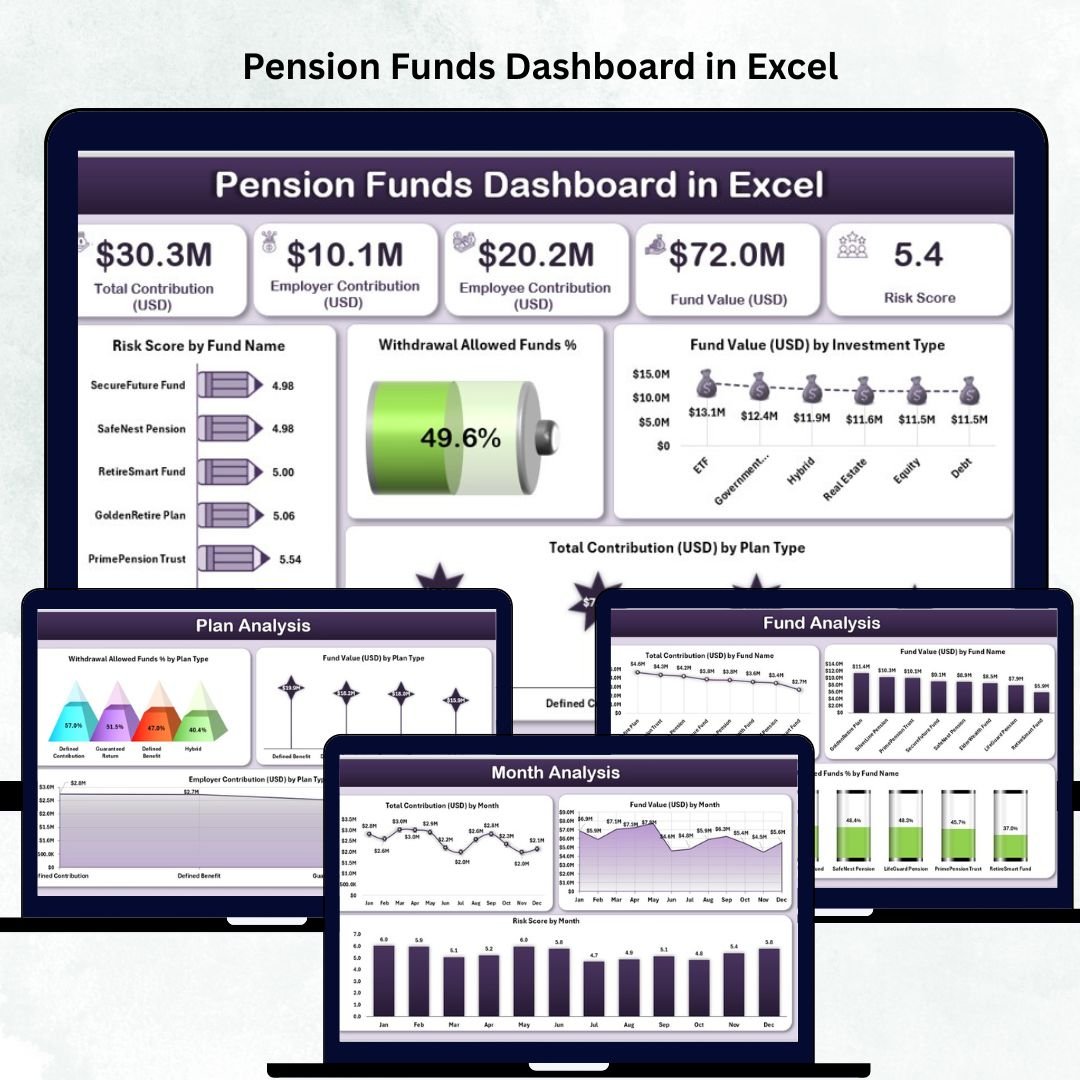


Managing pension funds requires accuracy, consistency, and real-time visibility. Yet many organizations still track pension performance manually through multiple sheets and scattered reports. This slows down reporting, creates confusion, and increases the chances of errors. To solve these challenges, we created the Pension Funds Dashboard in Excel — a clean, interactive, and ready-to-use dashboard designed to simplify pension monitoring for finance teams, HR departments, and employees.
This dashboard combines all pension-related KPIs such as fund value, contributions, risk score, withdrawal eligibility, investment type performance, and monthly trends into a single visual platform. With automated charts, slicers, and summary cards, Excel becomes a powerful insights engine that helps you plan, compare, and analyze pension funds instantly.
Whether you manage a small company fund or a large multi-plan structure, this dashboard brings full clarity and transparency to retirement planning.
✨ Key Features of the Pension Funds Dashboard in Excel
📌 Smart Page Navigator
A left-side page navigator helps you switch between different analysis pages instantly. No scrolling, no confusion — everything is one click away.
📌 Fully Interactive Slicers
Filter data by month, plan type, investment type, or fund name and watch all visuals update automatically.
📌 Automated KPI Cards & Charts
The dashboard uses built-in Excel formulas and visual components to deliver fast, accurate, and dynamic insights.
📦 What’s Inside the Pension Funds Dashboard
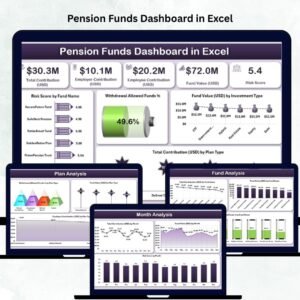
This dashboard includes five powerful analytical pages, each offering a complete view of pension performance.
🏠 1. Overview Page – Complete Snapshot of Pension Health
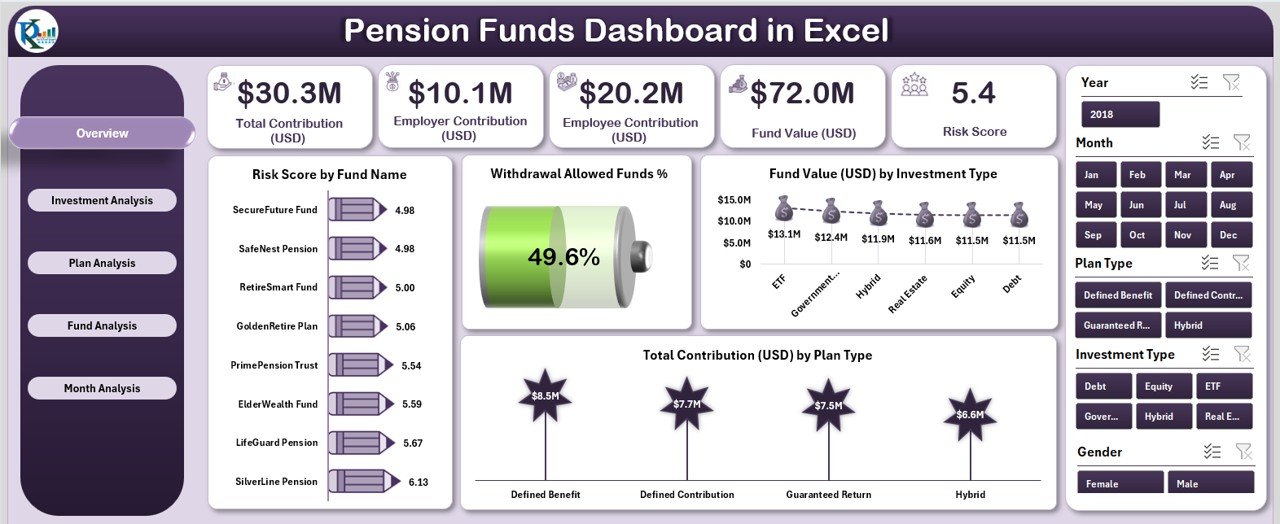
The Overview Page acts as the main control center of the dashboard.
What You See:
-
✔️ Month slicer on the right
-
✔️ Five KPI cards showing major numbers
-
✔️ Four detailed charts for quick insights
Charts Included:
-
Risk Score by Fund Name
-
Withdrawal Allowed Funds %
-
Fund Value (USD) by Investment Type
-
Total Contribution (USD) by Plan Type
This page helps employees and finance teams understand the pension landscape instantly.
💹 2. Investment Analysis Page – Study Investment Type Performance
Each investment type behaves differently in terms of value, contribution, and risk.
Charts on This Page:
-
Risk Score by Investment Type
-
Total Contribution (USD) by Investment Type
-
Employee Contribution (USD) by Investment Type
This page helps you evaluate which investment categories offer long-term stability and which ones carry higher risk.
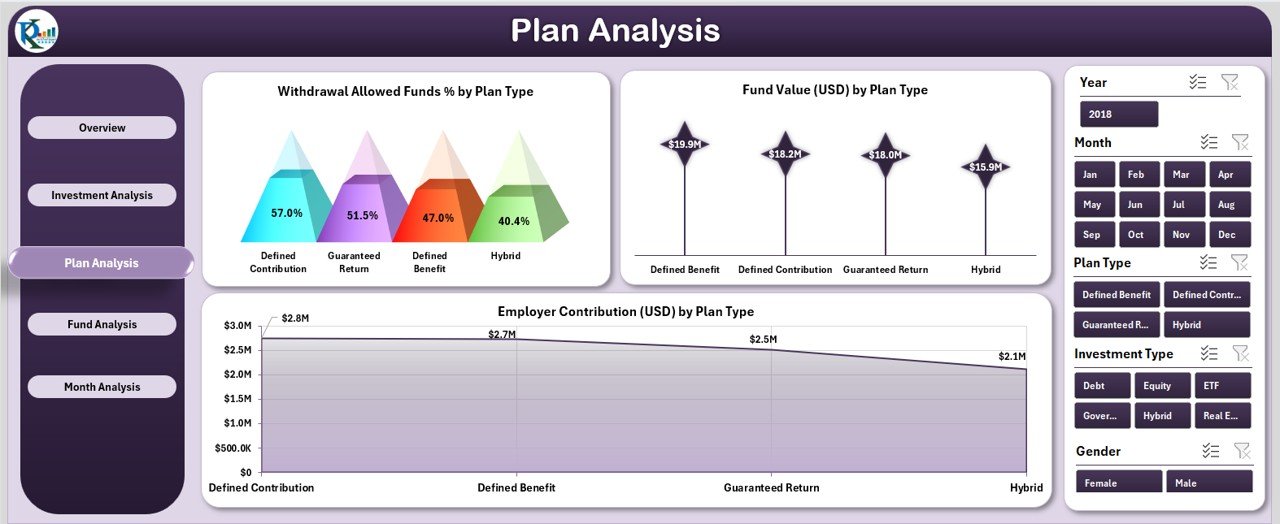
📄 3. Plan Analysis Page – Compare Plan Categories Easily
Plans differ in withdrawal rules, overall value, and employee contributions.
Charts Included:
-
Withdrawal Allowed Funds % by Plan Type
-
Fund Value (USD) by Plan Type
-
Employee Contribution (USD) by Plan Type
This page is essential for restructuring benefits, improving plan options, and communicating clearly with employees.
💼 4. Fund Analysis Page – Fund-Level Performance Review
Organizations often manage multiple pension funds. This page helps you compare each one.
Charts Included:
-
Total Contribution (USD) by Fund Name
-
Fund Value (USD) by Fund Name
-
Withdrawal Allowed Funds % by Fund Name
You identify top-performing funds, understand where contributions are flowing, and check withdrawal flexibility instantly.
📅 5. Month Analysis Page – Track Monthly Trends
Trends are important for long-term planning and forecasting.
Charts Included:
-
Total Contribution (USD) by Month
-
Fund Value (USD) by Month
-
Risk Score by Month
It helps you understand how contributions and fund values evolve month by month.
🧩 How to Use the Pension Funds Dashboard
📁 Update the Data Sheet
Just enter values for:
-
Fund names
-
Investment types
-
Plan categories
-
Monthly contributions
-
Fund values
-
Employee contributions
-
Risk scores
-
Withdrawal eligibility
The dashboard auto-updates everything — no manual calculations needed.
📁 Use the Support Sheet
This sheet contains formulas and helper tables that keep the dashboard running smoothly.
👥 Who Can Benefit from This Pension Dashboard
✔️ Finance Teams
Track funds, contributions, risk scores, and withdrawal rules easily.
✔️ HR Departments
Provide transparent pension insights to employees.
✔️ Pension Administrators
Ensure smooth reporting, planning, and fund management.
✔️ Employees
Understand contribution growth, fund value, risk levels, and plan features at a glance.
### Click hare to read the Detailed blog post
Visit our YouTube channel to learn step-by-step video tutorials
👉 Youtube.com/@PKAnExcelExpert


Reviews
There are no reviews yet.