Running a Pathology Labs Dashboard today is far more complex than simply processing samples. Labs must manage turnaround time, control delayed and pending tests, monitor costs, track revenue, and maintain consistent service quality across cities, labs, and test categories. However, many pathology labs still rely on manual Excel reports, disconnected systems, and delayed reviews. As a result, performance issues often remain hidden until they start impacting patient satisfaction and profitability. That is exactly why the Pathology Labs Dashboard in Power BI becomes a powerful and practical analytics solution.
This ready-to-use Power BI dashboard converts raw pathology lab data into a centralized, interactive, and visually intuitive performance management system. Instead of reviewing multiple spreadsheets, lab managers, operations teams, finance teams, and leadership can monitor all critical KPIs in one place. As a result, labs gain real-time visibility into turnaround times, pending tests, delayed percentages, revenue trends, and cost performance.
Because the dashboard is built in Power BI, users can filter, drill down, and analyze data dynamically without technical skills. Whether you want to review lab-wise performance, compare cities, or analyze test categories, the dashboard delivers insights instantly. Consequently, pathology labs move from reactive problem-solving to proactive performance optimization.
🔑 Key Features of Pathology Labs Dashboard in Power BI
🧪 Centralized Lab Performance Monitoring – Track turnaround time, pending tests, revenue, and costs in one interactive dashboard.
📊 Executive KPI Cards & Visuals – Instantly understand performance using high-impact cards and charts.
🎛️ Dynamic Slicers – Filter analysis by city, lab name, test category, and time period.
📈 Multi-Dimensional Analysis – Analyze performance across labs, cities, test categories, and months.
⚡ Automated & Real-Time Insights – Reduce manual reporting and speed up decision-making with Power BI automation.
📂 What’s Inside the Pathology Labs Dashboard in Power BI
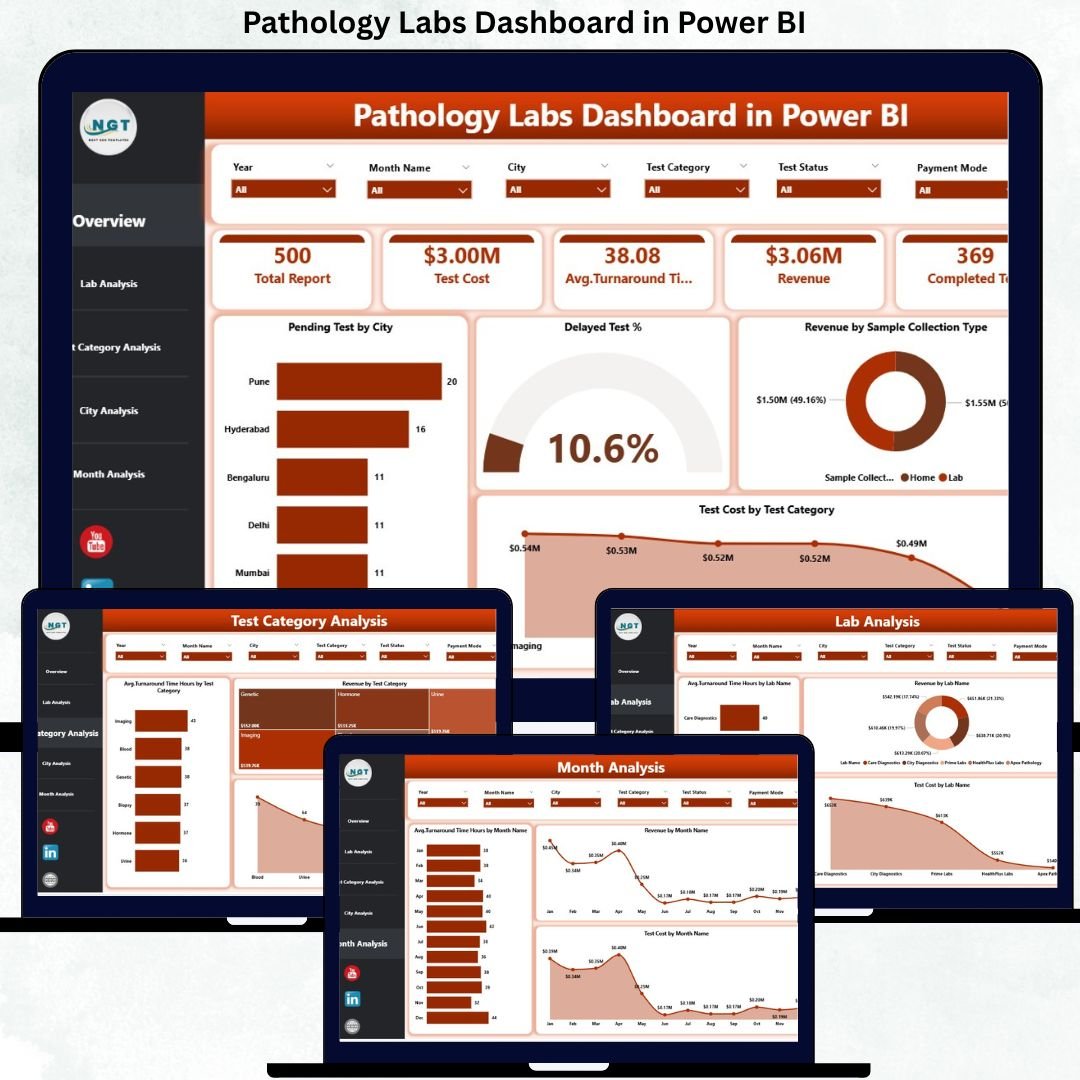
This professionally designed dashboard includes five structured and insight-driven pages, each focused on a specific analysis area:
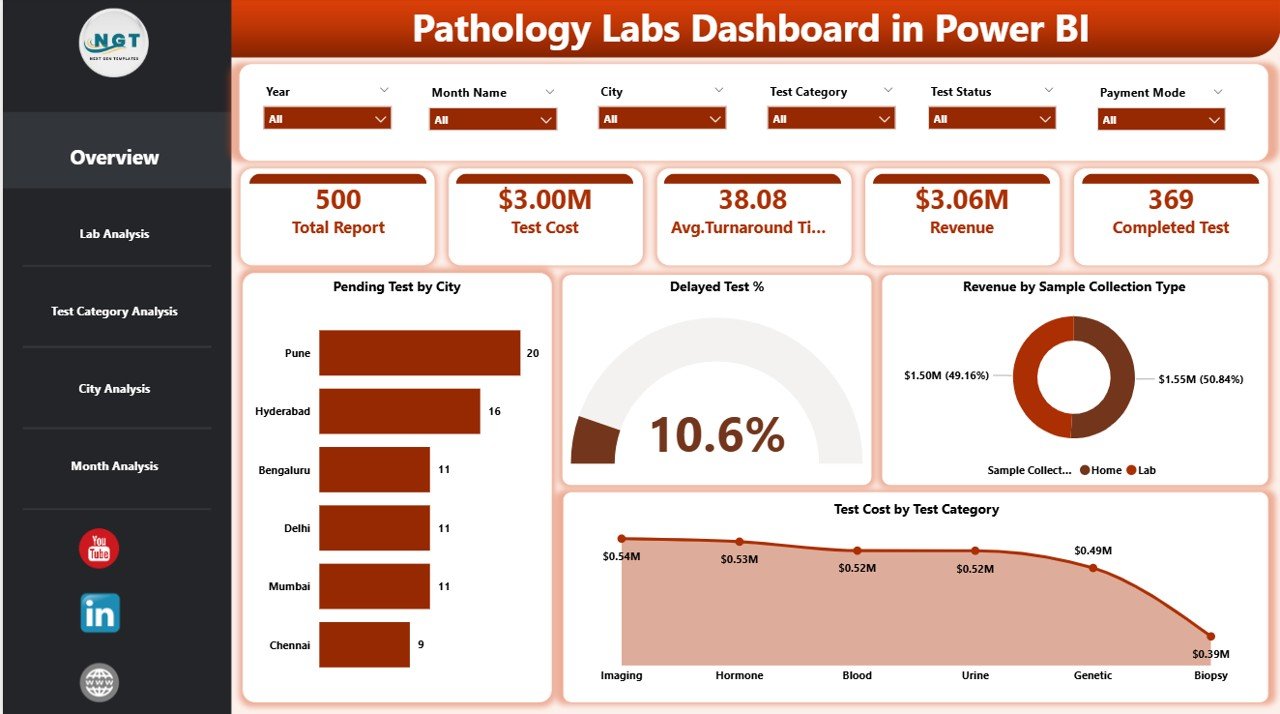
📊 Overview Page – A high-level snapshot with KPI cards such as Total Pending Tests, Delayed Test %, Total Revenue, and Total Test Cost, along with charts like Pending Tests by City, Revenue by Sample Collection Type, and Test Cost by Test Category.
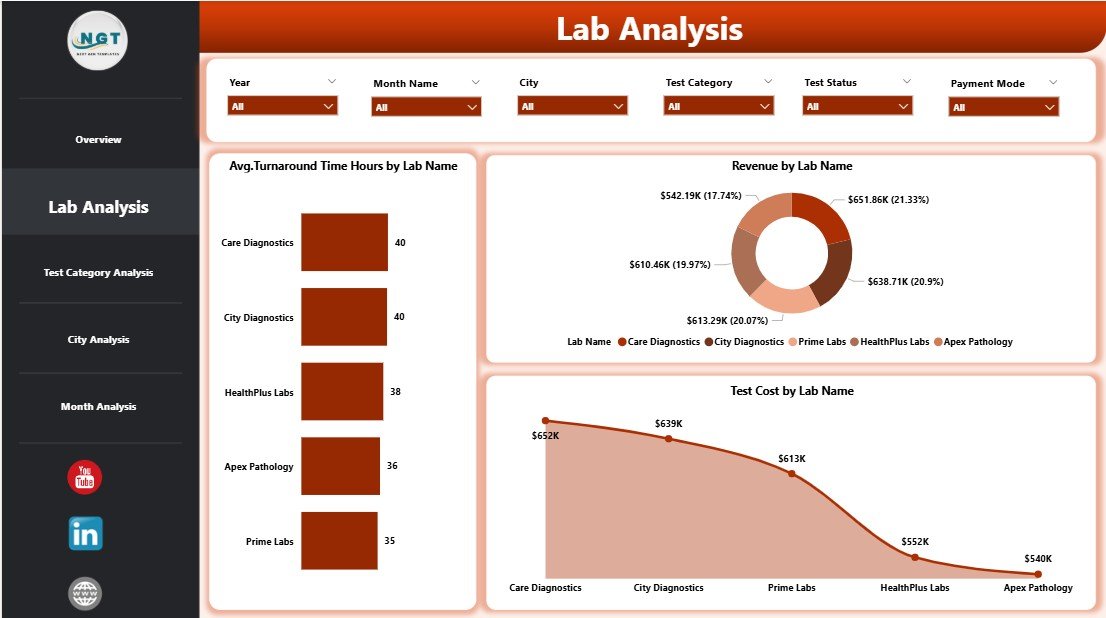
🏥 Lab Analysis Page – Analyze Average Turnaround Time (Hours), Revenue, and Test Cost by Lab Name to identify underperforming labs.
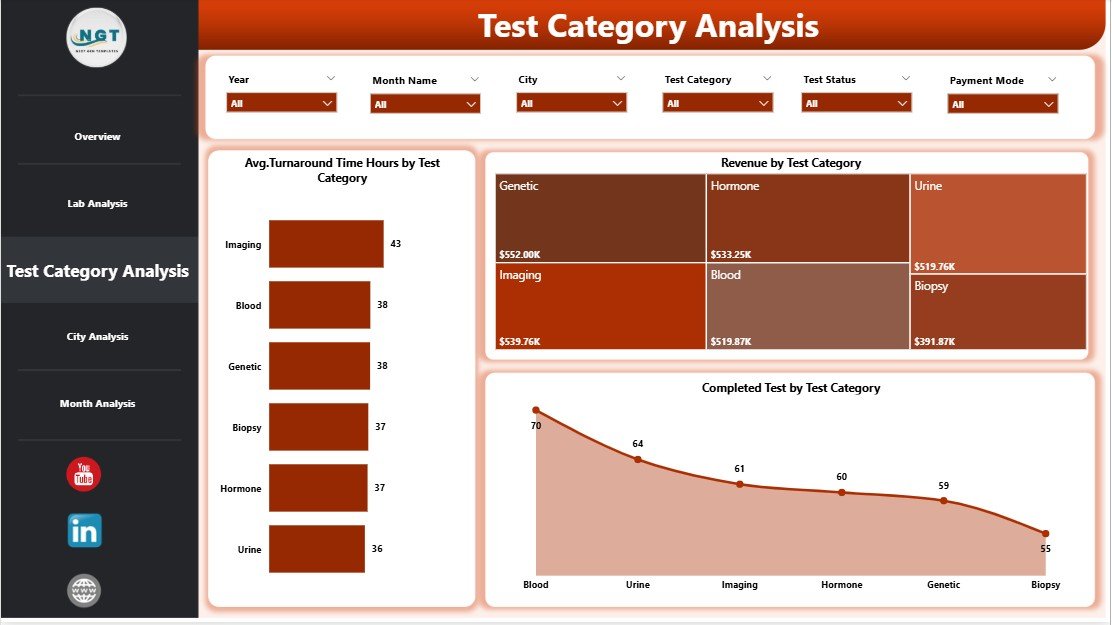
🧬 Test Category Analysis Page – Compare Average Turnaround Time, Revenue, and Cost by Test Category to balance efficiency and profitability.
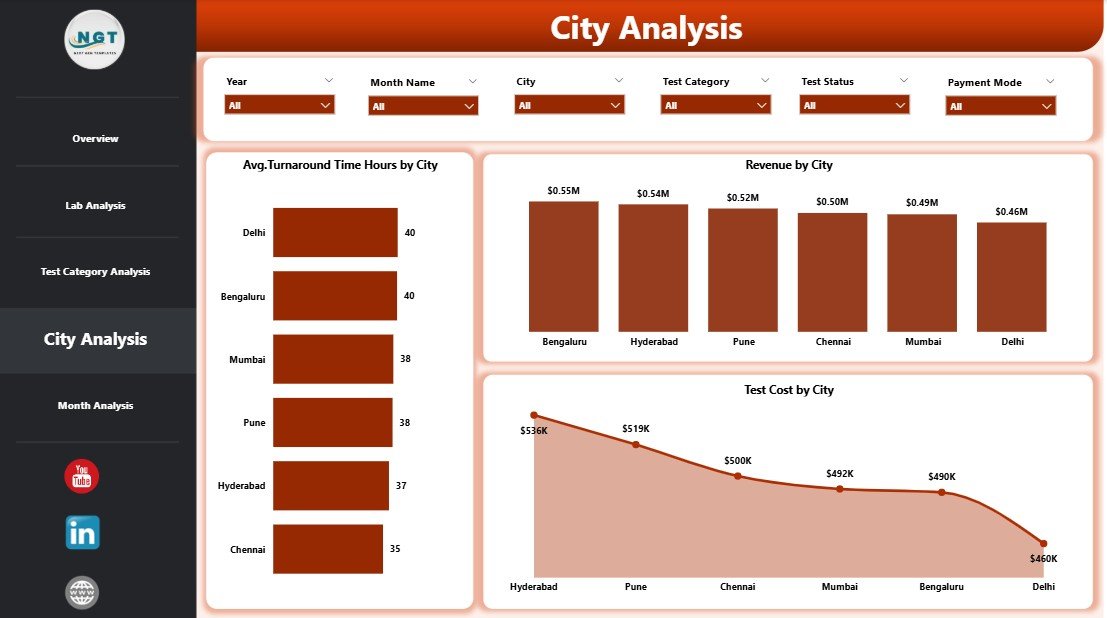
🌍 City Analysis Page – Evaluate Average Turnaround Time, Revenue, and Test Cost by City to improve regional performance.
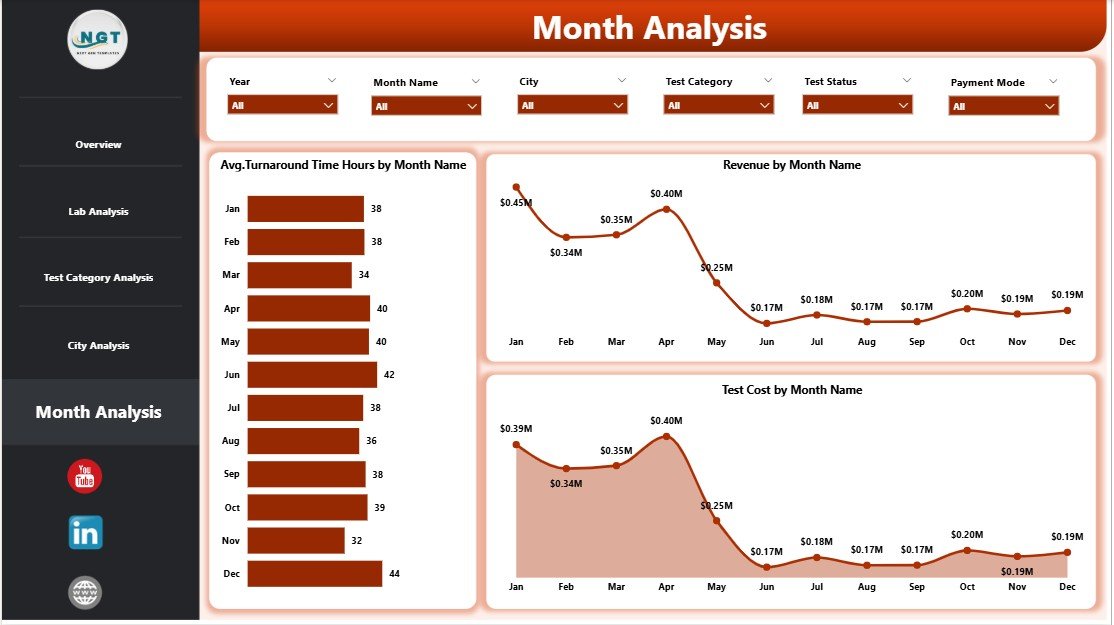
📅 Monthly Trends Page – Track Average Turnaround Time, Revenue, and Test Cost by Month to identify trends and seasonality.
Each page responds instantly to slicer selections, allowing users to move seamlessly from summary insights to detailed analysis.
▶️ How to Use the Pathology Labs Dashboard in Power BI
Using this dashboard is simple and user-friendly:
1️⃣ Connect your pathology lab data from Excel or databases.
2️⃣ Refresh the Power BI report to load updated data.
3️⃣ Use slicers to filter performance by city, lab, test category, or month.
4️⃣ Analyze KPIs, charts, and trends to identify delays, cost overruns, and revenue opportunities.
5️⃣ Take data-driven actions to improve turnaround time and service quality.
No advanced Power BI expertise is required for end users.
👥 Who Can Benefit from This Pathology Labs Dashboard in Power BI
This dashboard is ideal for:
🧪 Pathology Lab Owners
⚙️ Operations Managers
📋 Quality Control Teams
💰 Finance & Revenue Teams
🌍 Regional Managers
📊 Senior Leadership
Each stakeholder gains clarity, control, and confidence in decision-making.
### 👉 Click here to read the Detailed Blog Post
Visit our YouTube channel to learn step-by-step video tutorials.


Reviews
There are no reviews yet.