Running outlet stores is not just about selling more—it’s about selling smart. In today’s fast-moving retail world, outlet managers must control costs, hit targets, and understand which stores, regions, and categories actually drive profit. But if your reporting still depends on manual summaries and disconnected spreadsheets, you’ll always be reacting late… and losing opportunities daily.
That’s why we created the Outlet Stores Dashboard in Excel 🏬📊
It’s a ready-to-use analytics template that converts raw retail data into clean, powerful insights—so you can instantly track net sales, gross sales, costs, profit margin %, and targets across multiple outlets. With slicers, KPI cards, and interactive visuals, you get a full retail performance cockpit—without any expensive BI tool.
Whether you manage 3 outlets or 300, this dashboard helps you see the truth fast: which outlet is winning, which product category is draining profit, which region is growing, and which month needs attention.
Key Feature of Outlet Stores Dashboard in Excel
🚀 Ready-to-use Excel dashboard built for outlet store performance tracking
🧭 Page Navigator on the left to switch pages instantly (no worksheet hunting)
🎛️ Right-side slicers for quick filtering by your retail dimensions
📌 Overview KPI snapshot for leadership-ready reporting
🏬 Store-wise analysis to compare outlet performance and target achievement
📦 Product category insights to find best sellers and profit drivers
🌍 Region performance view to plan marketing and expansion smarter
📅 Month trend analysis to spot seasonality and forecast demand
💰 Profit Margin % tracking across stores, regions, and channels
🎯 Target vs Actual monitoring to drive accountability and execution
📂 Clean backend structure with a Data Sheet + Support Sheet for automation
What’s Inside the Outlet Stores Dashboard in Excel
This Excel file includes 5 analytical pages, each designed to answer a specific retail question:
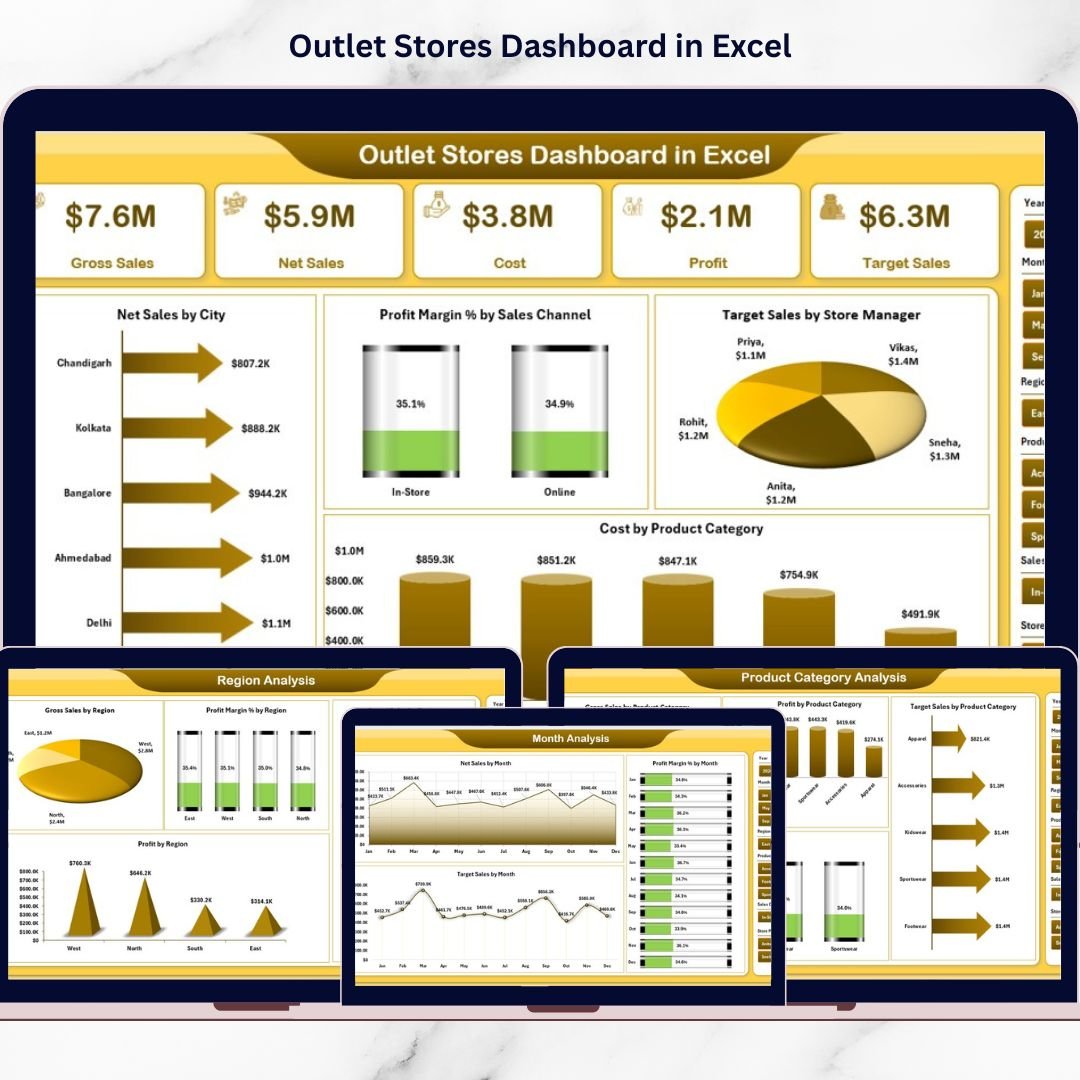
📌 1) Overview Page (All Stores Snapshot)
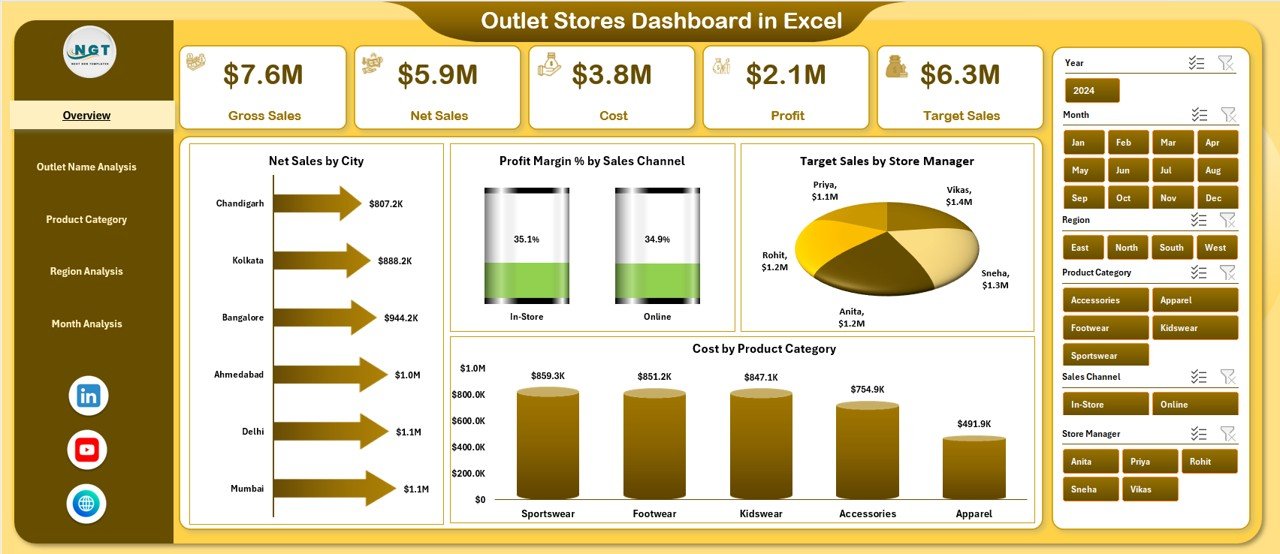
Your control panel showing high-level performance with slicers, KPI cards, and core visuals:
-
Net Sales by City
-
Profit Margin % by Sales Channel
-
Target Sales by Store Manager
-
Cost by Product Category
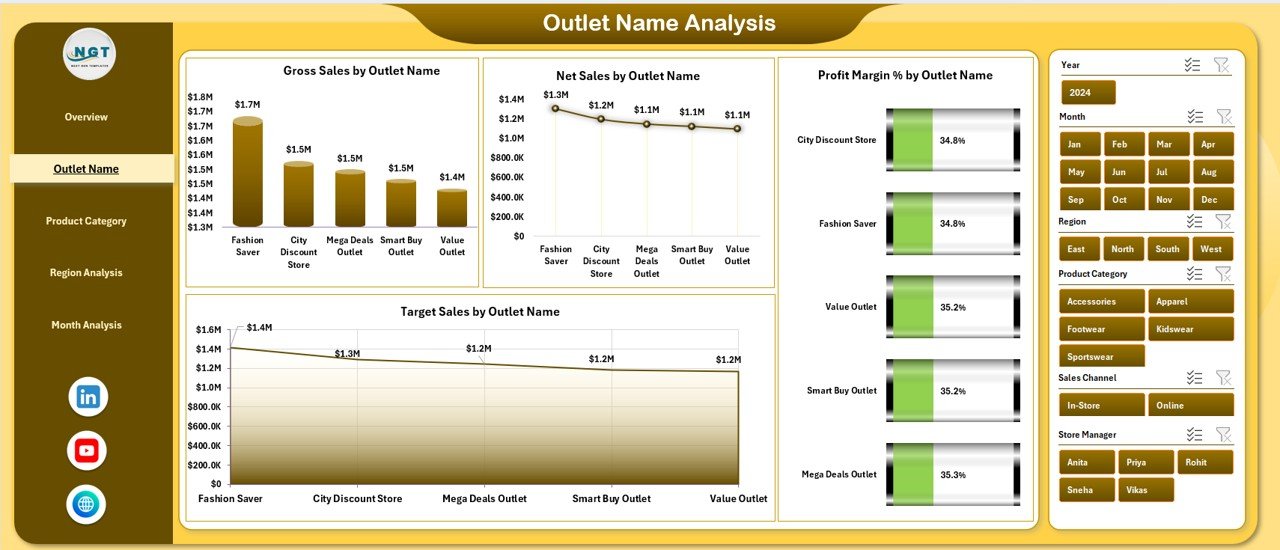
🏬 2) Outlet Name Analysis (Store Comparison)
See which outlets are winning—and which need immediate action:
-
Gross Sales by Outlet Name
-
Net Sales by Outlet Name
-
Profit Margin % by Outlet Name
-
Target Sales by Outlet Name
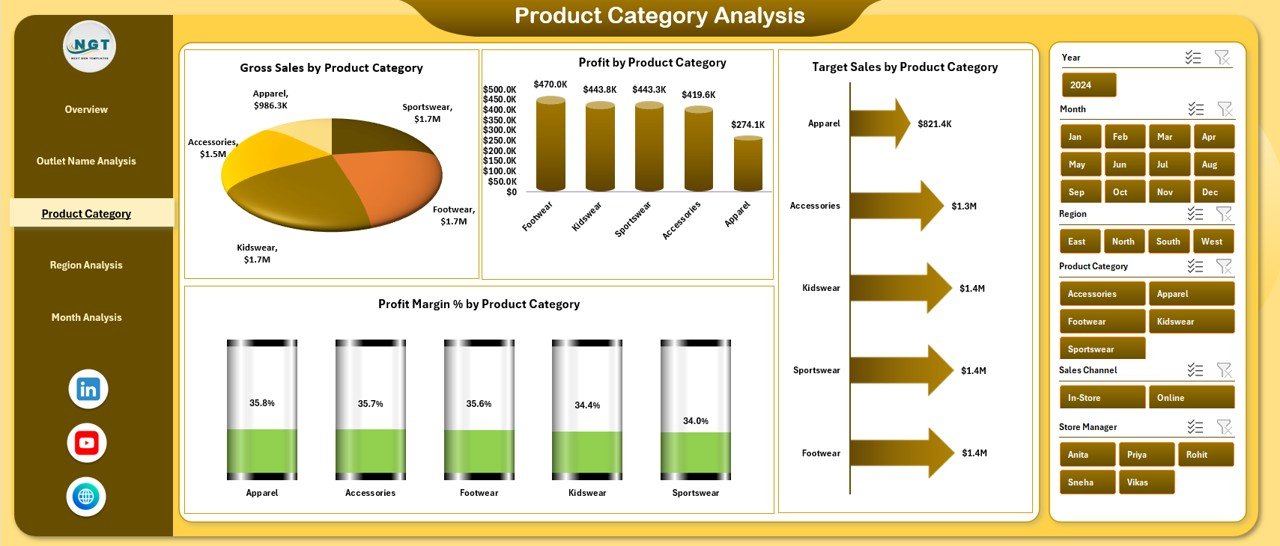
📦 3) Product Category Analysis (Profit Drivers)
Identify which categories generate revenue AND profit:
-
Gross Sales by Product Category
-
Target Sales by Product Category
-
Profit Margin % by Product Category
-
Profit by Product Category
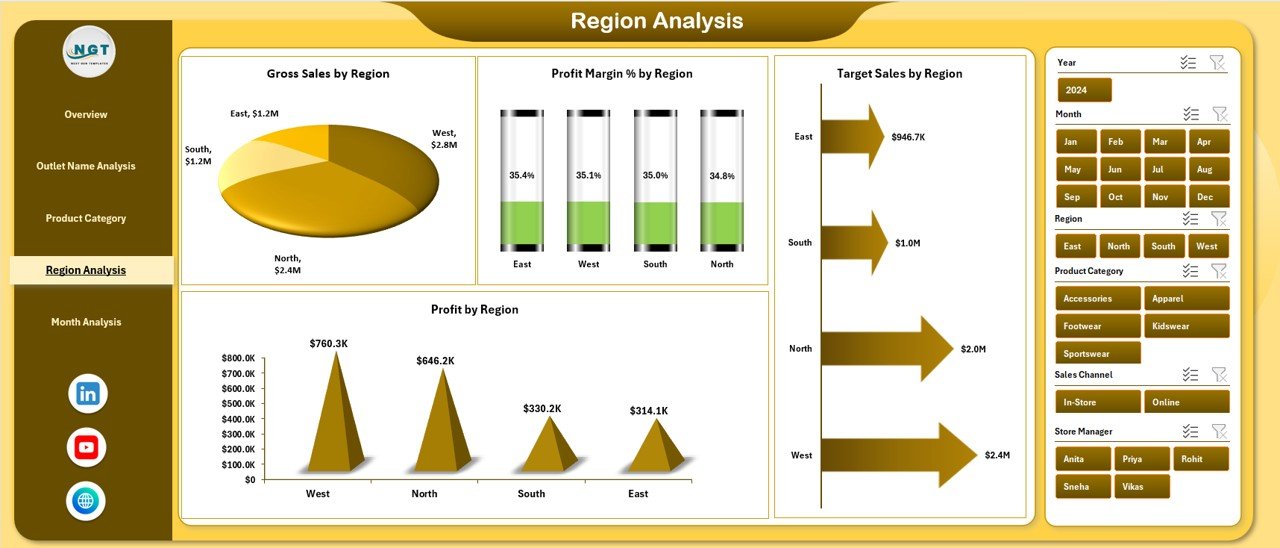
🌍 4) Region Analysis (Geographic Performance)
Perfect for planning budgets, promotions, and expansion:
-
Gross Sales by Region
-
Target Sales by Region
-
Profit Margin % by Region
-
Profit by Region
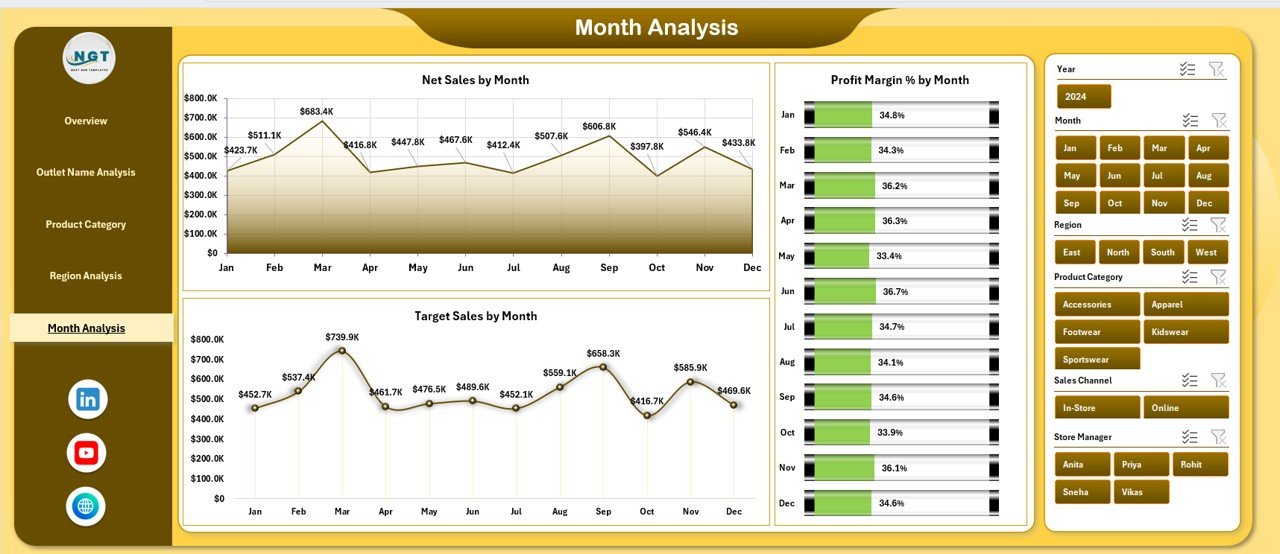
📅 5) Month Analysis (Trend & Seasonality)
Track performance over time to stay ahead of demand:
-
Net Sales by Month
-
Profit Margin % by Month
-
Target Sales by Month
📂 Backend Sheets Included
-
Data Sheet: where you store transaction-level retail data (outlet, region, category, sales, cost, targets, dates, etc.)
-
Support Sheet: the engine that runs calculations, lookups, and dashboard logic
How to Use the Outlet Stores Dashboard in Excel
No complex setup—just follow this simple workflow:
1️⃣ Prepare Your Retail Data
Collect store sales, costs, targets, regions, categories, and dates.
2️⃣ Paste Data into the Data Sheet
Update your dataset in a structured format (clean data = accurate dashboard).
3️⃣ Refresh/Update Calculations
The Support Sheet powers the visuals automatically, so reporting becomes instant.
4️⃣ Use Slicers to Filter Insights
Analyze specific outlets, regions, months, categories, cities, channels, or managers.
5️⃣ Take Action Using the 5 Analysis Pages
Spot underperforming outlets, reduce high costs, push profitable categories, and fix target gaps before they become losses.
Who Can Benefit from This Outlet Stores Dashboard in Excel
This dashboard is ideal for:
🏬 Retail Business Owners
👨💼 Outlet Store Managers
📊 Sales & MIS Analysts
💰 Finance & Profitability Teams
🌍 Regional Managers
🧠 Operations Executives
🤝 Retail Consultants
If your team needs faster reporting and stronger control across multiple outlets, this template delivers real results.
Click hare to read the Detailed blog post
Visit our YouTube channel to learn step-by-step video tutorials
Youtube.com/@PKAnExcelExpert


