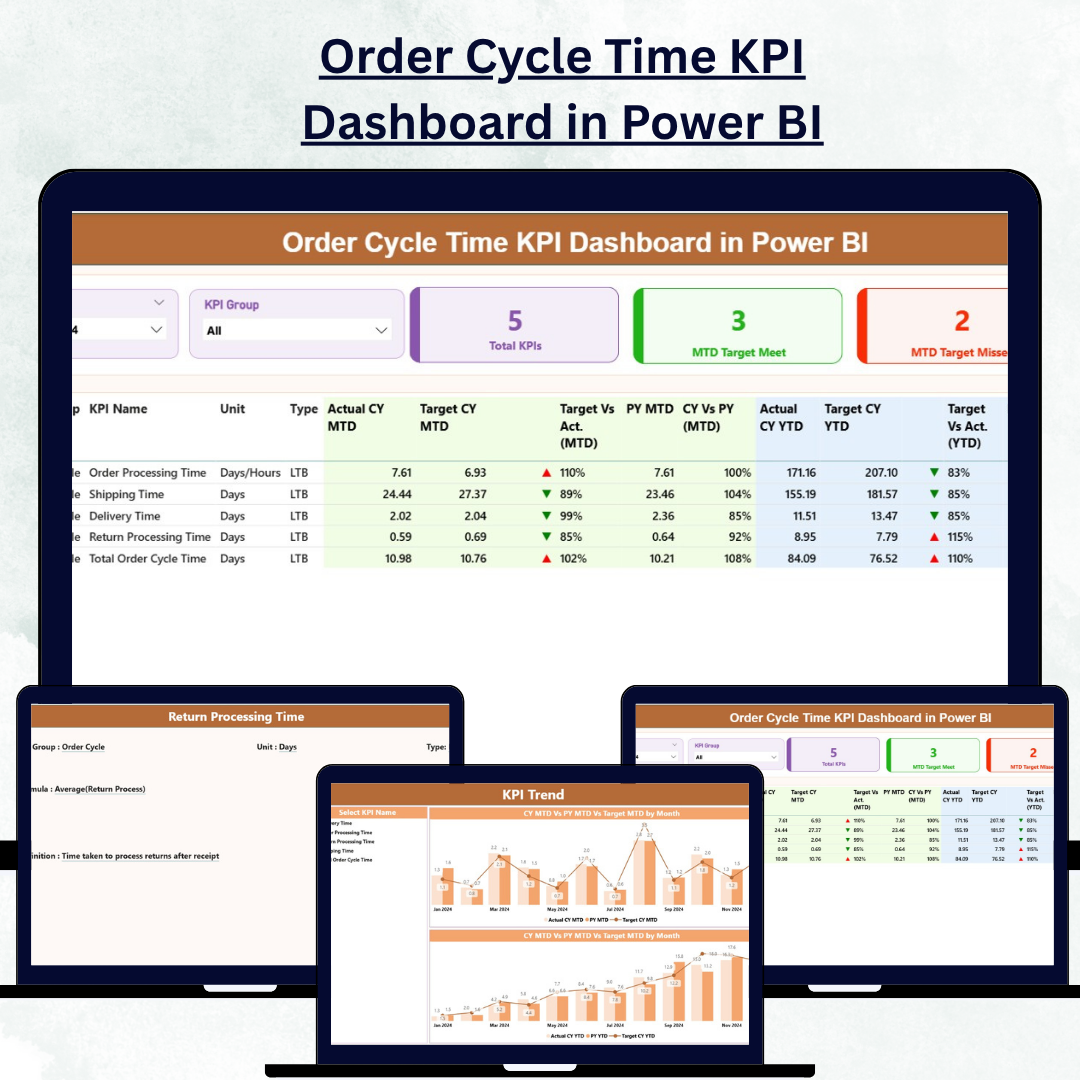
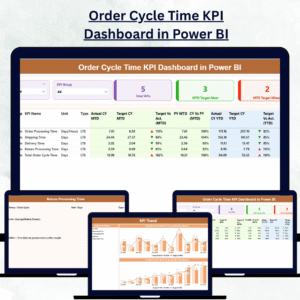
Speed and efficiency define modern business success — and monitoring them accurately is essential. The Order Cycle Time KPI Dashboard in Power BI helps organizations visualize and optimize every step of the order-to-delivery process with real-time precision.
Built with Microsoft Power BI and powered by Excel data, this interactive dashboard empowers businesses to analyze, compare, and improve order fulfillment performance effortlessly. By tracking key metrics such as cycle time, on-time delivery rate, and order accuracy, this dashboard transforms operational data into actionable insights that drive efficiency and customer satisfaction.
⚙️ Key Features of the Order Cycle Time KPI Dashboard in Power BI
This ready-to-use Power BI file includes three powerful analytical pages, each designed to simplify performance tracking and decision-making.
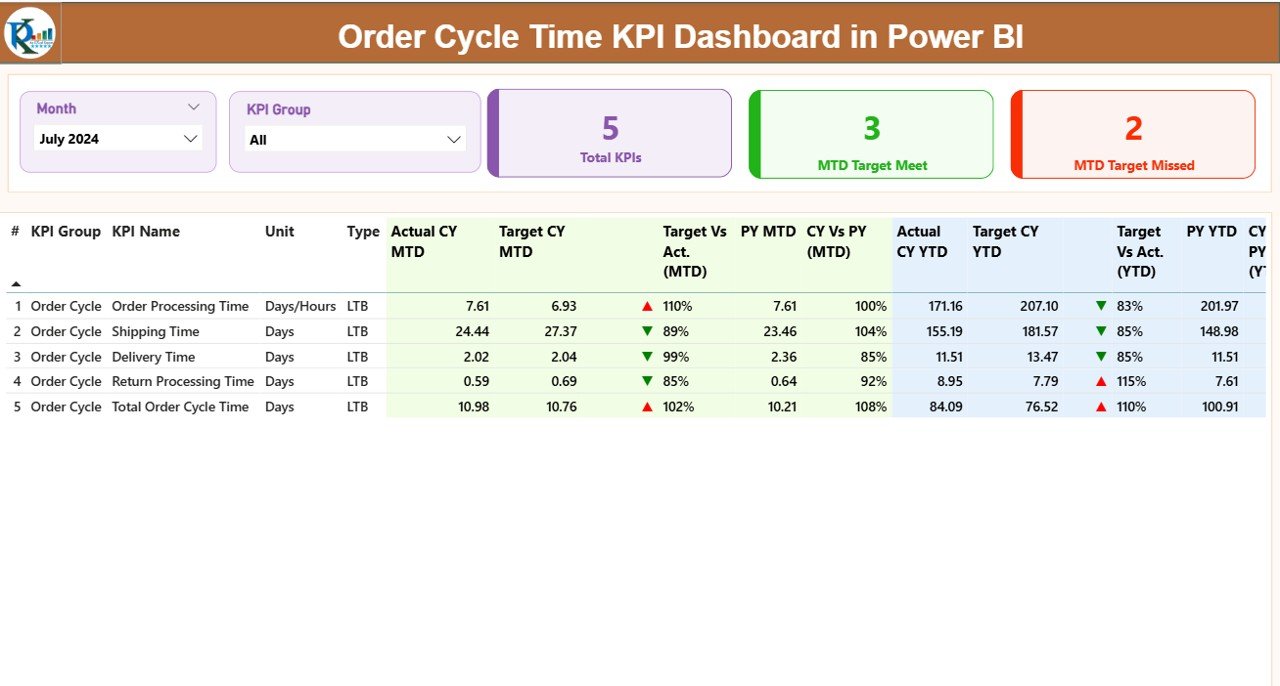
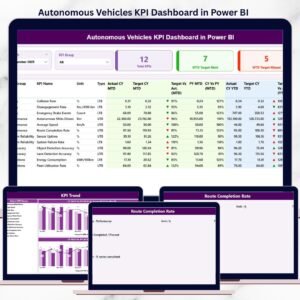
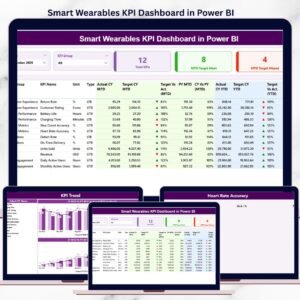
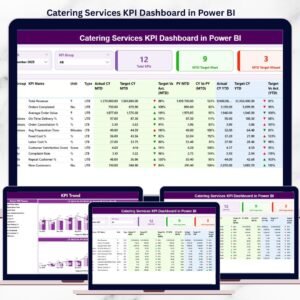
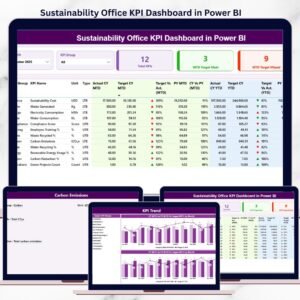
📊 1️⃣ Summary Page – The Performance Overview Hub
The Summary Page offers a complete snapshot of key performance metrics across your order management process.
Highlights:
-
Slicers: Filter by Month and KPI Group for flexible data exploration.
-
KPI Cards:
-
Total KPIs Count
-
MTD Target Met Count
-
MTD Target Missed Count
-
-
Detailed KPI Table:
Includes KPI Number, Group, Name, Unit, Type (LTB/UTB), MTD and YTD Actuals vs Targets, plus green/red indicators (▲/▼) for quick performance evaluation. -
Comparative Insights:
-
CY vs PY (Current Year vs Previous Year) MTD and YTD metrics
-
Actual vs Target percentage ratios
-
This page provides a high-level overview, helping managers identify areas that need immediate attention.
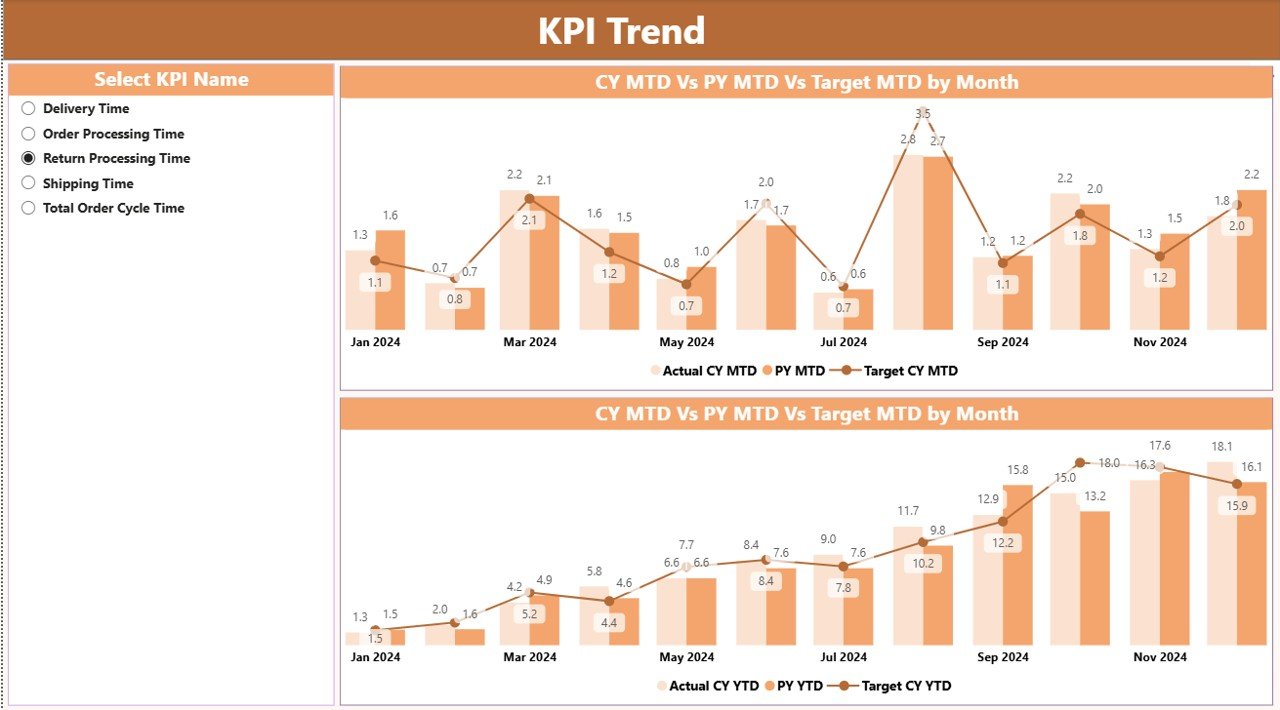
📈 2️⃣ KPI Trend Page – Analyze Trends Over Time
The KPI Trend Page dives deeper into performance patterns with dynamic combo charts that display Actual, Target, and Previous Year data for both MTD and YTD.
Features:
-
KPI Name slicer for focused analysis
-
Visual comparison of improvement or decline trends
-
Dual-chart layout (MTD vs YTD) for complete visibility
With these insights, organizations can track how operational speed, accuracy, and efficiency evolve month after month — ensuring every delay or improvement is captured in real time.
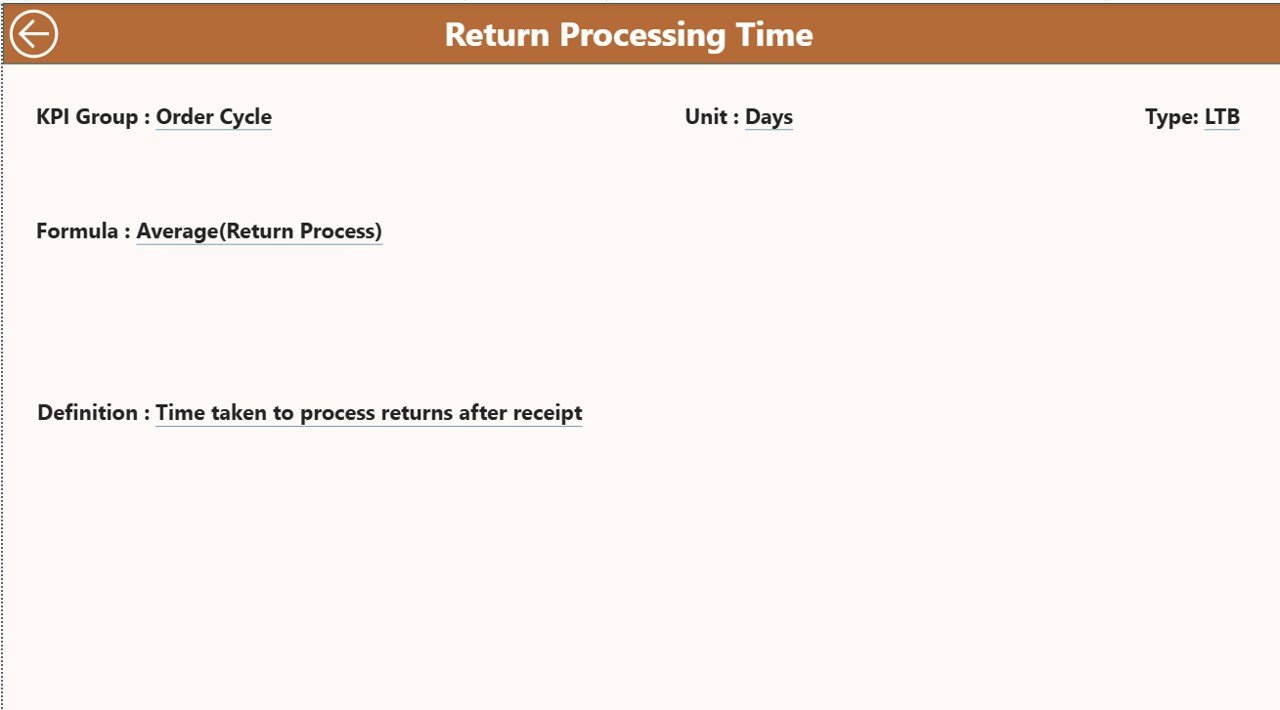
📘 3️⃣ KPI Definition Page – Maintain Transparency and Clarity
The KPI Definition Page functions as a drill-through sheet where users can right-click any KPI to view its detailed formula, definition, and type (LTB or UTB).
Highlights:
-
View each KPI’s formula and definition for consistency
-
Easy navigation with a “Back” button to return to the main dashboard
-
Enhances data transparency and ensures everyone interprets KPIs uniformly
This page is a powerful reference tool for maintaining KPI governance across departments.
🧩 What’s Inside the Dashboard
✅ 3 Interactive Power BI Pages: Summary, KPI Trend, and KPI Definition
✅ Excel Data Integration: Seamless connection for real-time updates
✅ Dynamic Filters and Slicers: For Month, KPI Group, and KPI Name
✅ Color-Coded Indicators: Green ▲ for met targets and Red ▼ for missed KPIs
✅ Drill-Through Functionality: Explore KPI definitions instantly
💡 How to Use the Order Cycle Time KPI Dashboard
1️⃣ Connect Excel Data: Link your Excel sheets containing Actual, Target, and Definition tables.
2️⃣ Refresh Automatically: Schedule daily or weekly data refreshes.
3️⃣ Filter Performance: Use slicers to analyze specific KPIs or months.
4️⃣ Track Variances: Compare Actual vs Target and CY vs PY results.
5️⃣ Drill Through for Details: Explore KPI formulas and definitions when needed.
With a few clicks, managers gain full visibility of their order fulfillment performance.
🌟 Who Can Benefit from This Dashboard
🏭 Manufacturing Companies: Track production-to-delivery cycles.
🚚 Logistics Providers: Monitor shipping accuracy and lead time.
🛍️ Retail & E-Commerce: Improve order fulfillment speed and reliability.
🏢 Operations Teams: Identify bottlenecks and optimize workflow efficiency.
📈 Advantages of the Order Cycle Time KPI Dashboard in Power BI
✔️ Real-Time Monitoring: Stay updated with the latest MTD and YTD results.
✔️ Enhanced Decision-Making: Visual insights enable fast, data-driven action.
✔️ Performance Benchmarking: Compare current metrics with historical performance.
✔️ Time Savings: Automated updates replace manual reporting.
✔️ Cross-Functional Visibility: Unifies HR, logistics, and operations teams around shared KPIs.
✔️ Improved Efficiency: Shorten cycle times and enhance fulfillment accuracy.
🧠 Best Practices for Using This Dashboard
✅ Keep Excel data consistent and verified before refreshing.
✅ Maintain clear KPI definitions and formulas for accuracy.
✅ Schedule regular Power BI data refreshes.
✅ Use conditional formatting to emphasize critical KPIs.
✅ Review trend charts weekly for actionable insights.
✅ Customize color themes and visuals to fit your corporate identity.
🚀 Why Power BI Is Ideal for Order Performance Analytics
Unlike static reports, Power BI combines automation, interactivity, and advanced data visualization — providing real-time clarity for better supply chain and operations management.
It seamlessly connects with Excel, ERP, and CRM systems, allowing you to scale your analytics as your business grows.
🎯 Conclusion
The Order Cycle Time KPI Dashboard in Power BI is more than just a reporting tool — it’s a performance accelerator. By integrating Excel-based KPI data into an automated, visual, and interactive Power BI report, it empowers organizations to measure, analyze, and improve order processing efficiency effortlessly.
From tracking MTD vs YTD performance to spotting bottlenecks and forecasting future trends, this dashboard helps teams make smarter, faster decisions that boost delivery performance, reduce costs, and enhance customer satisfaction.
Whether you manage logistics, retail, or manufacturing operations, this dashboard gives you complete control over your order lifecycle — from entry to delivery.
🔗 Click here to read the Detailed Blog Post
🎥 Visit our YouTube channel for tutorials
🔗 YouTube.com/@PKAnExcelExpert


Reviews
There are no reviews yet.