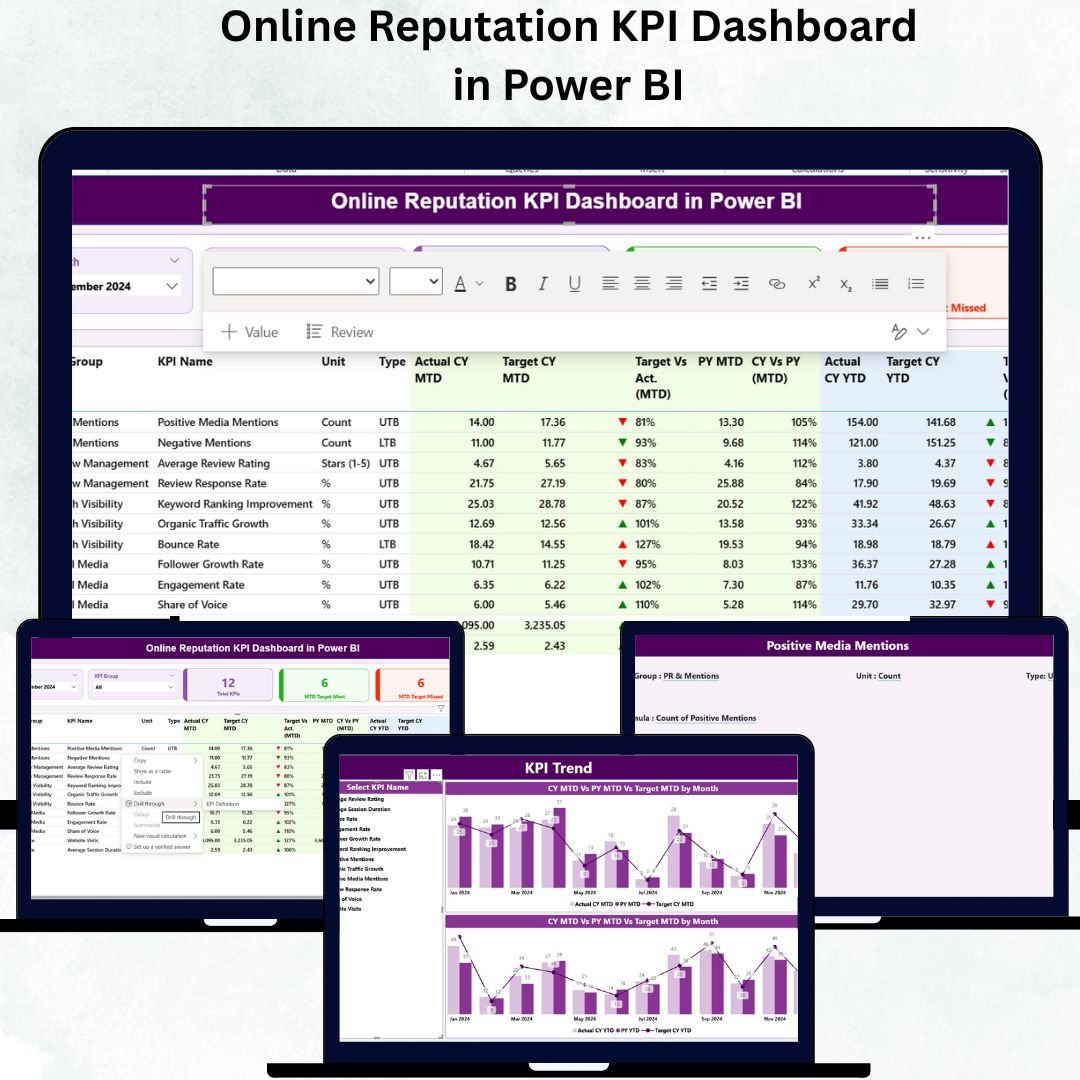
In today’s digital era, your brand’s reputation defines your success. Every customer review, social media post, or online mention can make or break trust. That’s why we created the Online Reputation KPI Dashboard in Power BI — a powerful and ready-to-use business intelligence solution that helps you monitor, measure, and enhance your online reputation effortlessly.
This data-driven dashboard consolidates reviews, ratings, sentiment scores, and response times into stunning Power BI visuals — giving you instant clarity on how your brand is perceived online. 🚀
✨ Key Features of Online Reputation KPI Dashboard in Power BI
⭐ Comprehensive Reputation Tracking – Monitor KPIs such as average rating, sentiment score, and social engagement from one central platform.
📊 Interactive Visuals – Dynamic Power BI charts and cards provide real-time insights using color-coded indicators and trend arrows.
🧩 Customizable Structure – Modify KPIs, filters, and visuals to match your brand’s goals.
⚡ Real-Time Data Updates – Refresh your dashboard automatically using Excel sheets or social media API connections.
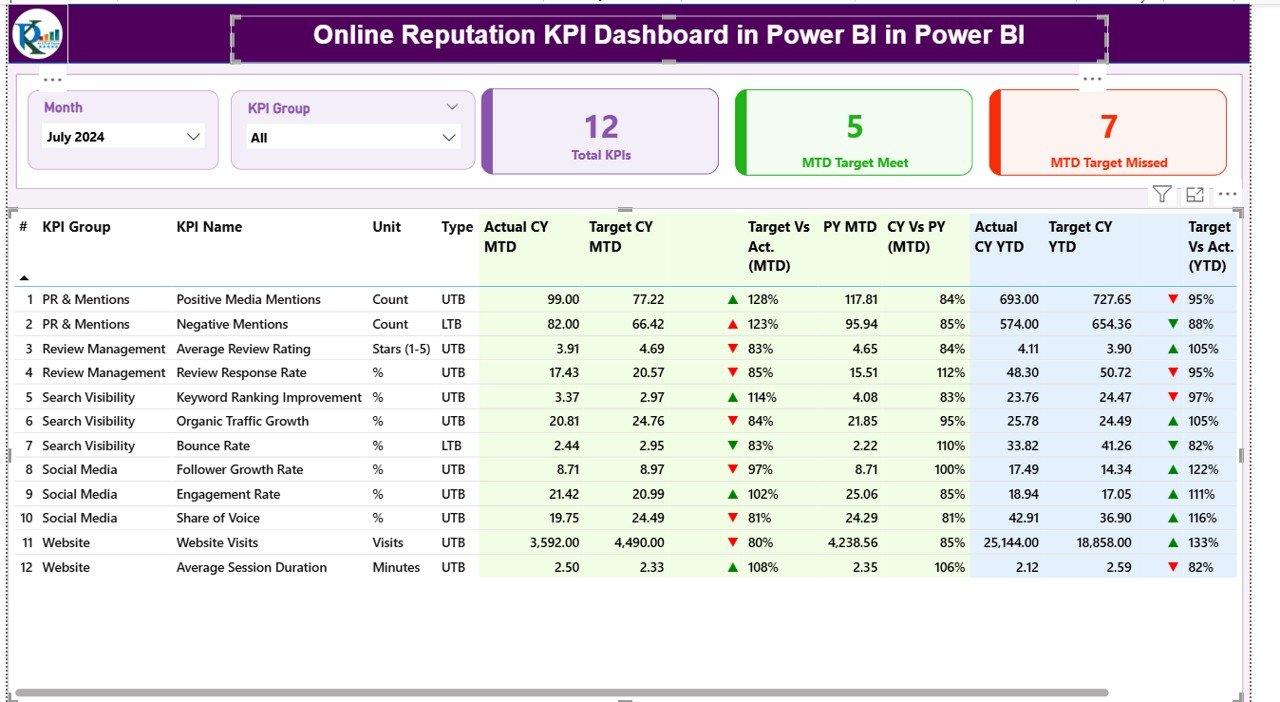
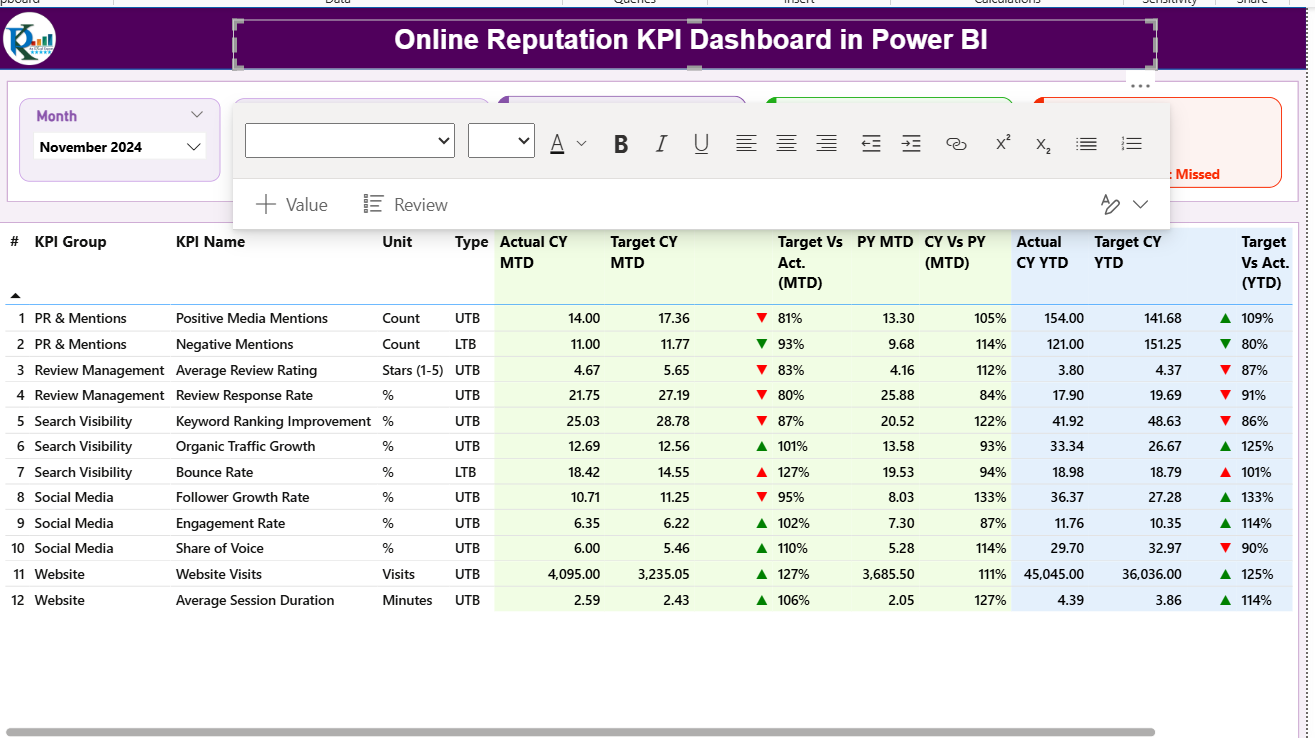
🔁 Month & Year Comparisons – Compare Month-to-Date (MTD) and Year-to-Date (YTD) results for Actual, Target, and Previous Year.
📈 Conditional Formatting – Instantly see positive or negative performance trends with green/red arrows.
🧠 Data Transparency – Every KPI is well-defined with units, formulas, and type (UTB/LTB) for complete clarity.
💬 Centralized View – Consolidate all your brand data — from Google Reviews, Facebook, and Twitter — into one visual hub.
📦 What’s Inside the Online Reputation KPI Dashboard in Power BI
This powerful dashboard is organized across seven key pages, each designed to deliver meaningful insights:
1️⃣ Summary Page – The central navigation hub with buttons to all other pages and a snapshot of key metrics like sentiment score, total reviews, and average rating.
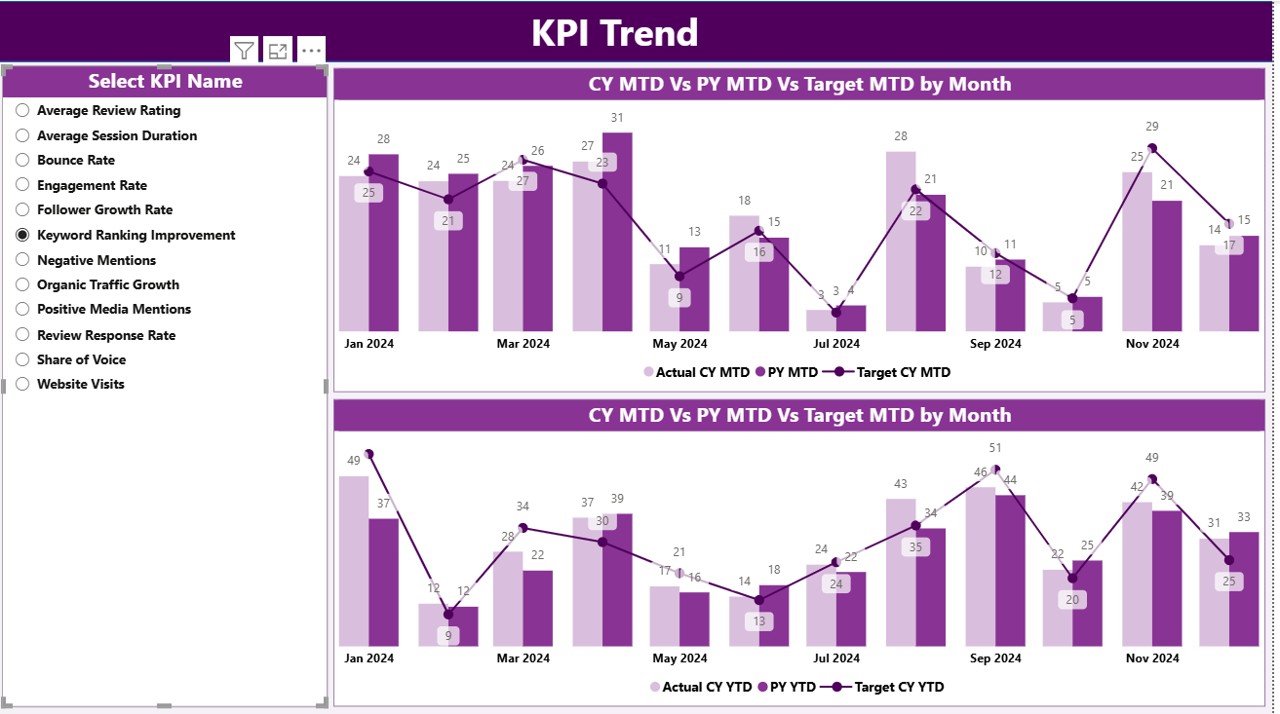
2️⃣ KPI Trend Page – The analytical powerhouse of your dashboard. Select any month (cell D3) and watch every KPI update dynamically with MTD vs YTD insights and trend arrows.
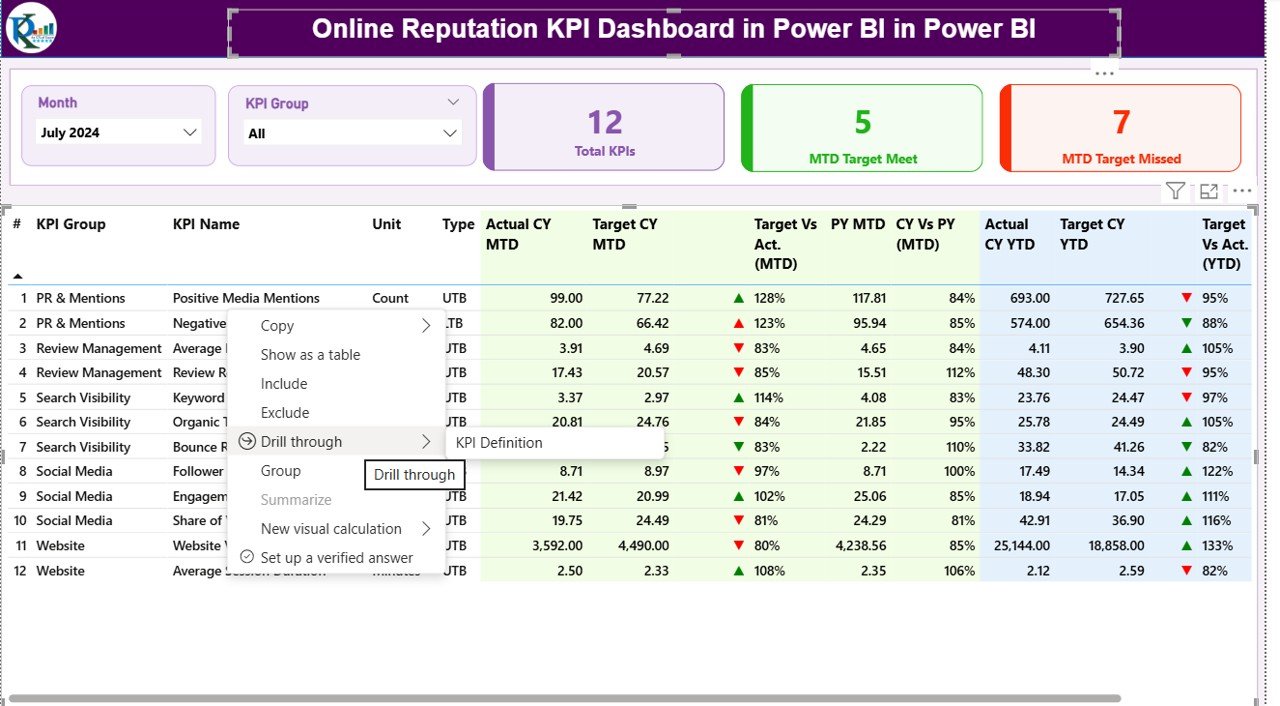
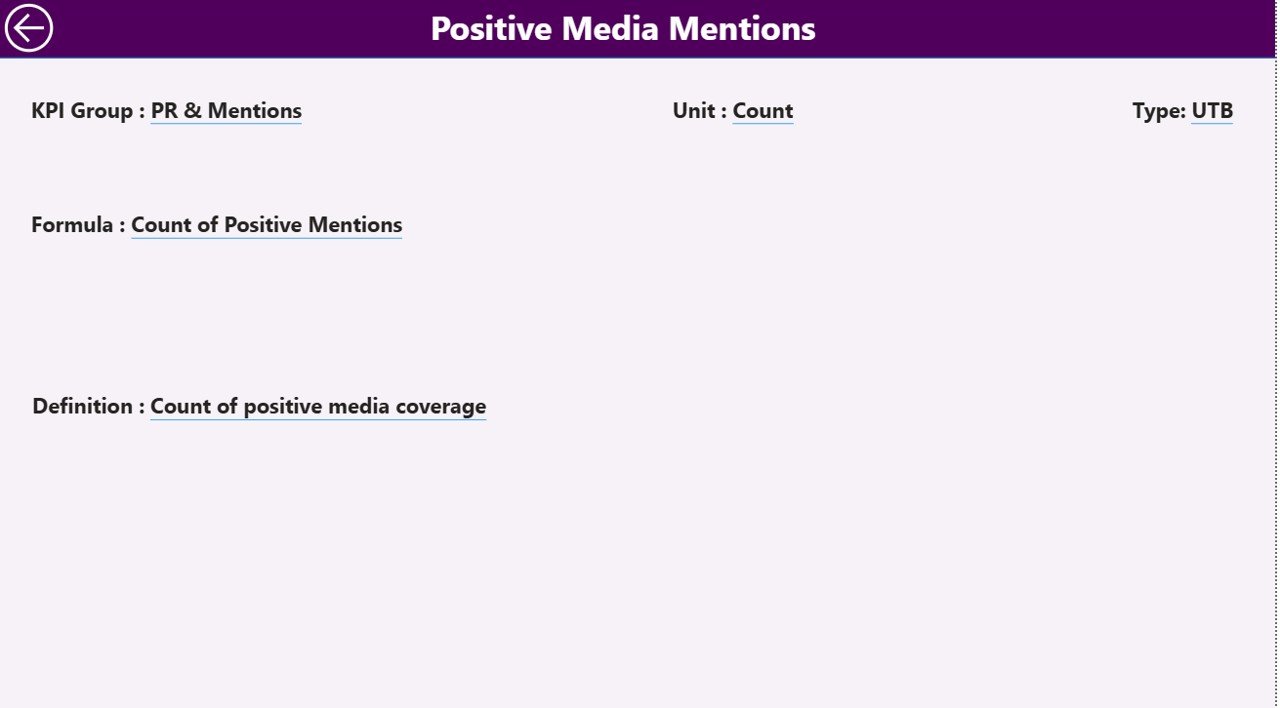
3️⃣ KPI Definition Page – Understand every metric clearly with details like KPI Group, Formula, Unit, and Type (UTB or LTB).
4️⃣ Input_Actual Sheet – Store your actual monthly KPI values such as sentiment, star ratings, or response time.
5️⃣ Input_Target Sheet – Define success benchmarks with target MTD and YTD values for each KPI.
6️⃣ KPI Definition Sheet – Acts as the dashboard’s backbone with all KPI logic, formulas, and descriptions.
7️⃣ Data Model Integration – Connect Excel sheets or APIs for automated refreshes and smooth Power BI performance.
🧭 How to Use the Online Reputation KPI Dashboard in Power BI
🪄 Step 1: Open the dashboard file in Power BI Desktop.
🪄 Step 2: Import or update your latest review and sentiment data in the Input_Actual sheet.
🪄 Step 3: Set targets in the Input_Target sheet for each KPI.
🪄 Step 4: Use the Month Selector (cell D3) to view MTD or YTD performance for a chosen month.
🪄 Step 5: Drill through to analyze trends — see where ratings dipped or mentions rose.
🪄 Step 6: Refresh your data to keep insights live and up-to-date.
💡 Within minutes, you’ll have a visually stunning Power BI dashboard that transforms your reputation data into actionable business intelligence.
👥 Who Can Benefit from This Online Reputation KPI Dashboard
🏢 Marketing Teams – Track brand sentiment and engagement across all digital channels.
🎯 Public Relations Departments – Monitor media mentions and online visibility in real time.
📱 Social Media Managers – Analyze customer feedback, response time, and engagement rates.
🧑💼 Customer Experience Managers – Identify trends and areas for service improvement.
💼 Business Owners & Executives – Gain a top-level view of brand reputation health and decision-ready insights.
🌍 Agencies & Consultants – Use this dashboard to deliver professional online reputation analysis for clients.
Click here to read the Detailed blog post
Watch the step-by-step video tutorial:
Visit our YouTube channel to learn step-by-step video tutorials and see this dashboard in action.


Reviews
There are no reviews yet.