
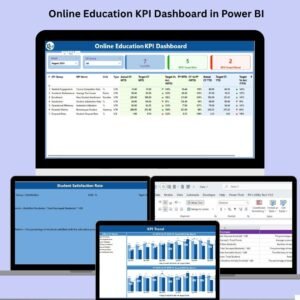
Online education platforms are thriving—but are you effectively tracking what truly matters? With student engagement, course completion, and learner satisfaction on the line, it’s critical to have real-time visibility into your performance. That’s where the Online Education KPI Dashboard in Power BI comes in. 📊📚
Designed for schools, universities, and e-learning platforms, this dashboard bridges Excel’s familiarity with Power BI’s powerful analytics. Whether you’re monitoring course performance or analyzing student feedback, this all-in-one tool helps you measure success, identify trends, and take data-backed action—without writing a single line of code.
✨ Key Features of Online Education KPI Dashboard
🏠 Summary Page – At-a-Glance Performance View

-
Month & KPI Group slicers to focus your reporting
-
KPI Cards show:
🔹 Total KPIs
🔹 MTD Targets Met
🔹 MTD Targets Missed -
Table View with all essential metrics:
🔹 KPI Number, Name, Group
🔹 Unit, Type (LTB/UTB)
🔹 Actual vs Target (MTD & YTD)
🔹 Previous Year comparisons
🔹 Green/Red arrows for visual status
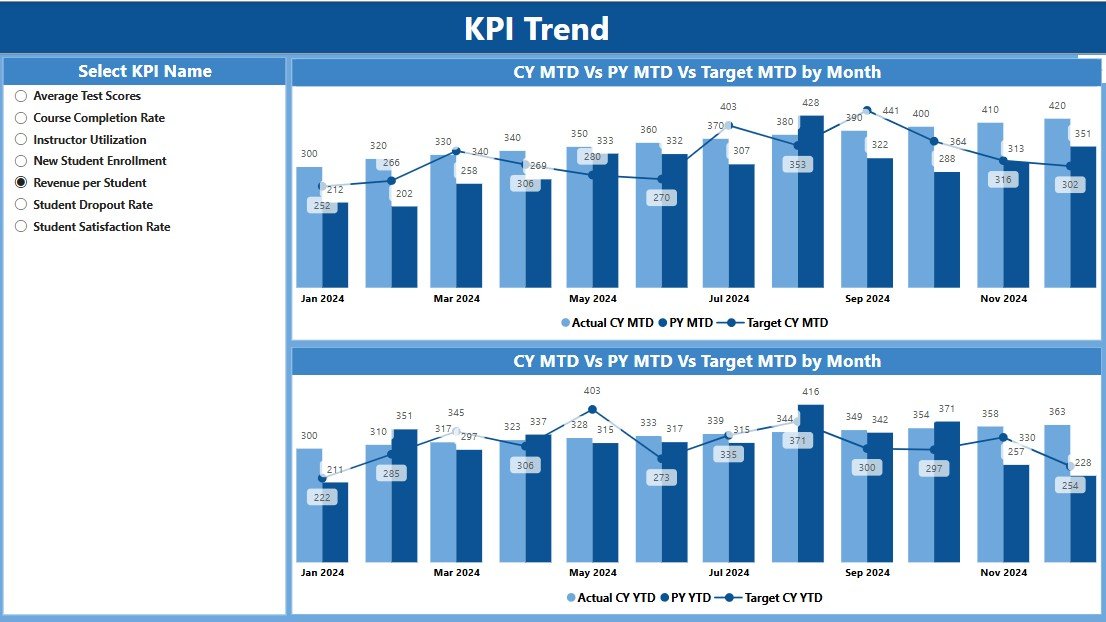
📈 KPI Trend Page – Visualize Your Progress
-
Select a KPI and view its trend line over time
-
Combo charts for:
🔹 MTD (Actual vs Target vs Previous Year)
🔹 YTD (Same structure) -
Clear insight into whether metrics are improving or need attention
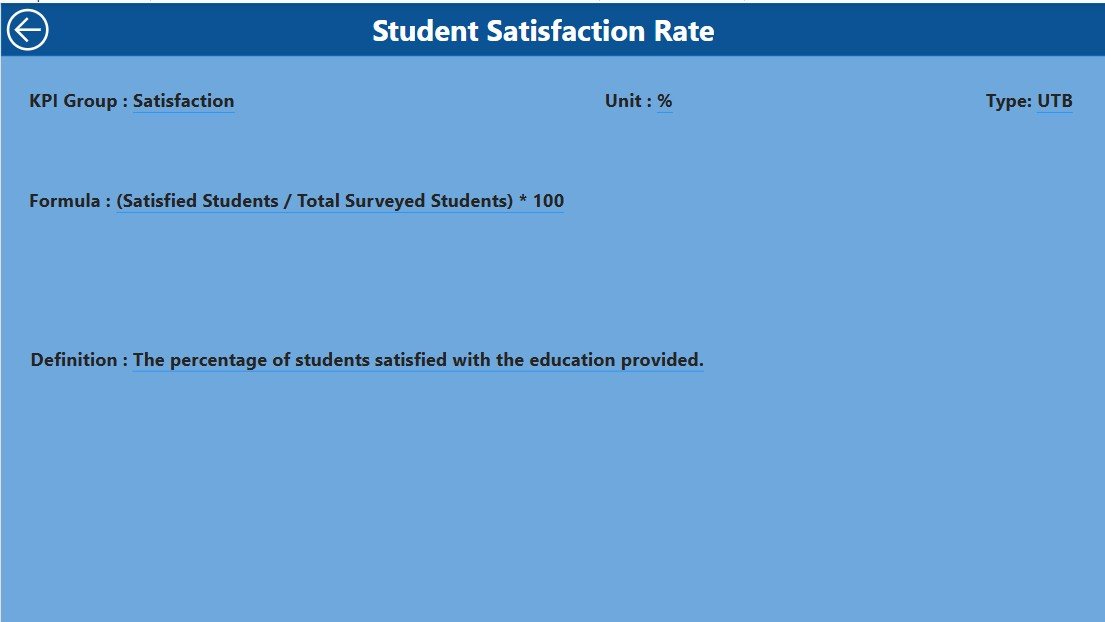
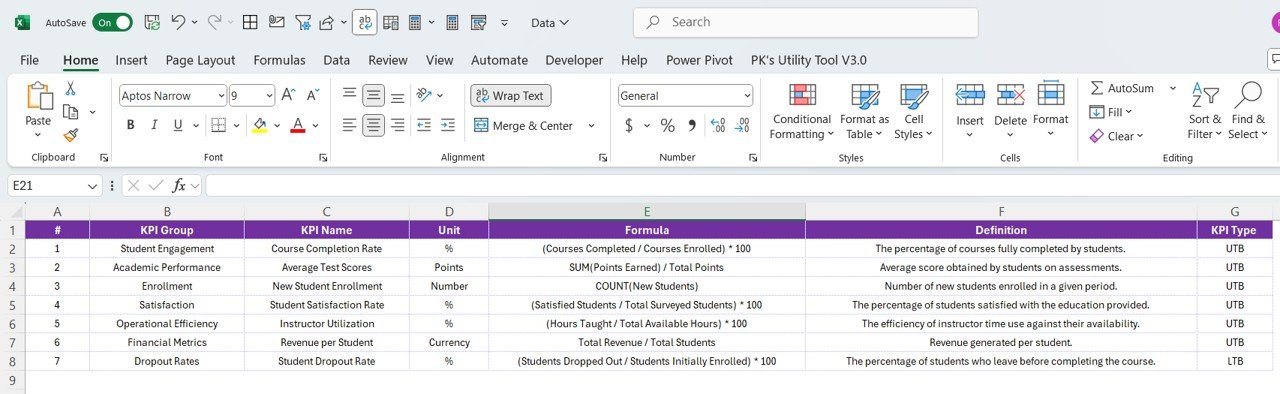
📘 KPI Definition Page – Drill-Through Clarity
-
Right-click a KPI in the summary table to see:
🔹 Formula
🔹 Definition
🔹 Unit & KPI Type -
Includes a Back button for easy navigation
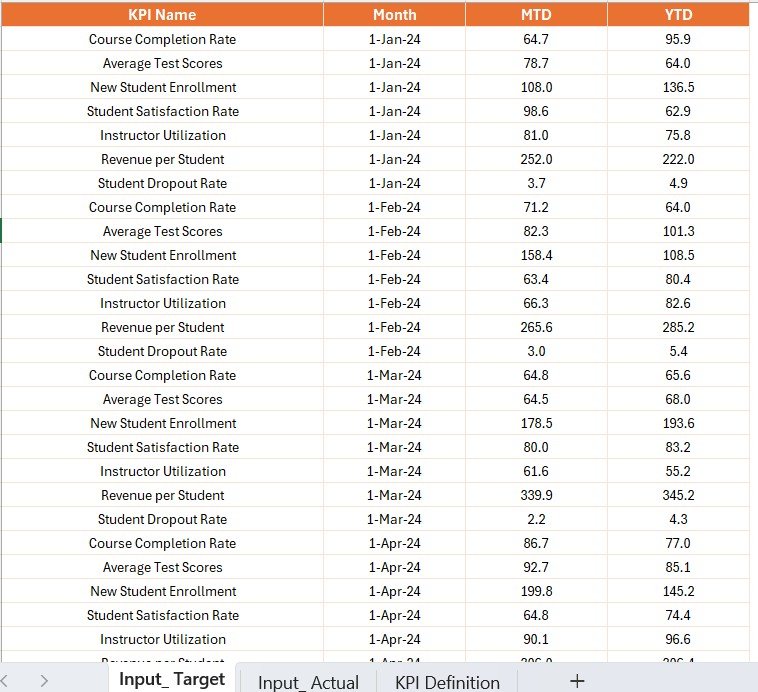
📊 Excel-Powered Data Engine
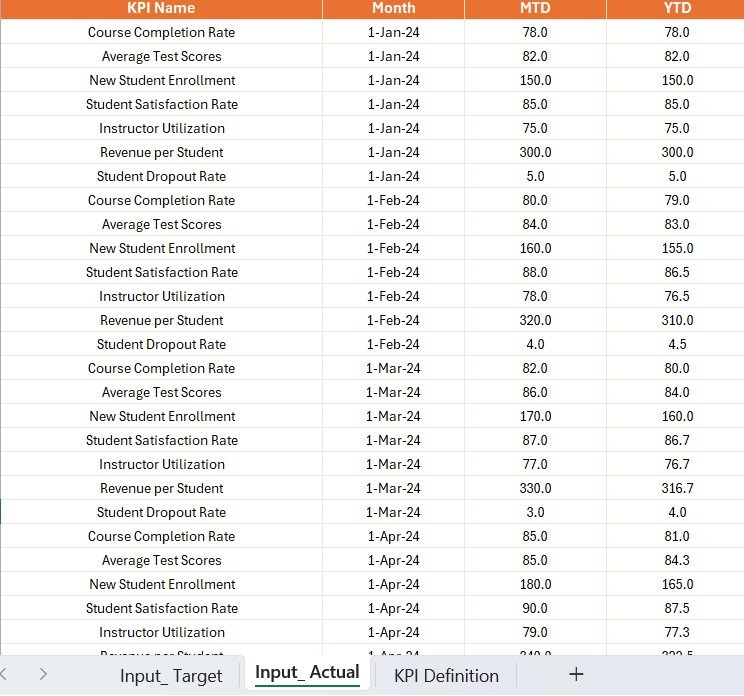
All data is managed in a connected Excel file with 3 sheets:
1️⃣ Input_Actual – Enter monthly Actuals (MTD/YTD)
2️⃣ Input_Target – Input monthly Target values
3️⃣ KPI_Definition – Set KPI Name, Formula, Group, Unit, and Type
No database or advanced setup needed—just Excel + Power BI.
📂 What’s Inside the Power BI Dashboard?
This dashboard includes:
1️⃣ Summary View – For high-level performance tracking
2️⃣ KPI Trends – For deep-dive analysis of individual metrics
3️⃣ KPI Definitions – For documentation and team alignment
4️⃣ Excel Integration – Input sheets for Actuals, Targets, and Definitions
It’s clean, structured, and powerful designed for both simplicity and insight.
👨🏫 Who Can Benefit from This Product?
Perfect for:
✅ Course Managers & Admins – Track completion, drop-off rates, satisfaction
✅ Education Analysts – Monitor month-over-month performance
✅ Instructional Designers – Assess engagement and platform efficiency
✅ Online Learning Platforms – Align content and strategy with results
✅ Small Institutes & EdTech Startups – Affordable and scalable performance tracking
If you’re in education and want to turn raw data into real impact—this dashboard is made for you.
🔗 Click here to read the Detailed blog post
🎥 Visit our YouTube channel to learn step-by-step video tutorials


Reviews
There are no reviews yet.