
Oncology Services KPI Dashboard in Excel Managing oncology services requires accuracy, coordination, and fast decision-making. Every day, oncology teams handle diagnostics, chemotherapy cycles, radiation therapy sessions, patient flow, and clinical reporting. Because cancer care demands precision, hospitals need a simple and powerful tool to track all key performance indicators in one place. The Oncology Services KPI Dashboard in Excel is designed exactly for this purpose—bringing clarity, speed, and efficiency to oncology reporting. 🎗️📊
Oncology Services KPI Dashboard in Excel This ready-to-use Excel dashboard helps hospitals monitor their Monthly (MTD), Year-to-Date (YTD), Target, and Previous Year performance across every essential oncology function. Oncology Services KPI Dashboard in Excel Whether you manage chemotherapy units, radiation therapy centers, cancer wards, or diagnostic labs, Oncology Services KPI Dashboard in Excel this dashboard gives you a complete and real-time view of how your oncology services are performing.
Oncology Services KPI Dashboard in Excel the best part? You don’t need complicated software. Just enter your data in the Excel sheets, and the dashboard updates automatically.
🎯 Key Features of Oncology Services KPI Dashboard in Excel
This dashboard is designed to make oncology reporting simple, fast, and reliable. It includes 7 powerful worksheets that help teams understand trends, track targets, and evaluate performance.
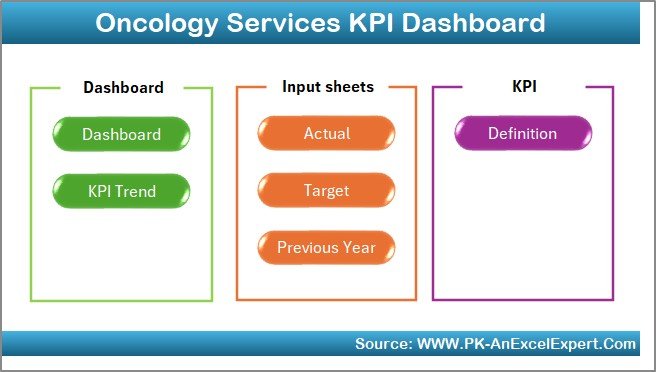
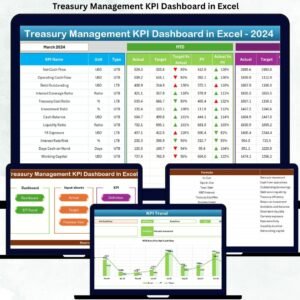
1️⃣ Home Sheet – Smart Navigation for Busy Teams
The Home page acts as the main index. Doctors, admins, and nurses can instantly jump to the Dashboard, Trends, Input Sheets, or KPI Definition pages through one-click navigation buttons.
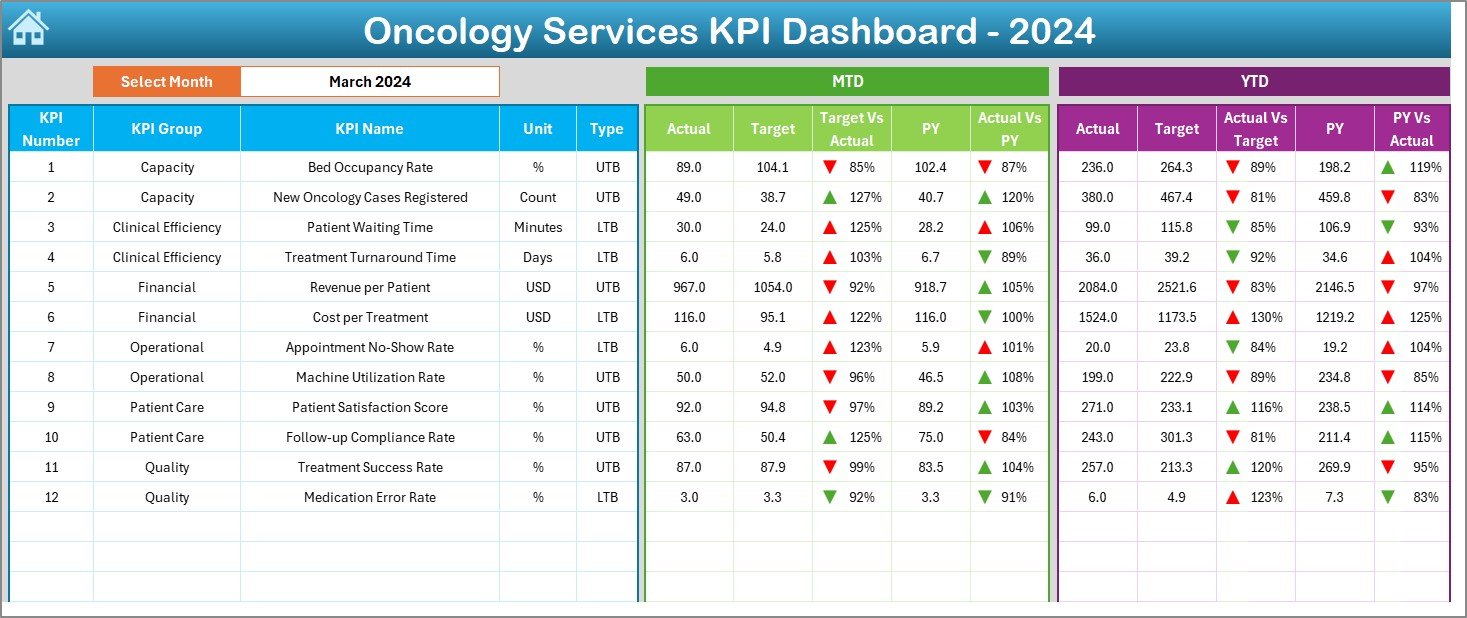
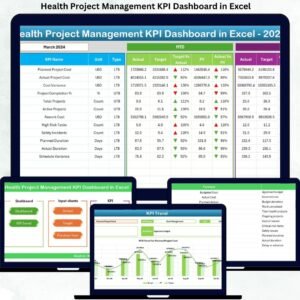
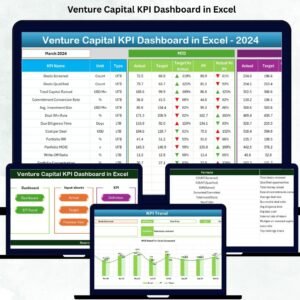
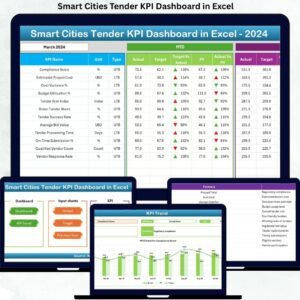
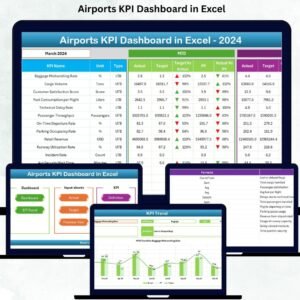
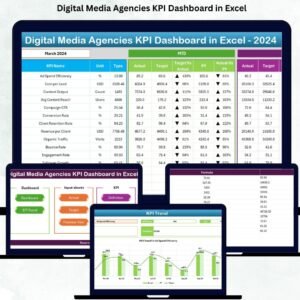
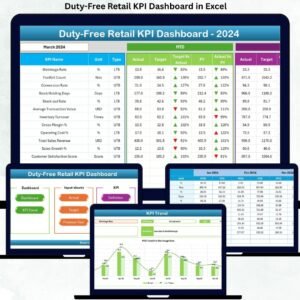
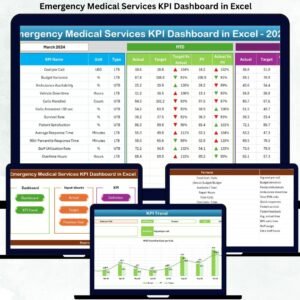
2️⃣ Dashboard Sheet – Your Main Oncology Snapshot
This is the heart of the system.
You get:
-
🗓️ Month selector to refresh all metrics instantly
-
📌 MTD & YTD actuals
-
🎯 Targets vs Actual comparison
-
📉 Previous Year vs Current Year comparison
-
🔼🔽 Conditional arrows to highlight performance gaps
It gives a complete picture of chemotherapy cycles, radiation sessions, diagnostics, bed occupancy, patient care efficiency, and operational performance.
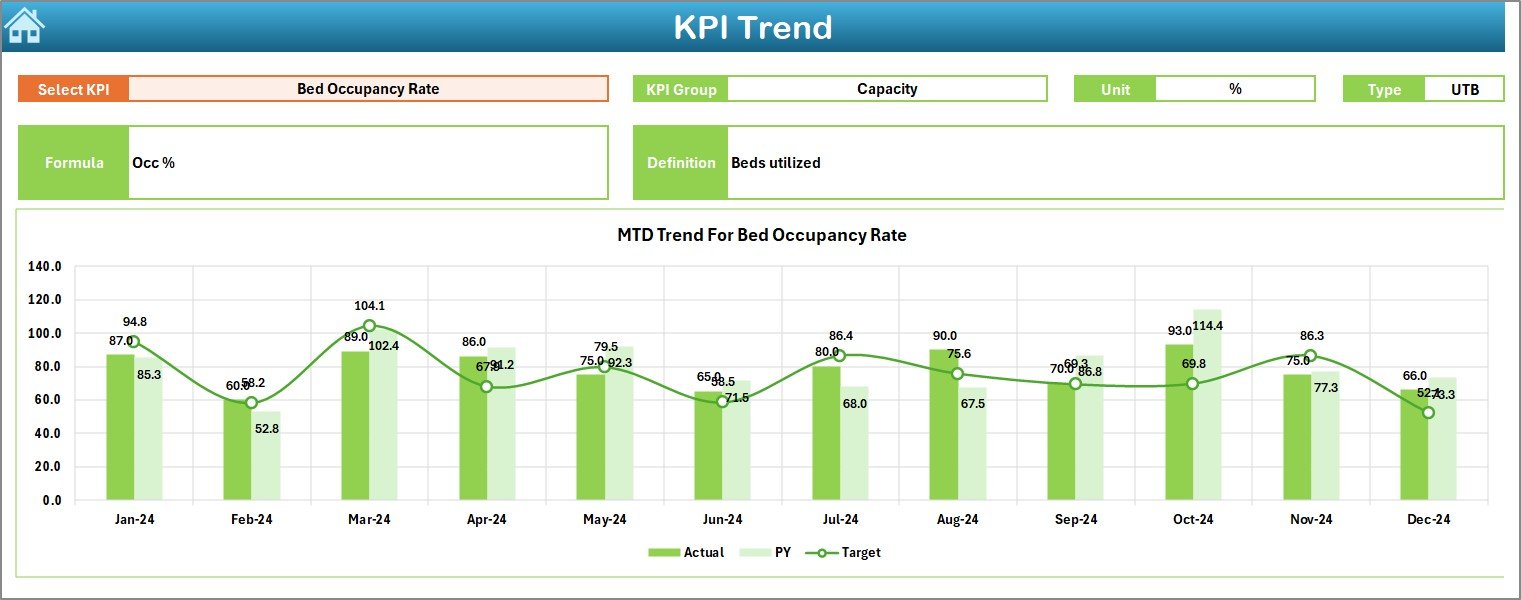
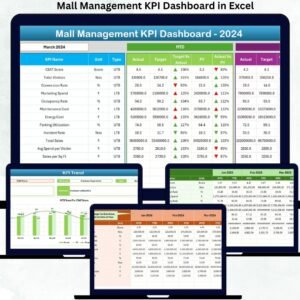
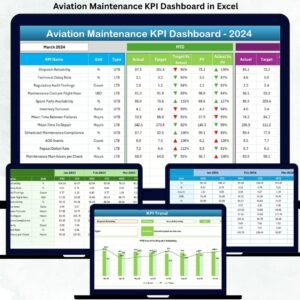
3️⃣ KPI Trend Sheet – Track Long-Term Oncology Trends
This page helps you understand patterns over time.
You can view:
-
KPI formulas
-
KPI definitions
-
MTD & YTD trend charts
-
Previous Year vs Current Year insights
Perfect for studying diagnostic delays, treatment volumes, or therapy cycles.
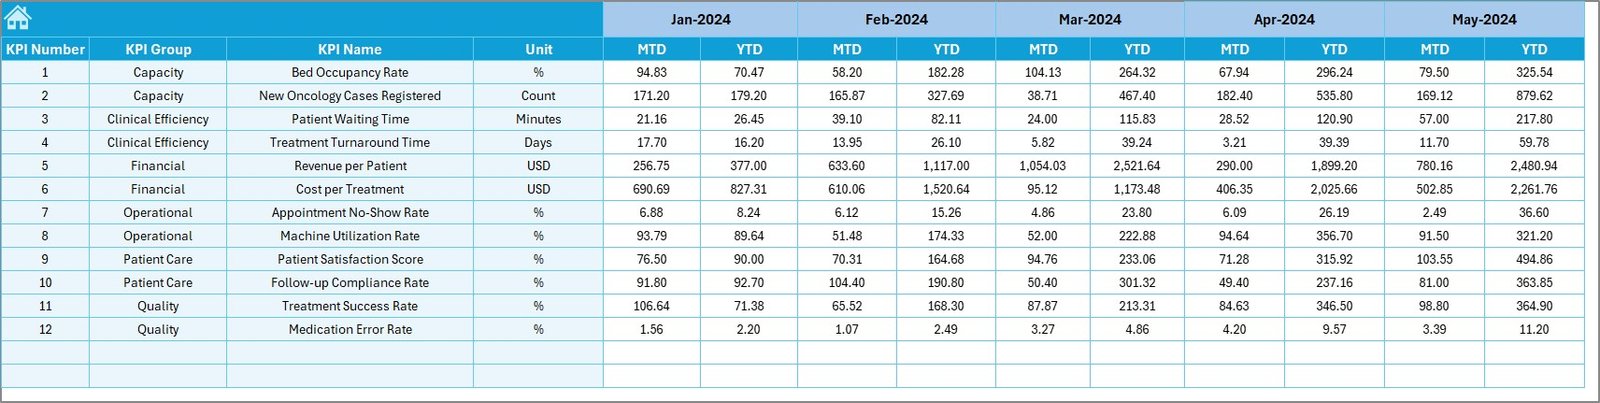
4️⃣ Actual Input Sheet – Fast Data Entry
Just enter:
-
Actual MTD
-
Actual YTD
Excel automatically updates all visuals. No complex formulas required.
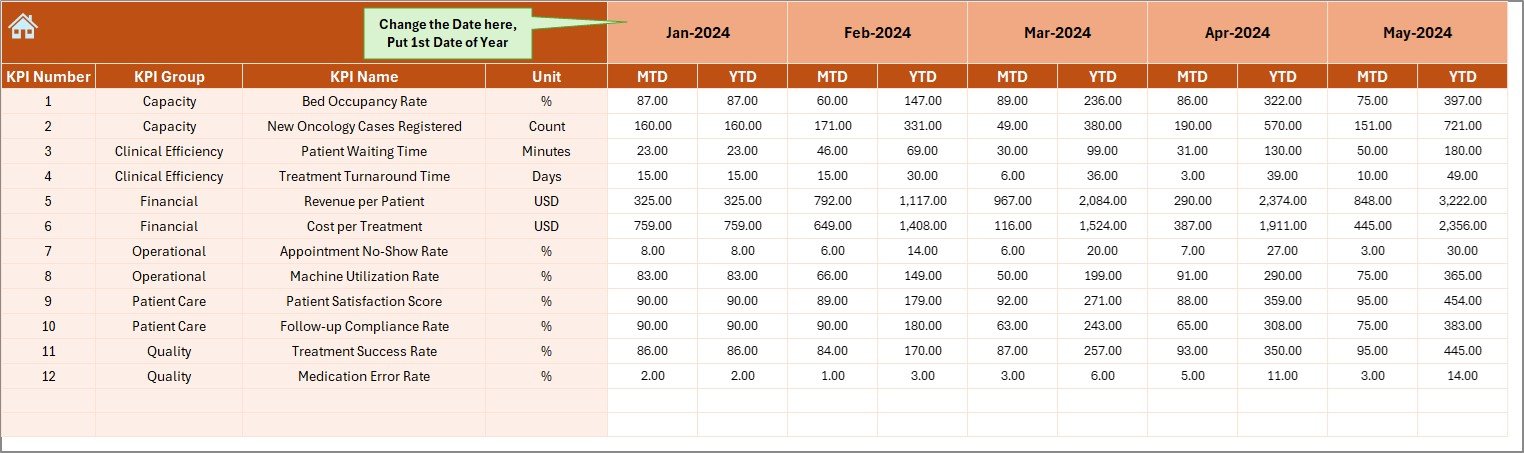
5️⃣ Target Sheet – Set Oncology Benchmarks
This sheet helps you define:
-
Monthly treatment goals
-
Yearly targets
-
Performance standards
Ideal for planning staffing needs, patient load, and resource allocation.
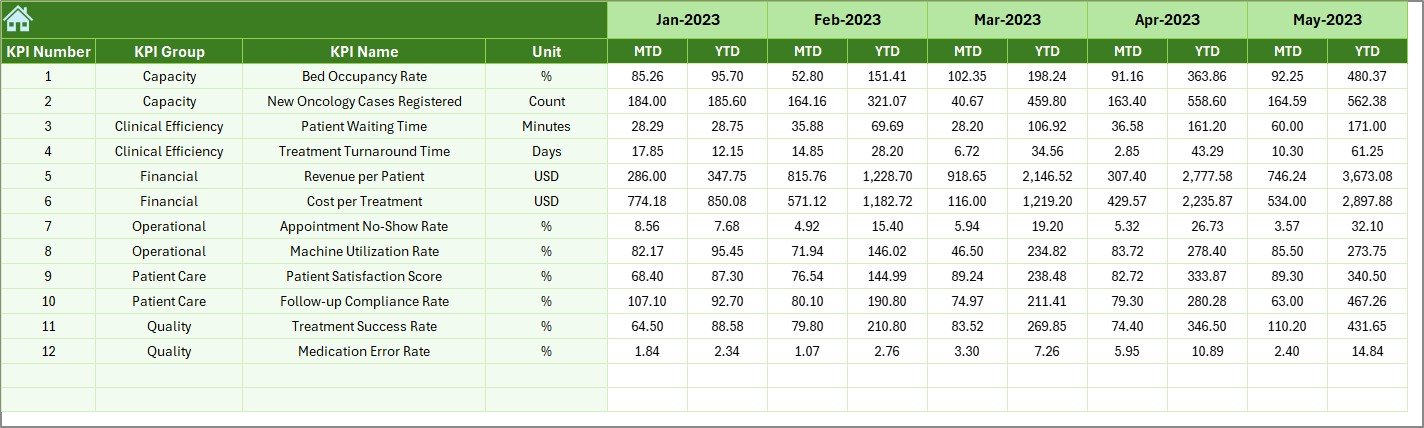
6️⃣ Previous Year Sheet – Year-over-Year Comparison
This sheet makes performance tracking easy.
Compare:
-
Diagnostics turnaround
-
Therapy wait times
-
Treatment efficiency
-
Patient care indicators
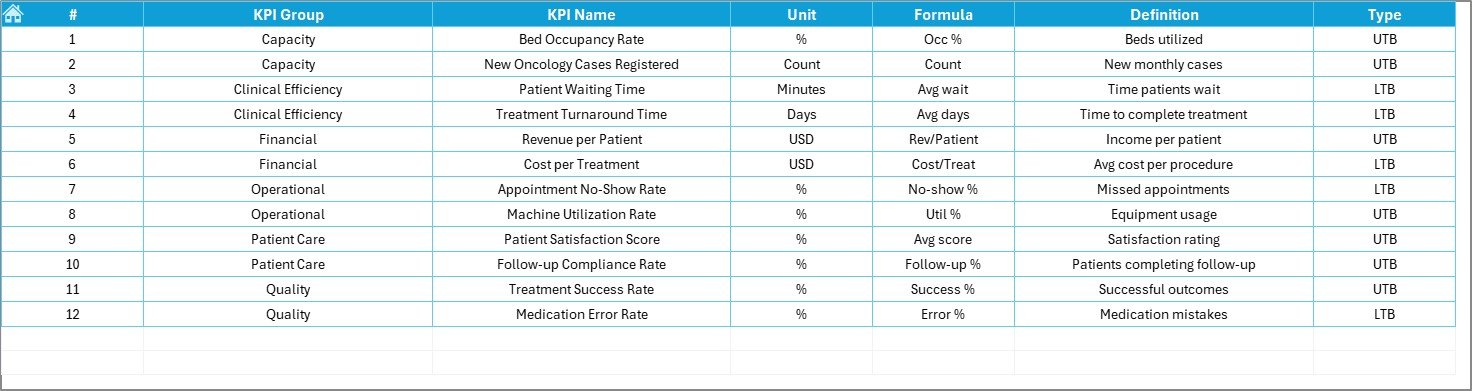
7️⃣ KPI Definition Sheet – Standardized Oncology Metrics
Includes:
-
KPI Name
-
Group
-
Unit
-
Formula
-
Definition
-
Type (LTB or UTB)
This ensures clarity, transparency, and audit readiness.
📦 What’s Inside the Oncology Services KPI Dashboard
When you download this product, you receive:
-
📊 Excel Dashboard File
-
🧾 Input Sheets for Actuals, Targets & Previous Year
-
🧮 KPI Definition Sheet
-
⏱️ Automated MTD/YTD calculations
-
📈 Dynamic charts, conditional icons & interactive views
Everything is clean, structured, and ready for immediate use.
🧭 How to Use the Oncology Services KPI Dashboard
Using this dashboard takes only a few steps:
-
Enter monthly actuals in the Actual Input Sheet
-
Update targets in the Target Sheet
-
Add previous-year numbers in the Previous Year Sheet
-
Select a month on the Dashboard
-
Review KPIs, trends & performance gaps
-
Share insights with your oncology team for action
No advanced Excel knowledge needed — everything is automated.
👥 Who Can Benefit from This Oncology Dashboard
This dashboard is ideal for:
-
🎗️ Cancer hospitals
-
🏥 Oncology departments
-
💉 Chemotherapy units
-
🔬 Diagnostic labs
-
☢️ Radiation therapy centers
-
📋 Hospital administrators
-
📊 Quality & audit teams
If you want to improve patient outcomes, reduce treatment delays, and enhance reporting quality, this tool is perfect for you.
With real-time indicators, monthly vs yearly comparisons, trend charts, and fully automated insights, this dashboard becomes the central performance system for your oncology services. It helps improve patient care, streamline workflows, support compliance, and strengthen hospital efficiency.


Reviews
There are no reviews yet.