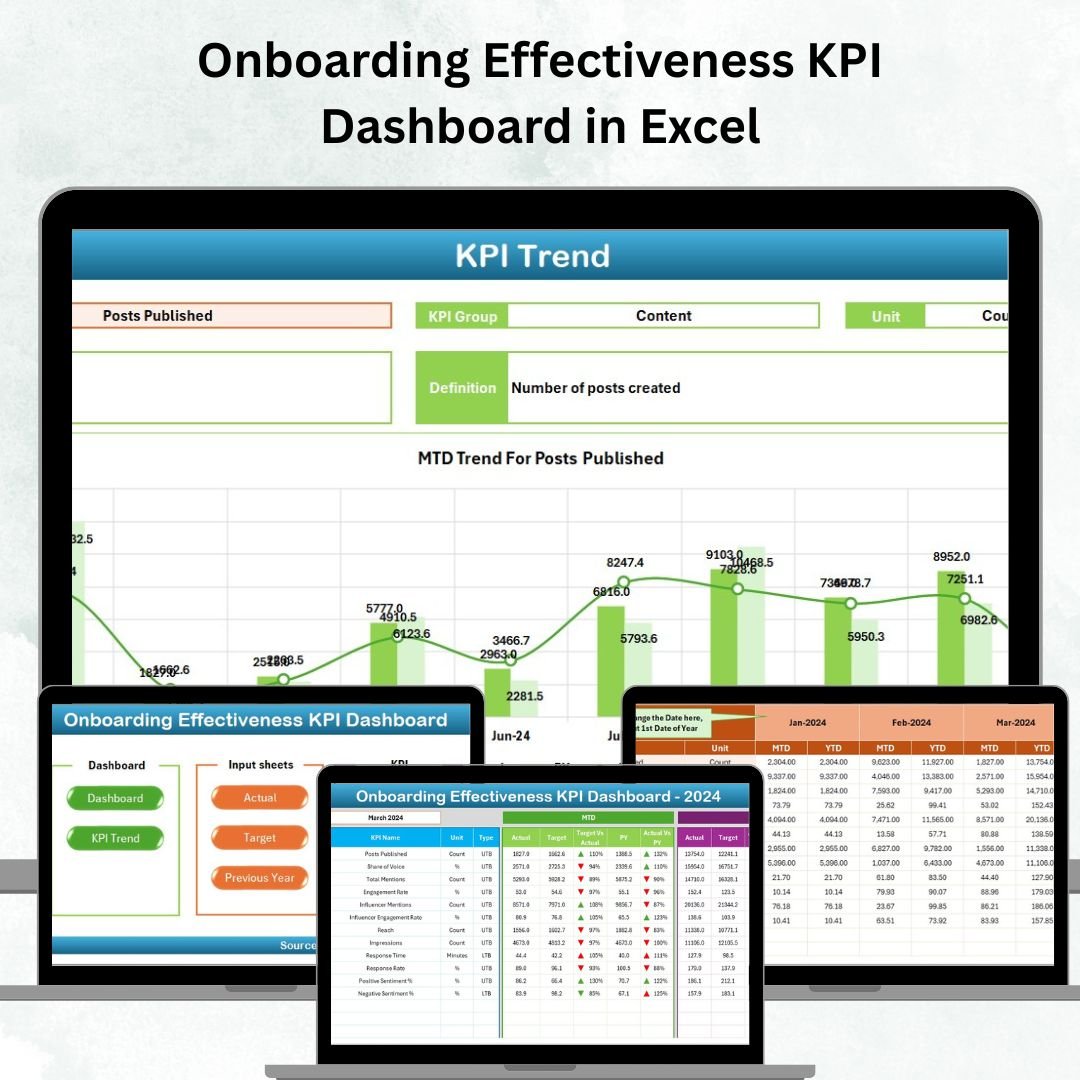
Employee onboarding success isn’t just about orientation — it’s about integration, engagement, and measurable results. 💼✨
That’s exactly what the Onboarding Effectiveness KPI Dashboard in Excel delivers — a powerful, data-driven solution that helps HR professionals and business leaders track, analyze, and improve the onboarding experience for every new hire.
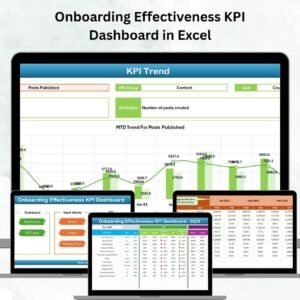
This ready-to-use Excel dashboard turns complex onboarding metrics into clear, actionable insights — enabling you to evaluate retention, satisfaction, training progress, and overall onboarding efficiency at a glance. 🚀Onboarding Effectiveness KPI Dashboard in Excel
🌟 Key Features of the Onboarding Effectiveness KPI Dashboard in Excel
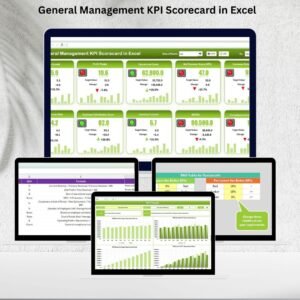
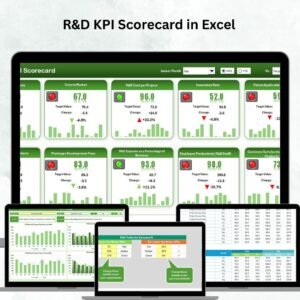
✅ Real-Time KPI Visualization: Instantly view how your onboarding program is performing through interactive charts and summary cards.Onboarding Effectiveness KPI Dashboard in Excel
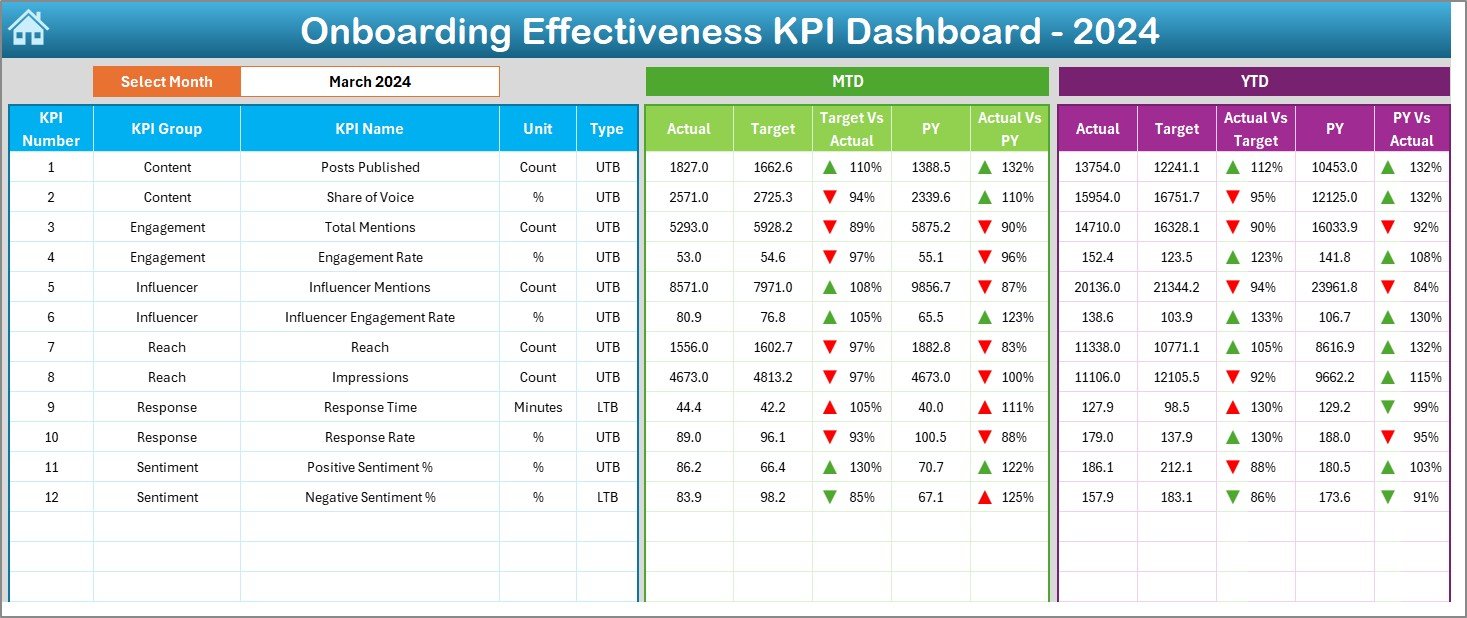
📅 Month Selector Control: Simply choose a month from the dropdown (cell D3) and watch all metrics update automatically.
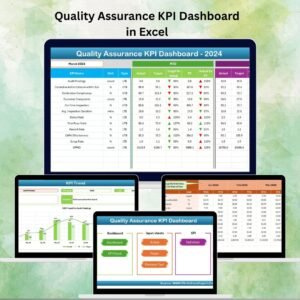
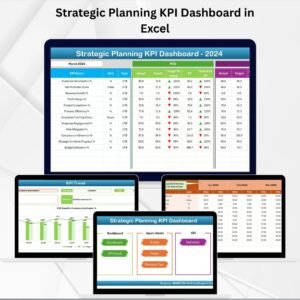
📊 MTD and YTD Tracking: Compare Month-to-Date and Year-to-Date Actuals vs Targets with ease.
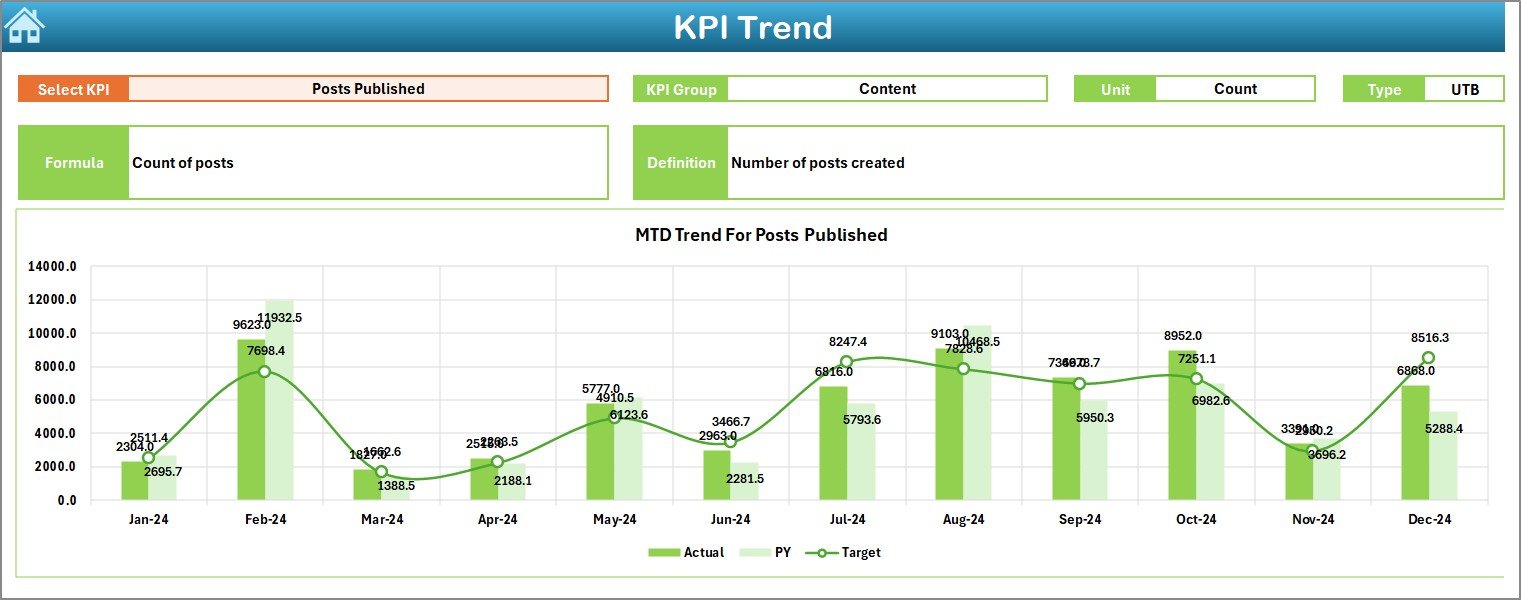
📈 Trend Analysis: Identify performance patterns and improvement areas using dynamic trend charts.
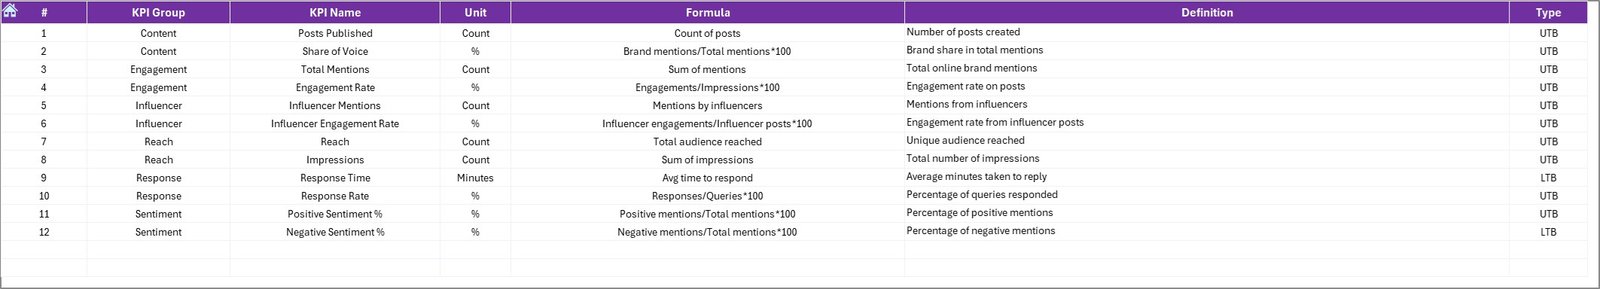
📚 Complete KPI Documentation: Every KPI includes its definition, formula, and type (UTB/LTB) for total clarity.
📂 Historical Benchmarking: Evaluate current performance against the previous year to measure progress.
⚙️ No Coding Needed: 100% Excel-based and fully editable — no macros or complex formulas required.
📥 Ready-to-Use Template: Just plug in your onboarding data and get professional reports instantly.
📦 What’s Inside the Onboarding Effectiveness KPI Dashboard in Excel
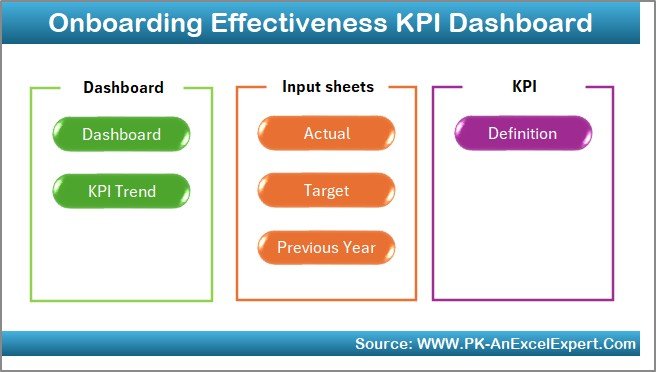
This Excel tool is designed with seven smartly structured worksheets, each serving a specific function to streamline HR analytics:
1️⃣ Home Sheet – Acts as a command center with navigation buttons linking all sections.
2️⃣ Dashboard Sheet – The visual heart of the tool, featuring KPI cards, charts, and conditional formatting arrows.
3️⃣ KPI Trend Sheet – Deep-dive into individual KPI performance, definitions, and monthly trends.
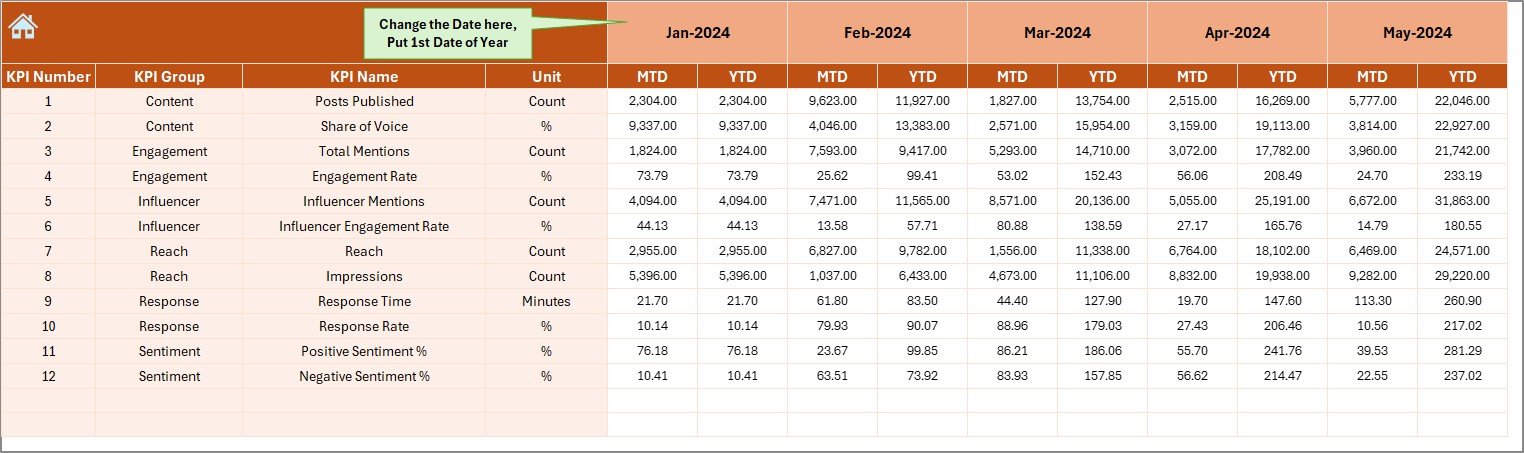
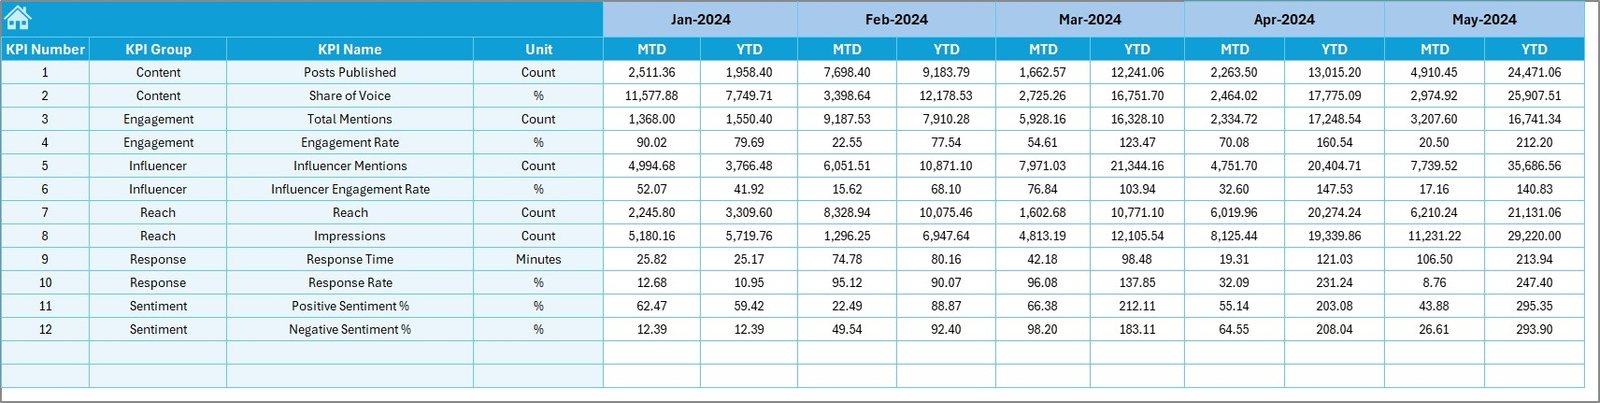
4️⃣ Actual Numbers Input Sheet – Record real onboarding data (MTD/YTD) easily with flexible starting month (cell E1).
5️⃣ Target Sheet – Set monthly goals to evaluate onboarding efficiency.
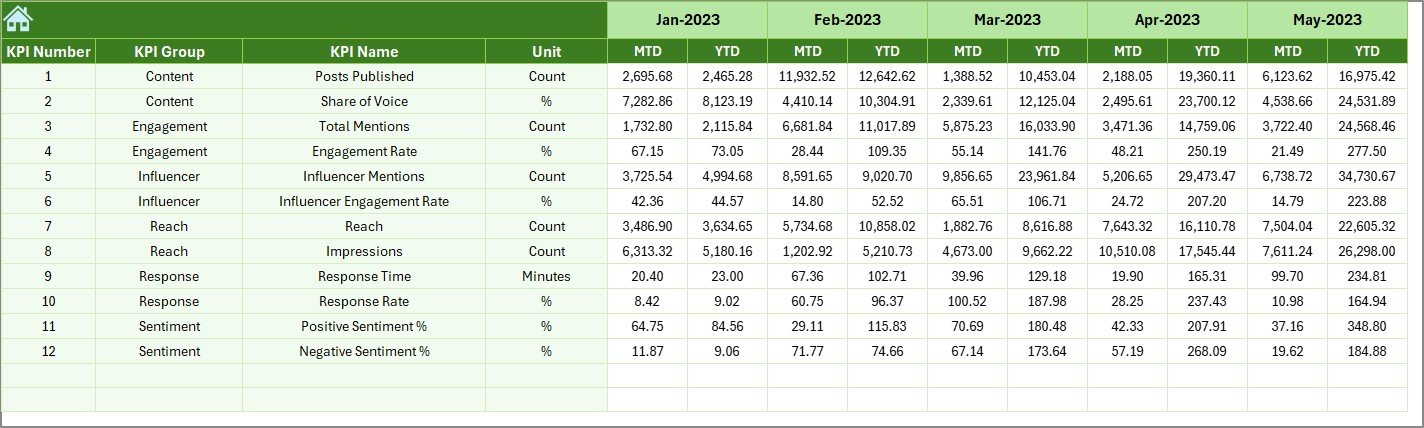
6️⃣ Previous Year Sheet – Store last year’s results for side-by-side comparisons.KPI Dashboard in Excel
7️⃣ KPI Definition Sheet – Maintain all KPI names, formulas, and units for documentation and transparency.
Everything is interconnected, so your dashboard updates automatically when new data is entered. 🎯
🧭 How to Use the Onboarding Effectiveness KPI Dashboard in Excel
🧩 Step 1: Define your reporting start month in the Actual Numbers Input Sheet.
📊 Step 2: Enter MTD and YTD data for each KPI based on current onboarding results.
🎯 Step 3: Input monthly targets in the Target Sheet for goal tracking.
📆 Step 4: Copy last year’s data to the Previous Year Sheet for benchmarking.
🔍 Step 5: Review all KPI definitions for accuracy.
💡 Step 6: Analyze results using Dashboard and KPI Trend tabs to identify success areas and bottlenecks.
With this dashboard, HR leaders can make data-driven decisions, speed up reporting, and showcase onboarding success during reviews.Onboarding Effectiveness KPI Dashboard in Excel
👥 Who Can Benefit from This Dashboard
🎯 HR Managers & Recruiters: Get a full view of onboarding performance and employee engagement.
📈 Business Executives: Monitor onboarding ROI and workforce readiness with real-time insights.
🧑🏫 Training Coordinators: Track training completion, satisfaction scores, and productivity timelines.
🏢 Small Businesses & Enterprises: Scale your onboarding analytics effortlessly — no matter your team size.
🧩 Consultants & Analysts: Use it to present professional onboarding analytics reports to clients.
Whether you’re onboarding 10 or 1,000 employees, this Excel tool helps you convert HR data into strategic action.Onboarding Effectiveness KPI Dashboard in Excel


Reviews
There are no reviews yet.