Managing office furniture is often underestimated, but it has a huge impact on cost control, resource allocation, and operational efficiency. Desks, chairs, storage units, and cabinets represent significant investment, and without proper tracking, businesses often end up with duplicate purchases, underutilized assets, or delayed repairs.
The Office Furniture Inventory Dashboard in Excel solves this problem by giving companies a centralized and visual reporting system. Built entirely in Excel, it provides insights into furniture usage, conditions, budgets, vendors, and departmental allocations.
Whether you are a small office or a large organization, this tool helps you save costs, extend asset life, and optimize space management.
✨ Key Features of the Office Furniture Inventory Dashboard
🔹 Page Navigator
-
A left-hand navigation panel makes it easy to move across sections.
-
No endless scrolling — simply click to switch between Overview, Department, Category, Vendor, or Monthly Trends.
🔹 Multi-Page Analysis
The dashboard is structured into five analytical pages plus data and support sheets:
-
Overview Page – A quick snapshot of the organization’s furniture health and cost.
-
Department Analysis – Tracks allocation and repair needs across departments.
-
Category Analysis – Focuses on conditions and replacement needs by furniture type.
-
Vendor Analysis – Monitors vendor quality and durability.
-
Monthly Trends – Identifies time-based spending and repair cycles.
📑 Page-by-Page Breakdown
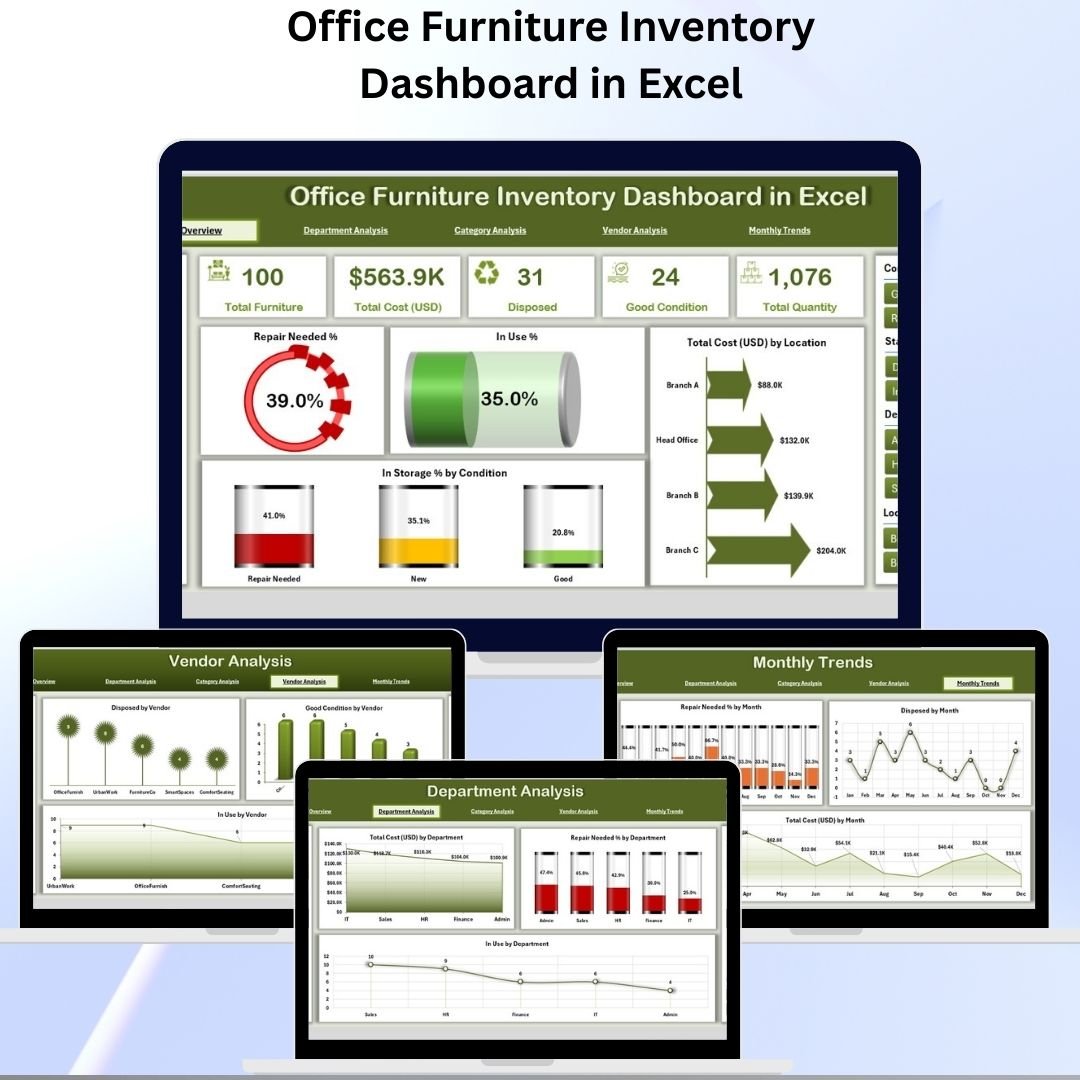
🏠 Overview Page
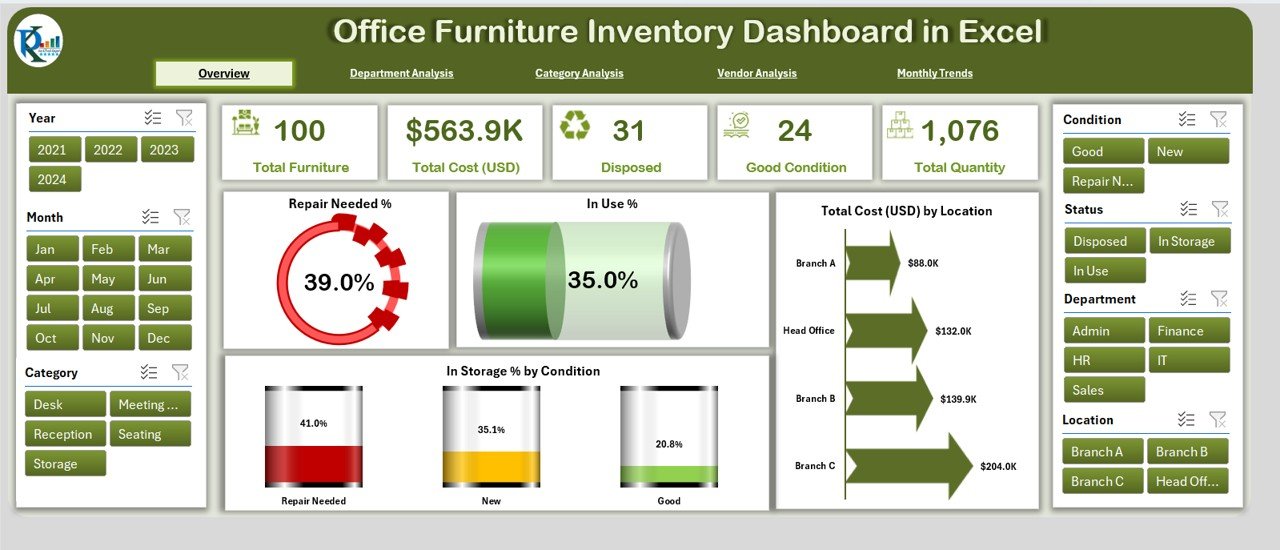
-
KPI Cards for: Completed %, Delayed %, Repair Needed %, In Use %, In Storage %, Total Cost.
-
Charts for Budget Allocation vs Budget Used and Cost by Location.
-
Perfect for management-level quick reviews.
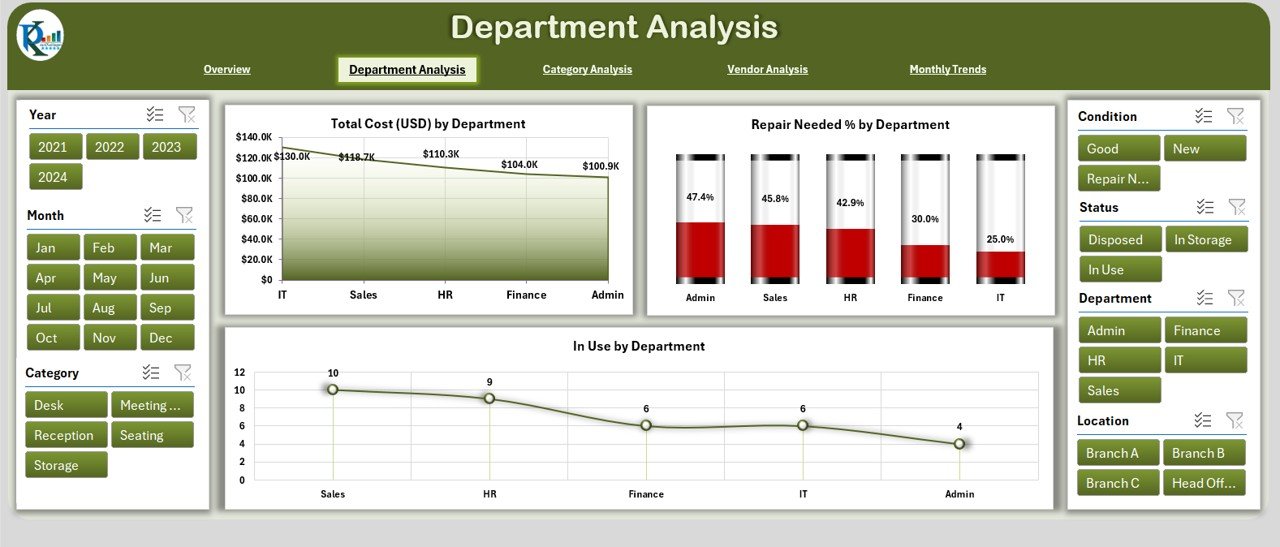
🏢 Department Analysis
-
Charts: Total Cost by Department, Repair Needed % by Department, In Use % by Department.
-
Ensures fair allocation of resources and quick detection of high-maintenance departments.
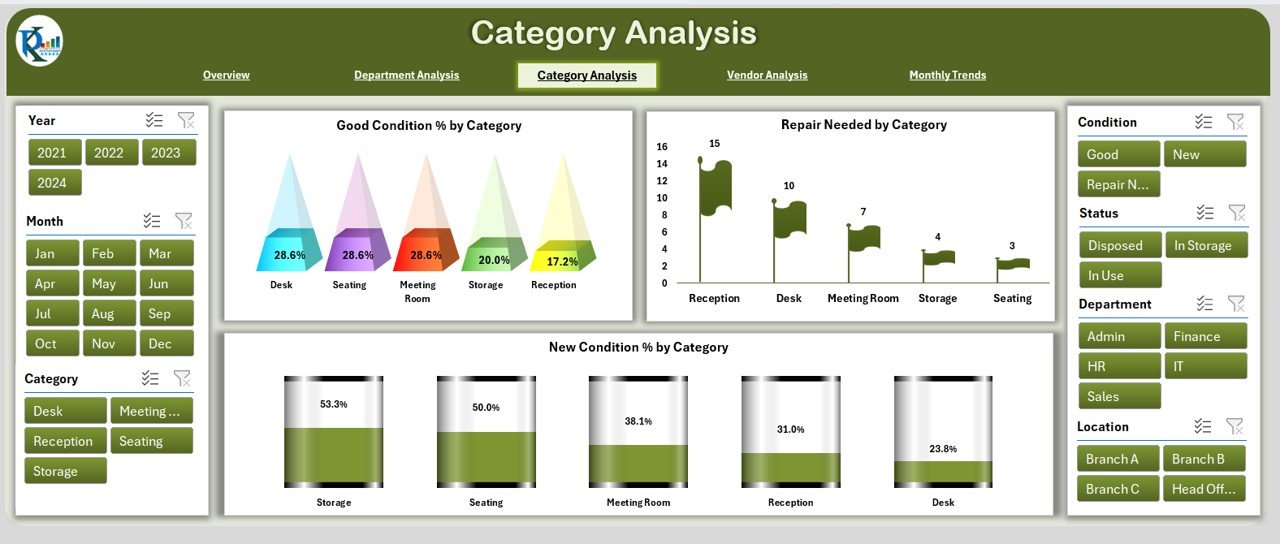
📂 Category Analysis
-
Charts: Good Condition % by Category, Repair Needed % by Category, New Condition % by Category.
-
Helps plan replacements and maintenance by type (desks, chairs, cabinets, etc.).
🏭 Vendor Analysis
-
Charts: Disposed % by Vendor, Good Condition % by Vendor, In Use % by Vendor.
-
Identifies which suppliers provide durable products and which require vendor negotiations.
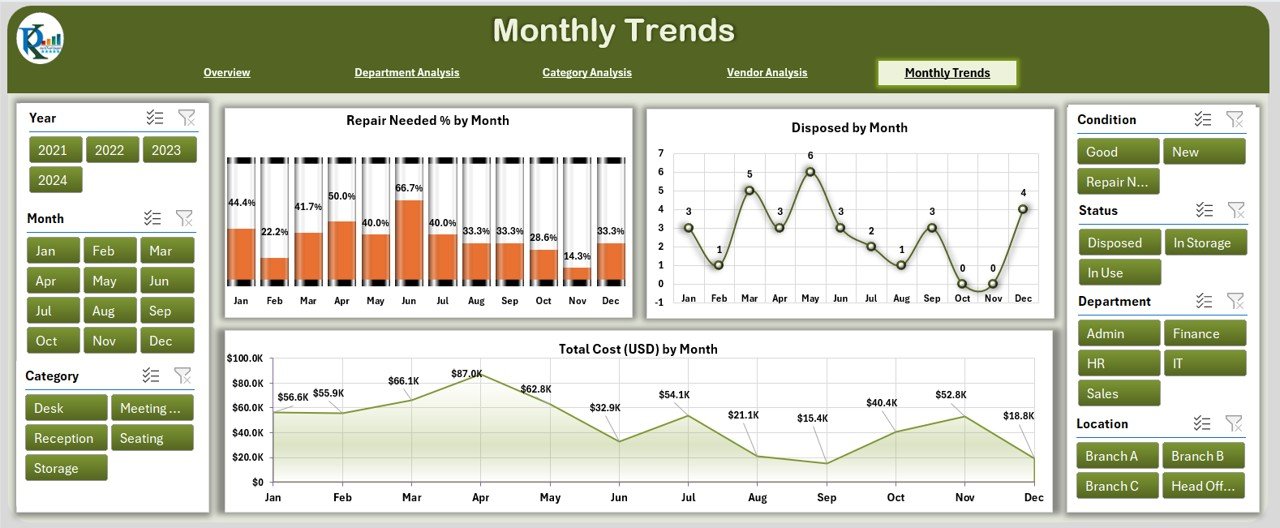
📅 Monthly Trends
-
Charts: Completed % by Month, Budget Allocation vs Used, Delayed %, Repair Needed %, Disposed %, Total Cost by Month.
-
Supports budget forecasting and preventive maintenance schedules.
📊 Data Sheet & Support Sheet
-
Data Sheet: Stores raw data (Item ID, Category, Vendor, Cost, Department, Condition).
-
Support Sheet: Holds reference lists (departments, vendors, categories) to keep data consistent.
🏆 Advantages of Using the Dashboard
-
💰 Cost Savings – Prevents duplicate purchases and controls budgets.
-
⏱ Time Efficiency – Replaces multiple spreadsheets with one dashboard.
-
🔧 Better Maintenance – Tracks repair needs and prevents costly failures.
-
📊 Transparency – Visualizes allocation by department, vendor, and category.
-
🏢 Vendor Management – Helps select the most reliable suppliers.
-
📈 Scalability – Works for small businesses and large corporations alike.
💡 Opportunities for Improvement
-
⚙️ Automation with VBA – Auto-generate monthly reports.
-
📱 Mobile Access – View dashboard on tablets or mobile devices.
-
🔗 Integration with Barcode/QR – Scan furniture for instant updates.
-
☁️ Cloud Integration – Collaborate via OneDrive or Google Drive.
-
🤖 Forecasting Models – Predict future replacement or repair needs.
📌 Best Practices for Implementation
-
📥 Update Data Regularly – Enter purchases, repairs, and disposals promptly.
-
🗂 Use Standard Categories – Maintain consistent names for vendors & departments.
-
🔧 Track Repair History – Record repair costs and dates for lifecycle tracking.
-
💵 Set Budget Limits – Use dashboard variance analysis to prevent overspending.
-
👤 Assign Responsibility – Nominate a furniture manager or admin.
-
📅 Review Trends Monthly – Use Monthly Trends for strategic planning.
🎯 Conclusion
The Office Furniture Inventory Dashboard in Excel is more than just a spreadsheet — it’s a complete furniture management system. By combining data centralization with interactive visuals, businesses can cut costs, extend furniture life, and hold vendors accountable.
As companies grow, furniture management complexity increases. This dashboard ensures you stay organized, cost-efficient, and future-ready.
❓ FAQs
Q1. What is an Office Furniture Inventory Dashboard?
A pre-built Excel template for tracking furniture costs, conditions, departments, and vendors.
Q2. Who should use it?
HR, facilities, procurement, and finance teams.
Q3. Can it be customized?
Yes, add KPIs, charts, or automation easily.
Q4. How often should I update it?
After every purchase, disposal, or repair — plus monthly reviews.
Q5. Does it require advanced Excel skills?
No, it uses built-in formulas, slicers, and charts.
👉 Visit our YouTube Channel for step-by-step tutorials.


Reviews
There are no reviews yet.