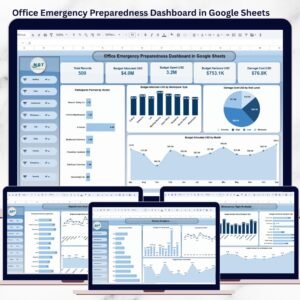
Emergency preparedness is no longer optional for modern organizations. Offices today face a wide range of risks—from fire hazards, medical emergencies, and power outages to cyber incidents, floods, and severe weather events. Yet many organizations still manage preparedness data using scattered spreadsheets, static documents, or manual tracking methods. As a result, leadership often lacks real-time visibility into preparedness levels, budget utilization, and risk exposure.Office Emergency Preparedness Dashboard in Google Sheets
That is exactly why the Office Emergency Preparedness Dashboard in Google Sheets becomes a powerful and practical solution.
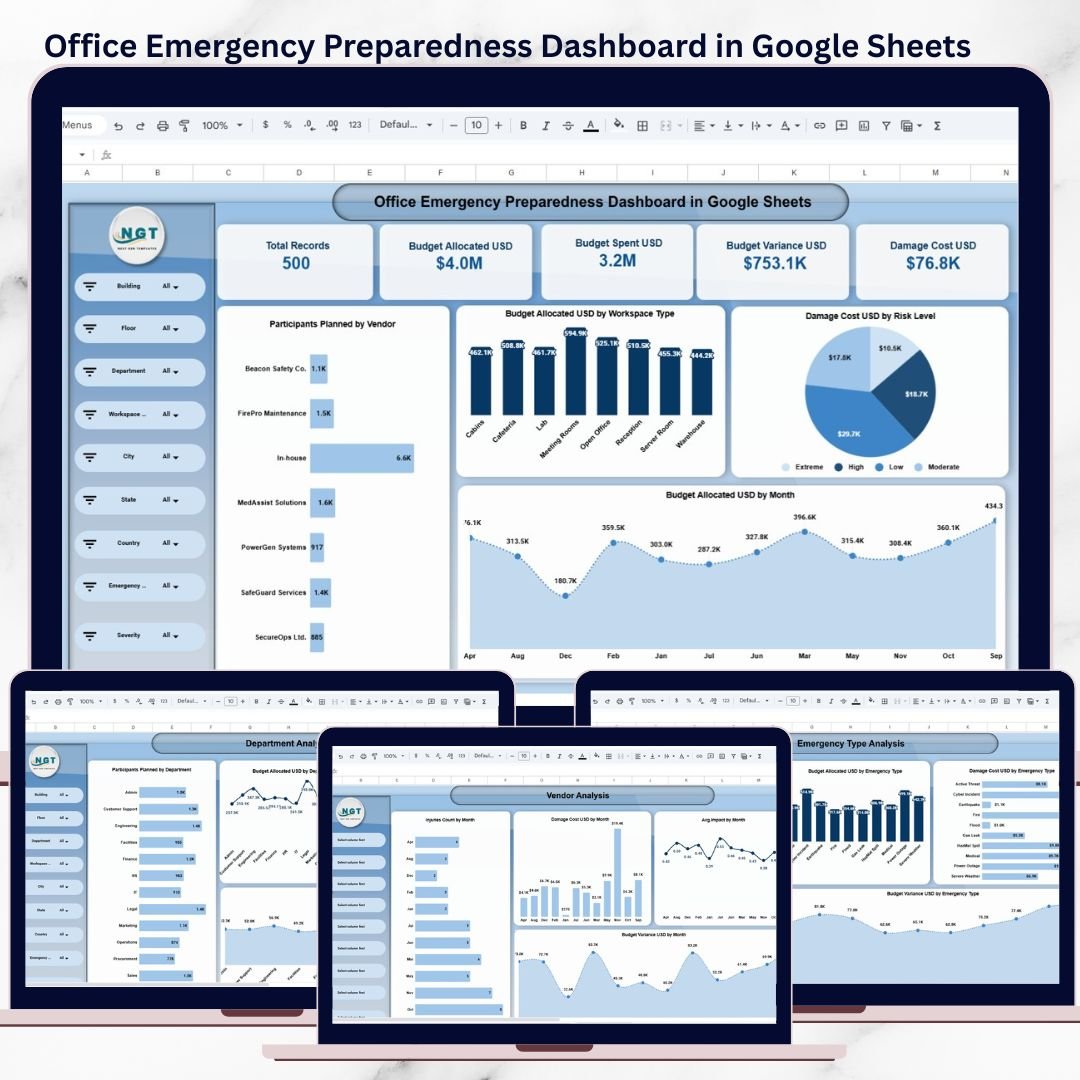
This ready-to-use dashboard provides a centralized, interactive, and data-driven way to monitor emergency preparedness across offices, departments, locations, and vendors. Instead of searching through multiple files, teams can instantly evaluate readiness status, training participation, risk levels, budget allocation, and damage costs—all from a single Google Sheets dashboard.
Because the dashboard is built entirely in Google Sheets, it is cloud-based, easy to share, and simple to customize without complex software or coding. This makes it ideal for organizations that want strong preparedness oversight with minimal implementation effort.
🚀 Key Features of the Office Emergency Preparedness Dashboard
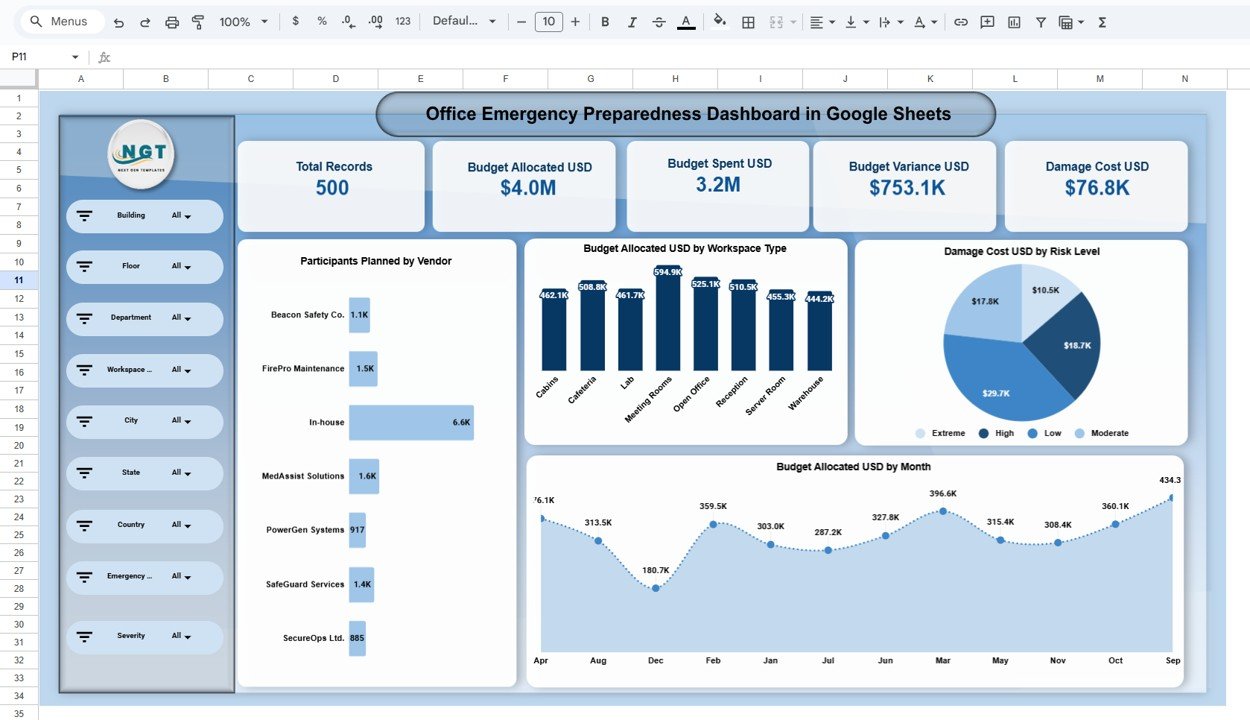
📊 Centralized Emergency Preparedness Overview
The main dashboard provides a high-level snapshot of organizational readiness, including:
-
Total preparedness records
-
Budget allocated vs budget spent
-
Budget variance
-
Damage cost analysis
These KPIs help leadership quickly understand preparedness gaps and financial exposure.
🎛 Interactive Filters for Deep Analysis
Analyze emergency preparedness data dynamically using slicers for:
-
Building
-
Floor
-
Department
-
Workspace type
-
City, state, and country
-
Emergency type
-
Severity level
All charts and KPIs update instantly, allowing focused analysis by location or risk scenario.
📂 What’s Inside the Office Emergency Preparedness Dashboard
📌 1. Overview Sheet
This page provides management-level insights such as:
-
Overall preparedness records
-
Budget allocation vs spending
-
Budget variance trends
-
Damage cost distribution
-
High-risk areas and locations
It is ideal for executive reviews and compliance reporting.
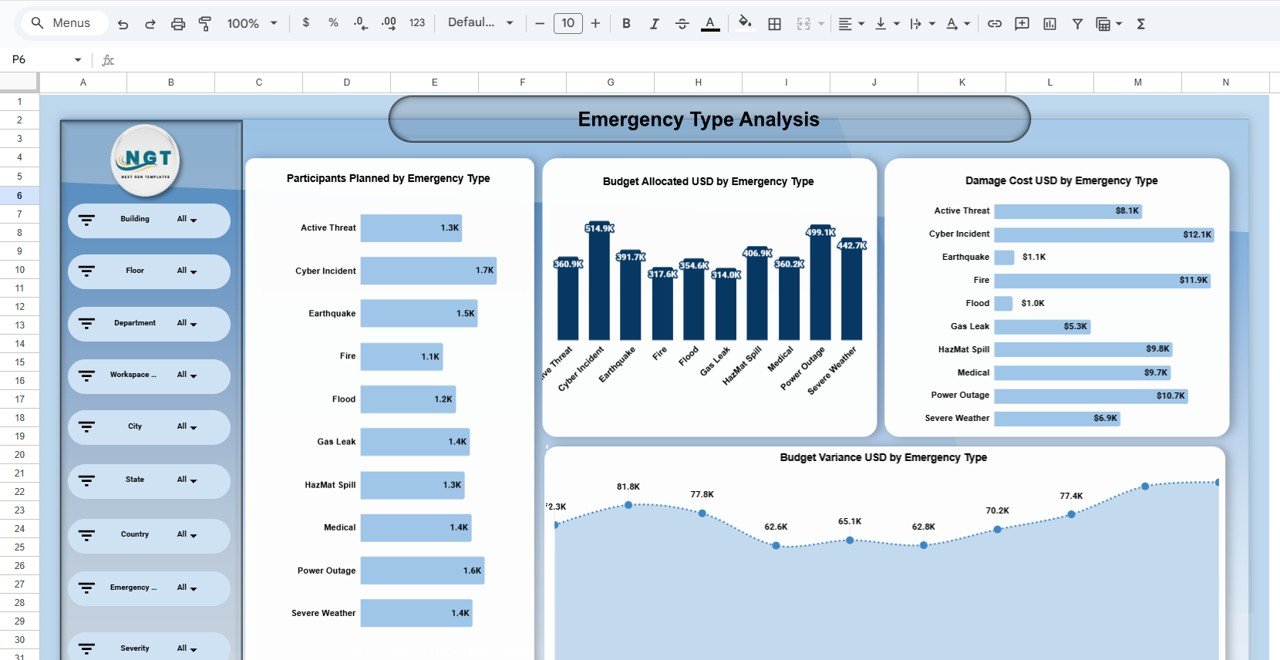
🔥 2. Emergency Type Analysis
Analyze preparedness by emergency type, including:
-
Fire
-
Cyber incidents
-
Earthquakes
-
Floods
-
Medical emergencies
-
Power outages
-
Severe weather
For each emergency type, you can track:
-
Participants planned
-
Budget allocated
-
Damage costs
-
Budget variance
This helps prioritize high-impact emergency scenarios.
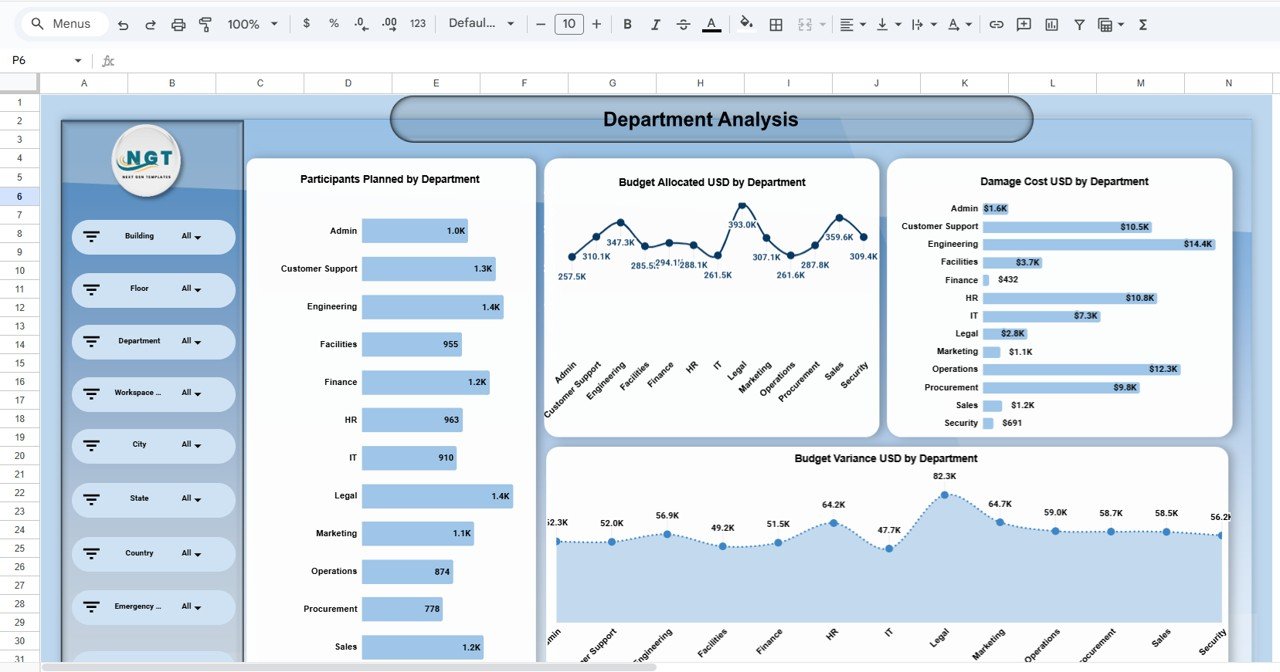
🏢 3. Department-Wise Preparedness Analysis
Understand how each department contributes to readiness by reviewing:
-
Participants planned by department
-
Budget allocation by department
-
Damage cost by department
-
Budget variance trends
This enables targeted training and resource allocation.
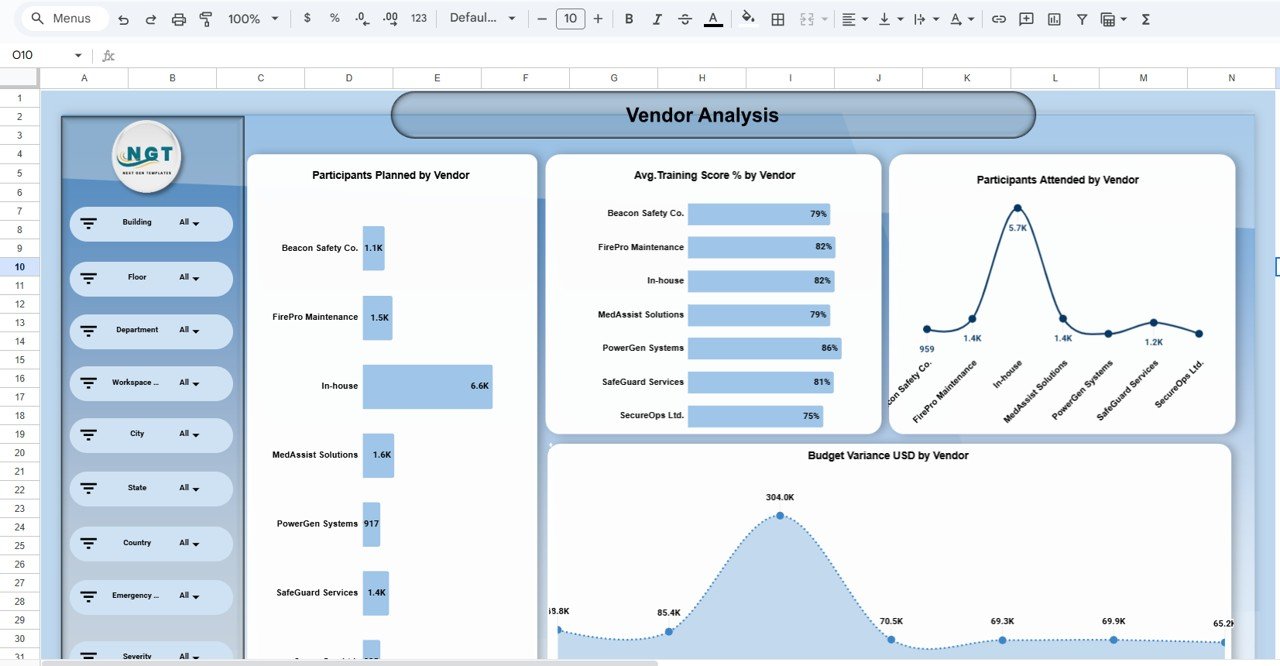
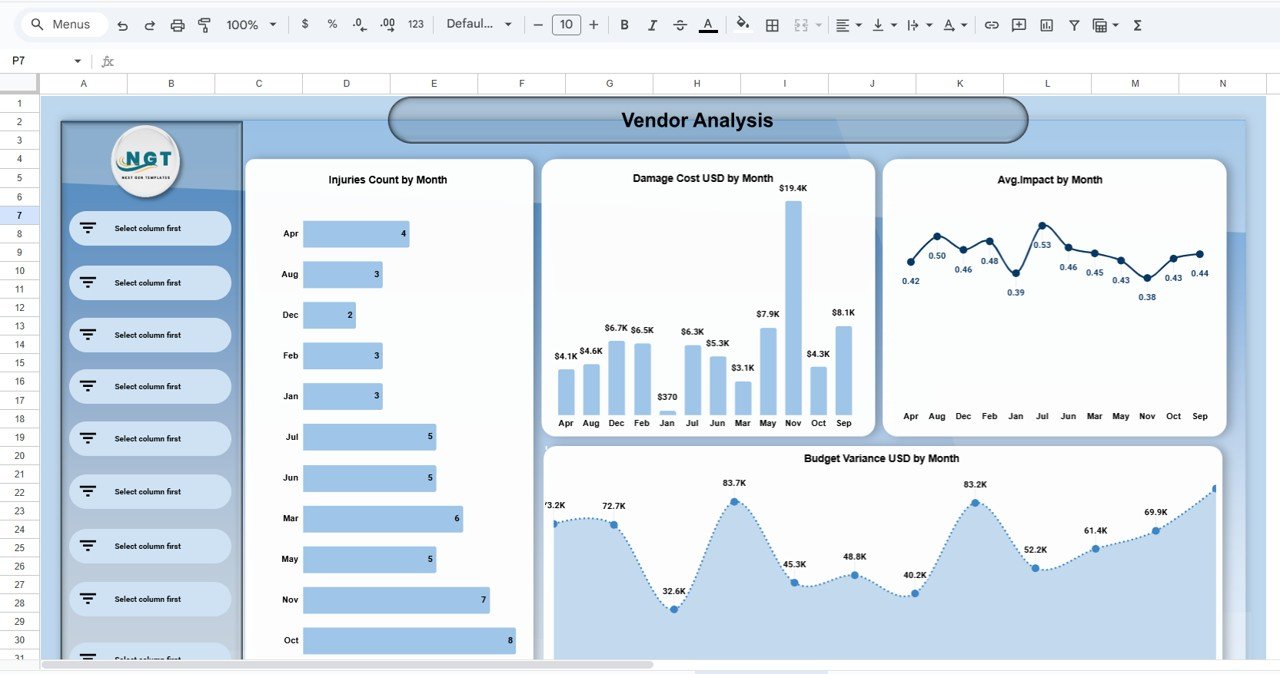
🤝 4. Vendor Performance & Training Analysis
Evaluate emergency service vendors and internal teams by tracking:
-
Participants planned by vendor
-
Training score percentage
-
Participants attended
-
Budget variance by vendor
This ensures vendors meet preparedness and training expectations.
📈 5. Monthly Trends & Risk Insights
Monitor preparedness trends over time, including:
-
Budget allocation by month
-
Damage cost by month
-
Injury counts
-
Average impact level
-
Risk severity trends
-
Budget variance over time
These insights support proactive risk mitigation instead of reactive response.
🔍 6. Advanced Search Functionality
A built-in search page allows users to:
-
Select any column
-
Enter a keyword
-
Instantly filter matching records
This is especially useful for audits, investigations, and compliance reviews.
▶️ How to Use the Office Emergency Preparedness Dashboard
-
Enter emergency preparedness data into the data table
-
Use filters to analyze by location, department, or emergency type
-
Review KPIs and charts to identify gaps
-
Track budgets, damage costs, and training participation
-
Share insights with stakeholders to improve readiness
👥 Who Can Benefit from This Dashboard
-
🚨 Corporate Safety & Compliance Teams
-
🏢 Facility & Operations Managers
-
⚠️ Risk Management Professionals
-
🔄 Business Continuity Planners
-
👥 HR & Training Departments
-
👔 Leadership & Administration
### Click here to read the Detailed blog post
Watch the step-by-step video tutorial:


Reviews
There are no reviews yet.