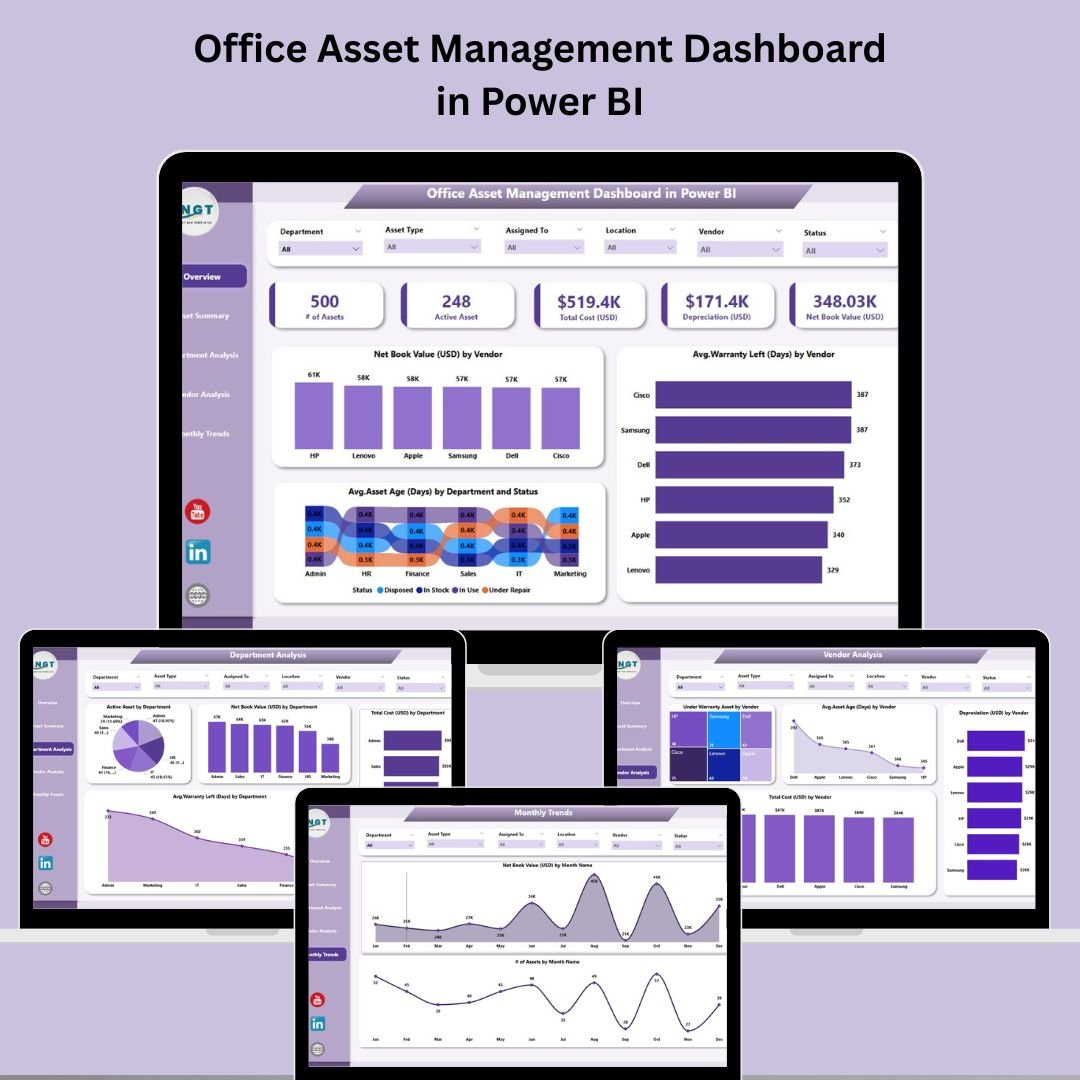
Keeping track of office assets can be a challenge—especially when you’re juggling multiple departments, vendors, and asset types. That’s why we’ve created the Office Asset Management Dashboard in Power BI, a ready-to-use solution designed to simplify your asset tracking and provide real-time insights into every corner of your organization’s asset landscape.
This dashboard connects seamlessly with Excel data to provide a centralized, visual, and interactive experience that enables smarter decisions, cost savings, and operational efficiency. Whether you want to track asset depreciation, check warranty statuses, or analyze trends over time—this tool does it all with stunning visualizations and intuitive navigation.
✨ Key Features of Office Asset Management Dashboard in Power BI
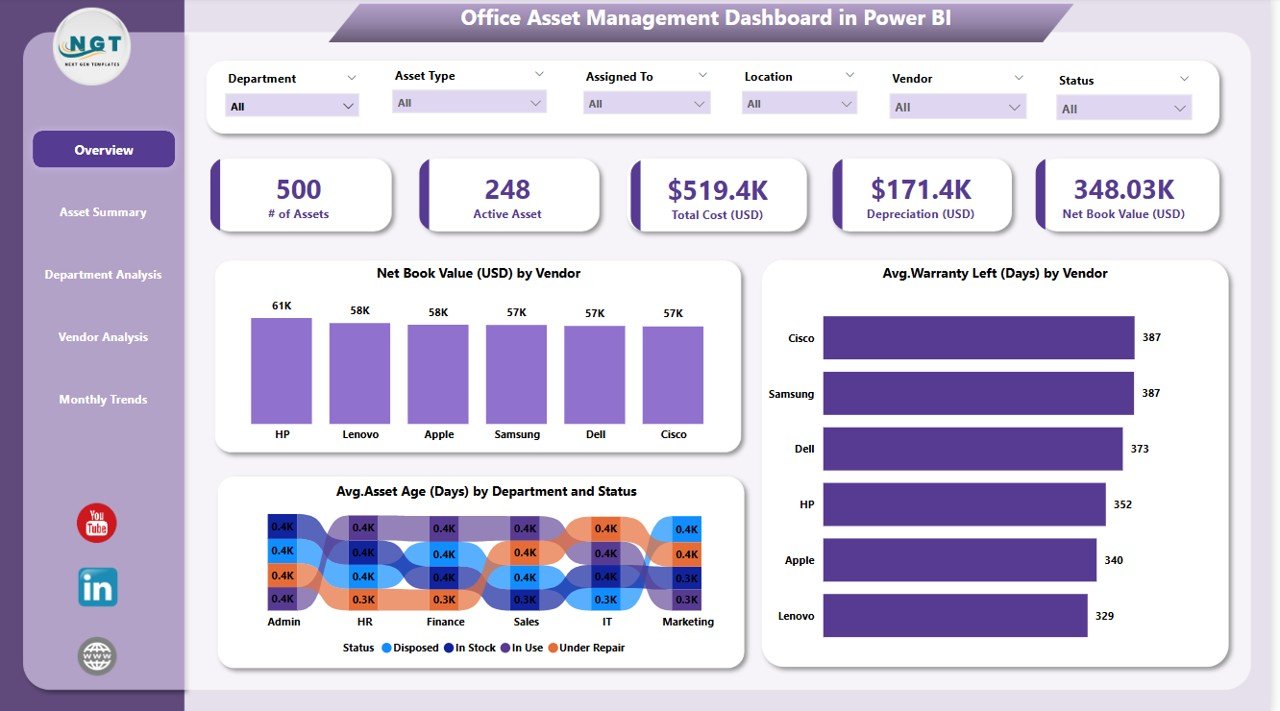
📌 Real-Time KPI Insights
View live metrics like total net book value, active asset count, depreciation, and more—updated in real time from your Excel data source.
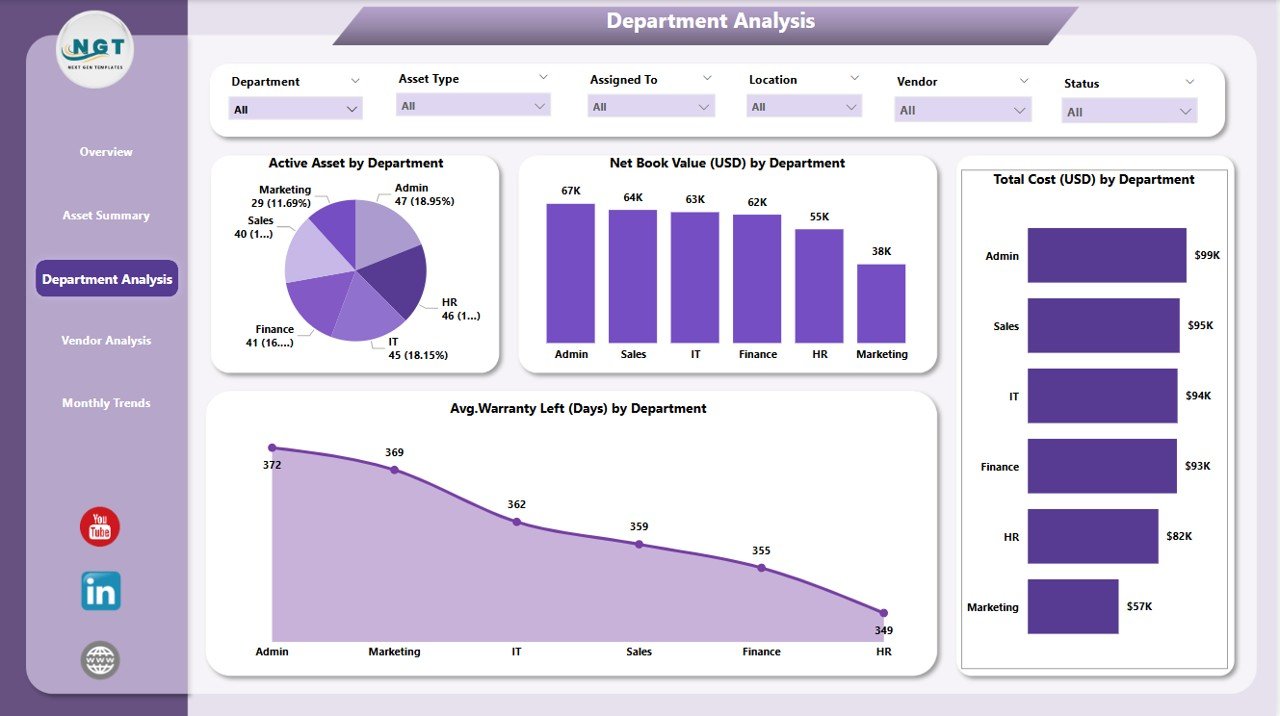
📈 Department-Wise Analysis
Track asset distribution, cost, and warranty status by department to identify underperforming or overutilized segments.
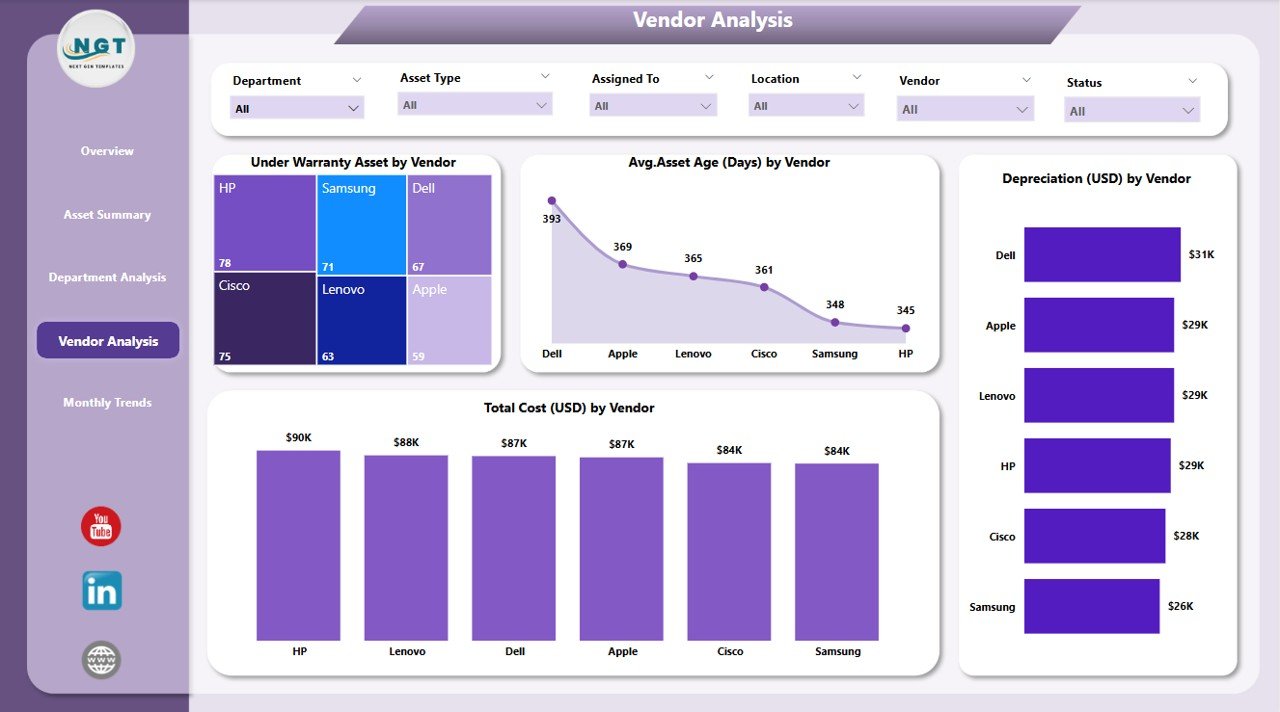
🛠️ Vendor Performance Tracking
Evaluate vendors based on asset age, depreciation, and cost to make informed purchasing and renewal decisions.
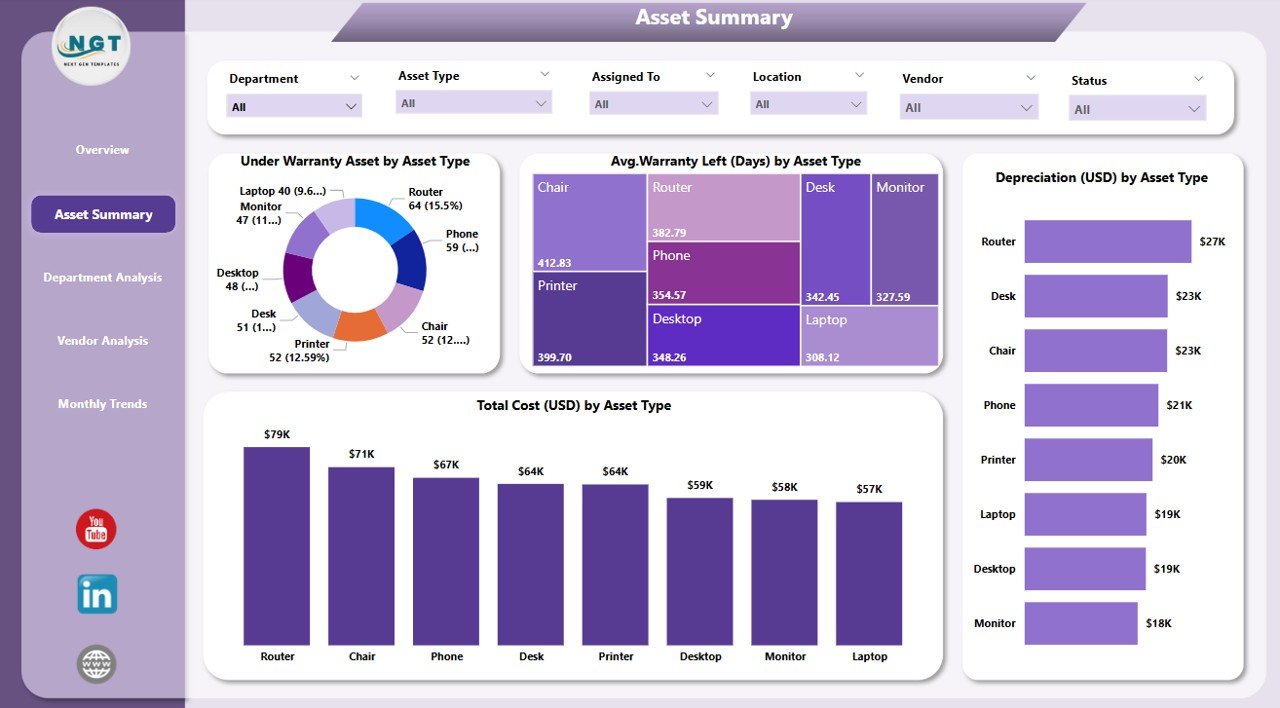
🧾 Asset Summary Visualization
See the complete breakdown of asset type, warranty status, cost, and condition across categories.
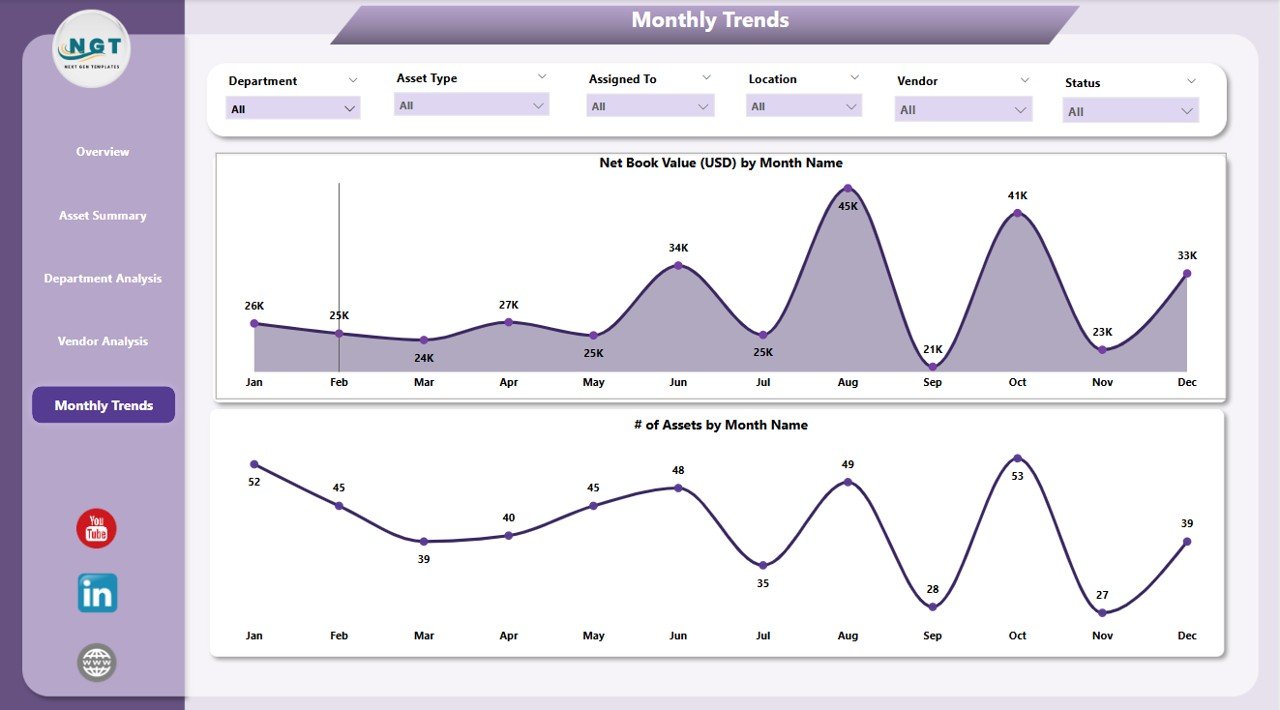
🗓️ Monthly Trend Analysis
Analyze asset additions, removals, or changes in value month by month to forecast future investment needs.
🔍 Customizable Slicers
Easily filter data by department, vendor, asset type, warranty status, and more—tailored views for every stakeholder.
📂 What’s Inside the Office Asset Management Dashboard
Your dashboard includes five powerful report pages, each focused on different insights:
1️⃣ Overview Page
Get a quick snapshot of your entire asset inventory with KPIs and visual breakdowns by vendor and department.
2️⃣ Asset Summary Page
Dive deep into asset types, total costs, depreciation, and warranties. Compare categories and monitor performance instantly.
3️⃣ Department Analysis Page
Explore department-specific insights including asset counts, values, costs, and average warranty left.
4️⃣ Vendor Analysis Page
Track how each vendor’s assets are performing in terms of age, cost, and warranty. Spot underperformers instantly.
5️⃣ Monthly Trends Page
Monitor changes over time with trend charts on new assets, depreciation, and value shifts on a monthly basis.
🛠️ How to Use the Office Asset Management Dashboard
Using this tool is incredibly simple:
-
📥 Download the dashboard file
-
🧾 Connect your Excel-based asset data
-
🔄 Refresh to sync real-time updates
-
🎛️ Use slicers to filter by vendor, department, or asset type
-
📊 Review KPIs and charts for actionable insights
-
💡 Share with stakeholders to drive smarter asset decisions
No complex coding or Power BI experience required—just plug in your data and go!
👥 Who Can Benefit from This Dashboard?
This dashboard is a game-changer for:
-
🏢 Office Managers overseeing physical assets across multiple departments
-
🧑💼 IT and Operations Teams responsible for maintenance and tracking
-
🧾 Finance Departments looking to monitor depreciation and reduce costs
-
🛒 Procurement Teams evaluating vendor performance
-
🧠 Executives and Decision-Makers who need high-level insights for strategic planning
-
🧑🔧 Facility Managers who handle maintenance schedules and warranty tracking
If your team deals with assets—this dashboard will save you time, money, and effort!
🔗 Click here to read the Detailed blog post
🔗 Visit our YouTube channel to learn step-by-step video tutorials


Reviews
There are no reviews yet.