


Want to track your ocean conservation efforts without drowning in spreadsheets? 🌍💧
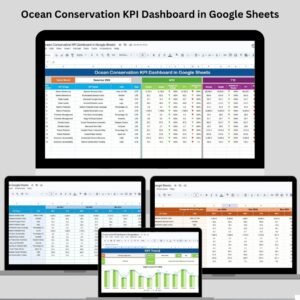
Introducing the Ocean Conservation KPI Dashboard in Google Sheets—your all-in-one, real-time tracking solution for marine protection strategies. Whether you’re a nonprofit, government agency, or private firm, this interactive tool will simplify your data monitoring and boost conservation results.
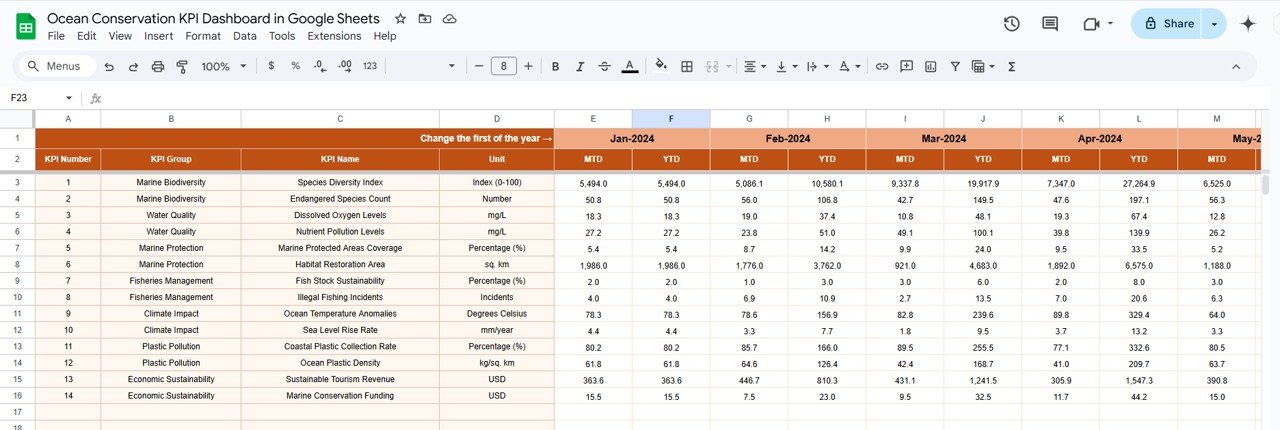
From tracking marine biodiversity to reducing ocean waste and monitoring sustainable fishing practices—this dashboard has everything you need to stay aligned with your environmental goals.

✨ Key Features of Ocean Conservation KPI Dashboard
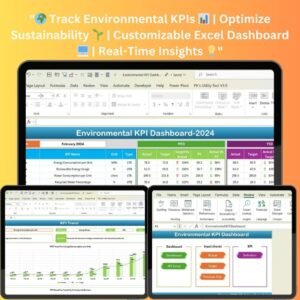
📊 Interactive Dashboard for Real-Time Tracking
The Dashboard sheet offers a bird’s-eye view of all key metrics:
-
📅 MTD & YTD Views – Month-to-date and year-to-date metrics for all KPIs.
-
📈 Comparison with Last Year – Easily assess improvements or setbacks.
-
🔺 Conditional Formatting – Red or green arrows indicate whether goals are being met.
You’ll instantly spot progress and problems—no need to dig through endless rows!
📉 KPI Trend Sheet for Long-Term Monitoring
Select any KPI from a dropdown to:
-
🐠 View performance over time
-
🔍 Understand KPI type (e.g., Lower/Upper the Better)
-
🧮 See KPI formula, unit, and category
This tab helps you visualize trends, improve performance, and tell better stories with data.
🧾 Actual Number Entry Sheet
Here’s where you update performance metrics:
-
📆 Monthly data input updates the dashboard instantly
-
🔄 MTD and YTD columns keep your reporting consistent
No fancy formulas needed—just enter your numbers and watch the magic happen! ✨
🎯 Target Sheet for Goal Setting
Every KPI needs a target, right? Set yours here:
-
🎯 Input MTD & YTD target values
-
🧩 Easily align team efforts with clearly defined benchmarks
🔁 Previous Year Number Sheet for Comparison
Input last year’s KPI numbers to track:
-
📊 Year-over-year improvement
-
🔄 Trend reversals or new challenges
This feature helps in setting realistic goals based on past performance.
🧠 KPI Definition Sheet for Clarity
Confused by what a KPI tracks? Not anymore!
-
📘 Define each KPI clearly with name, group, unit, formula, and description
-
🤝 Ensures team-wide understanding and alignment
📦 What’s Inside the Product?
-
✅ Pre-designed Google Sheets Dashboard Template
-
📊 Dashboard with visual metrics and conditional formatting
-
🧾 Editable sheets for Actuals, Targets, and Previous Year data
-
🔄 KPI Trend Viewer for each indicator
-
📘 KPI Definitions for transparency and clarity
-
🛠️ Fully customizable for your conservation goals
🧑💼 Who Can Benefit from This Dashboard?
This Google Sheets template is tailor-made for:
-
🐳 Marine Conservation NGOs tracking habitat restoration and biodiversity
-
🏛️ Government agencies monitoring pollution, overfishing, or ocean health
-
🧪 Research teams studying marine ecosystems and coral health
-
🌐 Private companies involved in sustainable ocean-use initiatives
-
🌍 Environmental consultants supporting data-driven decisions
Whether you’re saving coral reefs or reducing plastic waste—this tool works for you!
💡 How to Use the Ocean Conservation KPI Dashboard
-
📥 Download and open the Google Sheets file
-
✏️ Enter your latest data in the Actual Number Sheet
-
🎯 Set your MTD and YTD targets in the Target Sheet
-
📊 Watch the dashboard update with every entry
-
📘 Refer to the KPI Definition Sheet to ensure everyone is on the same page
-
🔍 Use the KPI Trend sheet to monitor long-term progress
No coding. No expensive software. Just clean, clear, conservation tracking.
🔗 Click here to read the Detailed blog post
Watch the step-by-step video Demo:


Reviews
There are no reviews yet.