In the mission-driven world of non-profit organizations, impact matters more than profit — but data still drives decisions. The Non-Profit KPI Scorecard in Excel empowers non-profits to measure success, manage performance, and communicate impact clearly — all in one easy-to-use, affordable Excel template.
This ready-to-use tool transforms raw data into actionable insights, helping non-profit leaders and teams track progress toward their goals. Whether you’re monitoring donations, volunteer engagement, program outcomes, or operational efficiency, this scorecard gives you a complete performance picture — without needing complex software or technical skills.
With its intuitive design, automated calculations, and dynamic visuals, this Excel scorecard allows you to track Month-to-Date (MTD) and Year-to-Date (YTD) metrics, compare actual vs target values, and visualize trends across time. It’s perfect for NGOs, charities, foundations, and community organizations seeking transparency, accountability, and continuous improvement.
✨ Key Features of the Non-Profit KPI Scorecard in Excel
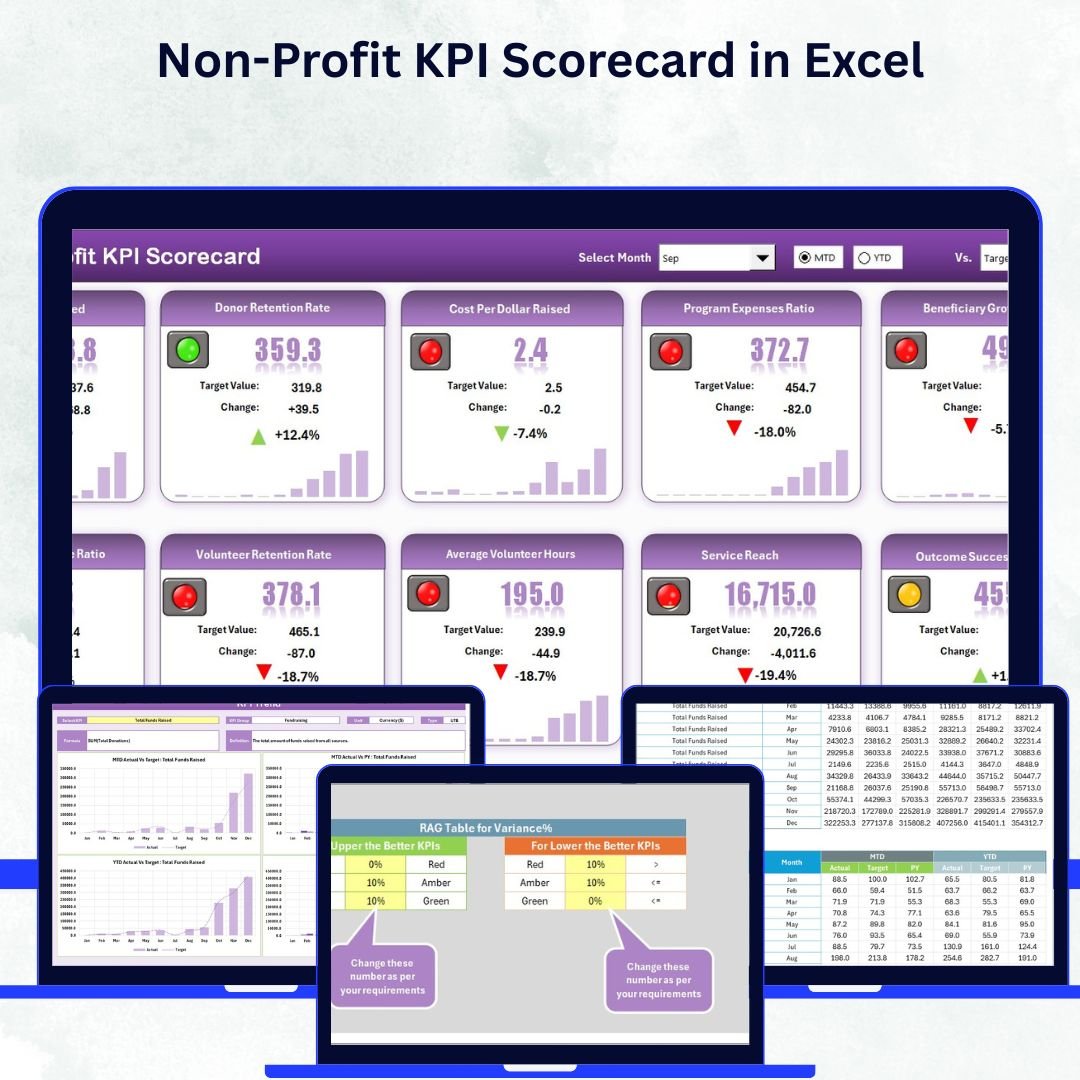
📊 Centralized Dashboard: The Scorecard Sheet provides a high-level overview of all KPIs with MTD and YTD comparisons.
🎯 Actual vs Target Tracking: Instantly identify which objectives are being met and where improvement is needed.
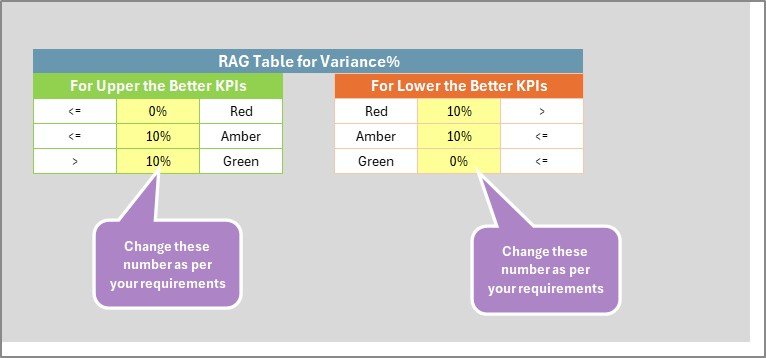
🎨 Color-Coded Indicators: Conditional formatting highlights performance levels — green for success, red for attention.
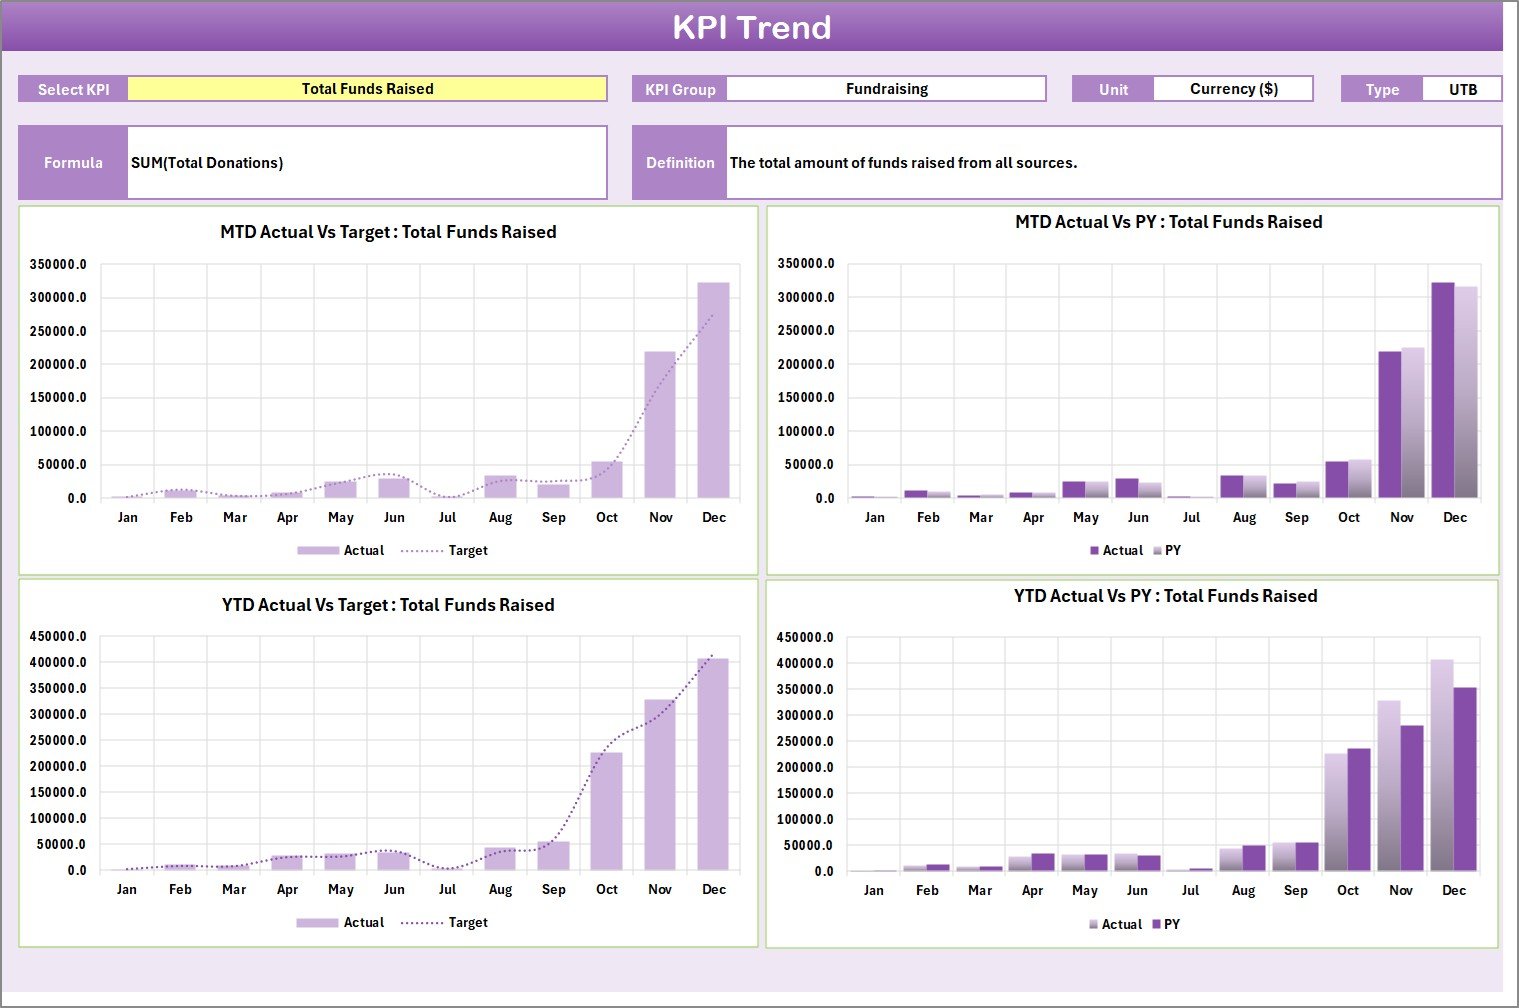
📈 Interactive Trend Analysis: The KPI Trend Sheet allows visual exploration of monthly and yearly performance progress.
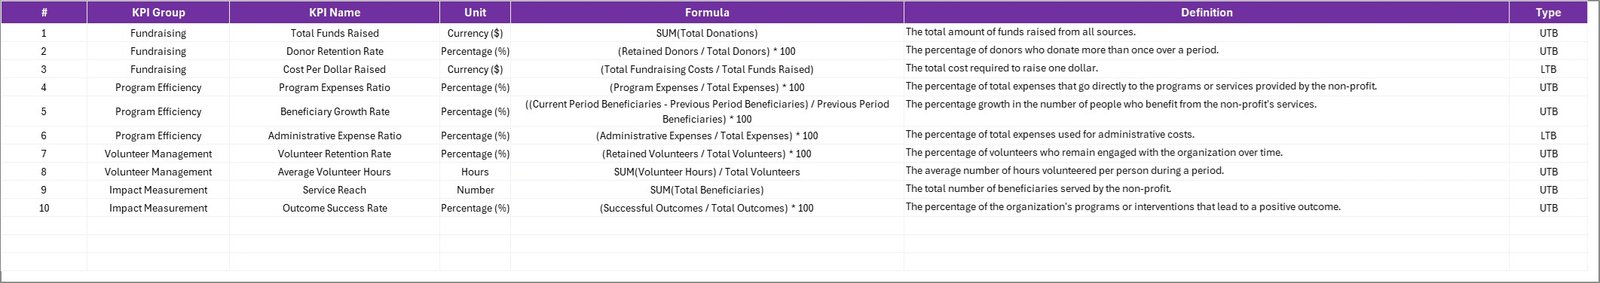
🧩 Comprehensive KPI Definition: Includes a reference sheet explaining each KPI’s name, group, unit, and formula.
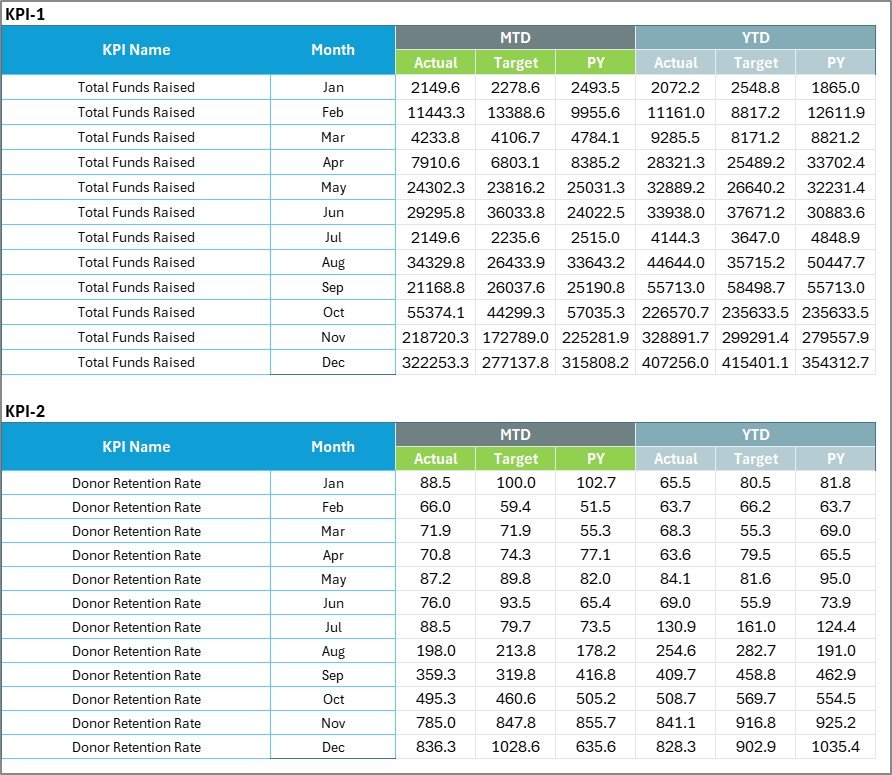
📅 Flexible Data Input: Input Sheet enables quick data entry and automatic updates across the entire workbook.
💡 Automated Calculations: No manual effort — Excel formulas compute metrics and update dashboards instantly.
📋 Category-Based Tracking: Monitor KPIs across fundraising, volunteer engagement, program impact, and operations.
💰 Cost-Effective: Fully Excel-based — no subscriptions or additional software needed.
📘 What’s Inside the Non-Profit KPI Scorecard in Excel
The template includes four integrated worksheets designed to give you complete visibility and control:
1️⃣ Scorecard Sheet:
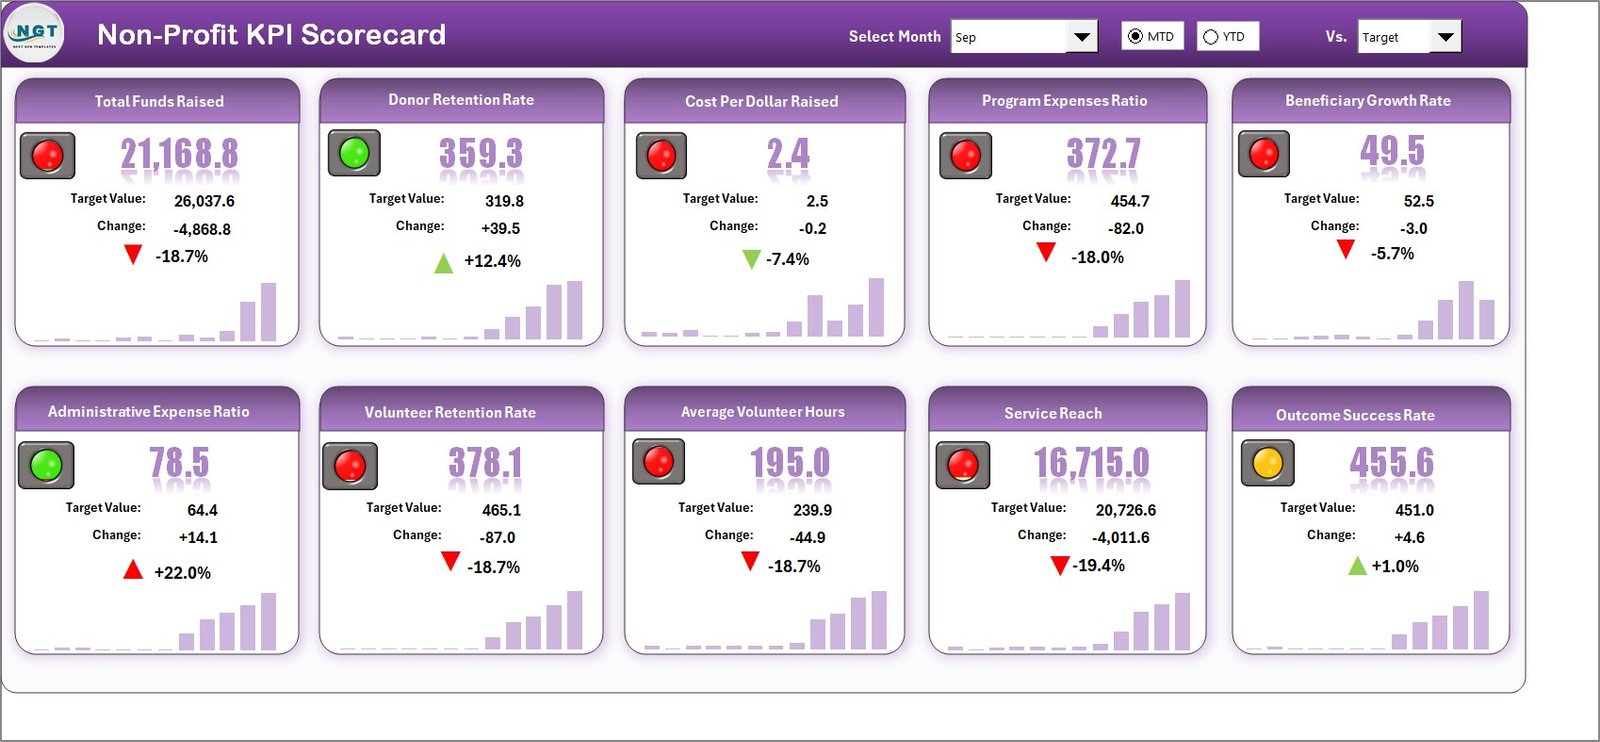
Your main dashboard — with KPI cards, dropdown filters for month and period (MTD/YTD), and color-coded visuals that summarize organizational performance.
2️⃣ KPI Trend Sheet:
Select any KPI to explore its progress over time. Visualize Actual vs Target vs Previous Year data using dynamic charts that highlight performance patterns and trends.
3️⃣ Input Data Sheet:
The data engine of your scorecard. Enter your monthly actual and target values here, and watch the rest of the dashboard update automatically.
4️⃣ KPI Definition Sheet:
Provides the foundation for clarity and consistency. Lists each KPI with its group, unit, formula, and definition — ensuring everyone interprets metrics the same way.
This simple yet powerful structure ensures data accuracy, transparency, and meaningful performance analysis at every level.
⚡ How to Use the Non-Profit KPI Scorecard in Excel
✅ Step 1: Define your organization’s KPIs in the KPI Definition Sheet.
✅ Step 2: Enter monthly actual and target data in the Input Data Sheet.
✅ Step 3: Open the Scorecard Sheet to view overall MTD and YTD performance.
✅ Step 4: Use dropdowns to filter by period or specific months.
✅ Step 5: Visit the KPI Trend Sheet to analyze progress visually and identify improvement areas.
All data updates automatically — saving hours of manual reporting time while ensuring accuracy.
👥 Who Can Benefit from the Non-Profit KPI Scorecard in Excel
💚 Non-Profit Executives: Gain clear visibility into impact metrics and financial efficiency.
📊 Fundraising Managers: Track donations, donor retention, and campaign ROI.
🤝 Volunteer Coordinators: Measure participation, engagement, and retention rates.
🏢 Program Directors: Monitor program success rates and beneficiaries served.
📈 Finance Teams: Evaluate spending ratios, cost per dollar raised, and budget variance.
💡 Board Members: Review performance reports that are transparent, visual, and easy to interpret.
This scorecard helps every stakeholder understand performance, align on goals, and make data-driven decisions that advance the organization’s mission.
🔗 Click here to read the Detailed Blog Post
🎥 Visit our YouTube channel to learn step-by-step video tutorials
🔗 YouTube.com/@PKAnExcelExpert


Reviews
There are no reviews yet.