


In today’s highly competitive digital media landscape, news portals must track performance daily to stay ahead. Traffic patterns change fast, audience behavior shifts constantly, and revenue streams depend on multiple digital channels. Therefore, relying on assumptions or scattered reports never works anymore.
That is exactly where the News Portals KPI Dashboard in Excel becomes a must-have analytical solution.
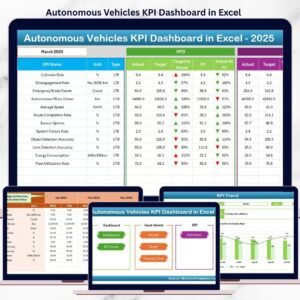
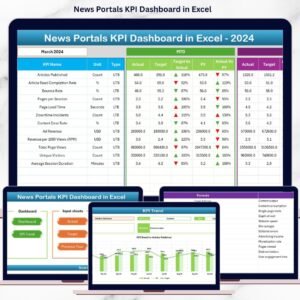
This ready-to-use Excel dashboard helps news portals convert raw performance data into clear, actionable insights. Instead of juggling multiple spreadsheets for traffic, engagement, revenue, and editorial performance, you get a single, structured, and interactive dashboard designed for faster and smarter decisions.
Whether you manage editorial operations, digital marketing, or business performance, this dashboard gives you complete visibility into what truly matters.
🔑 Key Features of News Portals KPI Dashboard in Excel
📌 Centralized KPI Monitoring – Track traffic, engagement, revenue, and operational KPIs from one unified Excel dashboard.
📌 Dynamic Month Selection – Change the reporting month using a dropdown, and the entire dashboard updates instantly.
📌 MTD & YTD Analysis – View Month-to-Date and Year-to-Date performance side by side for accurate comparisons.
📌 Target vs Actual Tracking – Identify performance gaps clearly using calculated variance metrics.
📌 Previous Year Comparison – Measure growth trends with automatic year-over-year comparisons.
📌 Visual Performance Indicators – Conditional formatting arrows highlight positive and negative KPI movements instantly.
📌 User-Friendly Navigation – One-click buttons allow quick movement between dashboard sheets.

📂 What’s Inside the News Portals KPI Dashboard in Excel
This product includes seven professionally designed Excel worksheets, each serving a specific purpose:
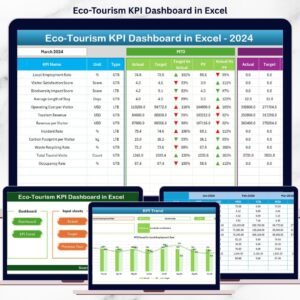
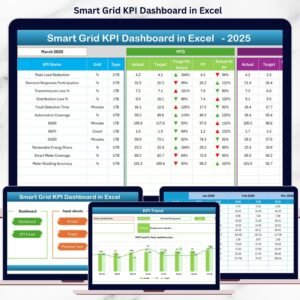
📁 Summary Page (Index Sheet) – A clean navigation page with six buttons for instant access to all dashboard sections.
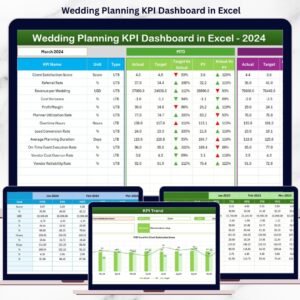
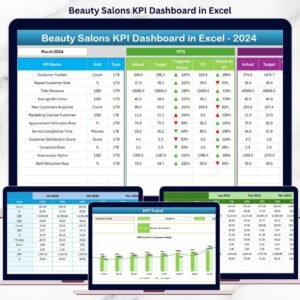
📁 Dashboard Sheet – The main KPI view displaying all MTD and YTD KPIs with targets, previous year values, and visual indicators.
📁 Trend Sheet – Detailed KPI trend analysis with monthly charts for Actual, Target, and Previous Year performance.
📁 Actual Numbers Sheet – Simple data-entry sheet for entering MTD and YTD actual values.
📁 Target Sheet – Dedicated sheet to define monthly KPI targets for accurate benchmarking.
📁 Previous Year Sheet – Stores historical data to enable year-over-year performance analysis.
📁 KPI Definition Sheet – Clear documentation of KPI names, groups, units, formulas, and definitions to maintain consistency.
Together, these sheets create a complete KPI management system for news portals.
⚙️ How to Use the News Portals KPI Dashboard in Excel
Using this dashboard is simple and requires no advanced Excel skills.
1️⃣ Enter KPI definitions and formulas in the KPI Definition Sheet
2️⃣ Input monthly targets in the Target Sheet
3️⃣ Add actual MTD and YTD values in the Actual Numbers Sheet
4️⃣ Enter previous year values in the Previous Year Sheet
5️⃣ Select the reporting month from the dropdown on the Dashboard Sheet
6️⃣ Review performance insights, trends, and comparisons instantly
As a result, you spend less time preparing reports and more time acting on insights.
👥 Who Can Benefit from This News Portals KPI Dashboard in Excel
This dashboard is ideal for:
📰 Digital News Portals
📰 Online Media & Publishing Companies
📰 Editorial & Content Teams
📰 Digital Marketing & SEO Teams
📰 Revenue & Subscription Managers
📰 Media Analytics & Strategy Teams
Because it is built in Excel, teams can adopt it instantly without expensive BI tools or complex setups.
Click here to read the Detailed blog post
Watch the step-by-step video tutorial:
Visit our YouTube channel to learn step-by-step video tutorials
https://youtube.com/@PKAnExcelExpert


Reviews
There are no reviews yet.