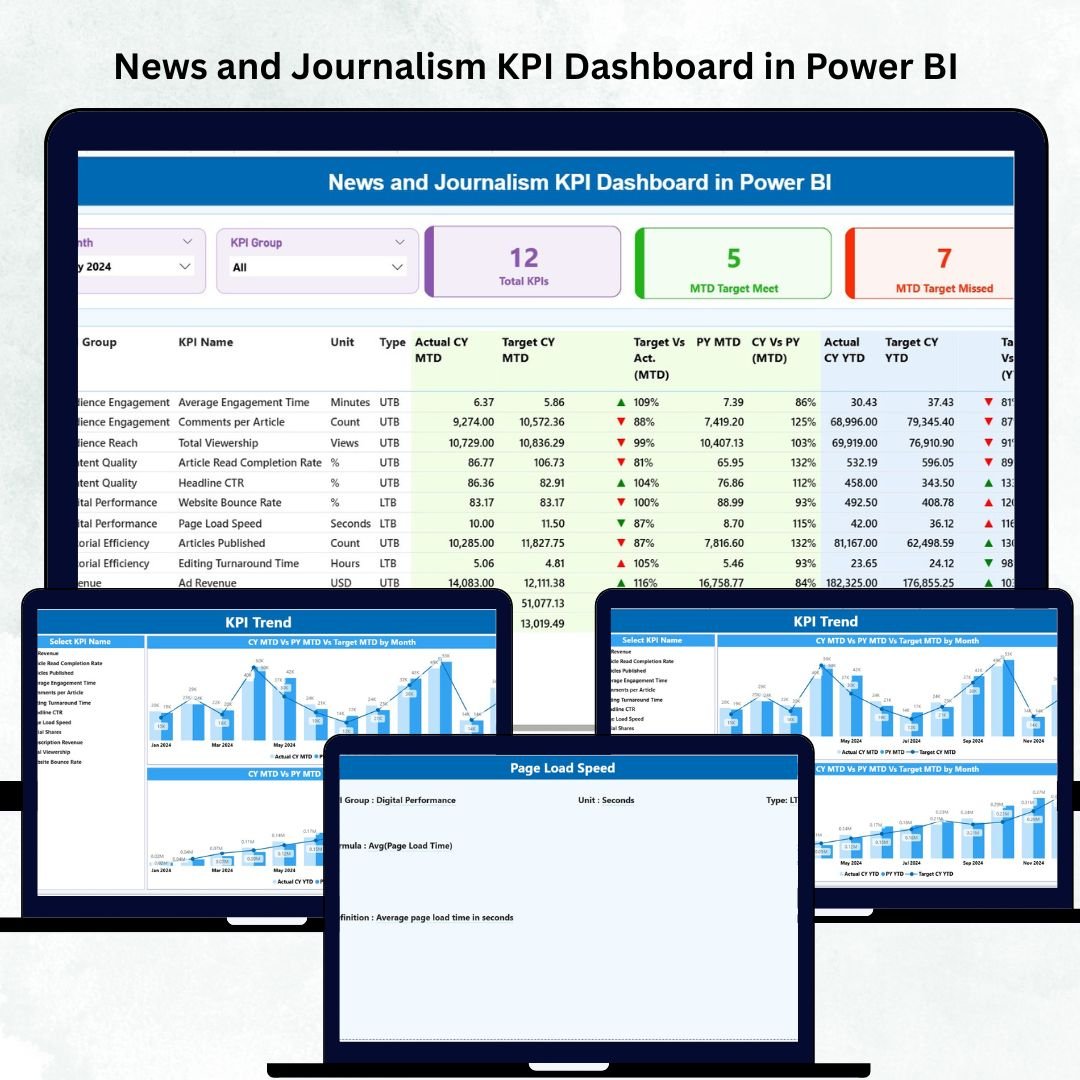
News and Journalism KPI Dashboard in Power BI The news industry changes by the hour. New stories break, audience behavior shifts, publishing speed becomes critical, and digital platforms bring new challenges every day. News and Journalism KPI Dashboard in Power BI In such a fast-moving environment, media teams need more than spreadsheets — they need real-time insights, quick comparisons, and clear KPI tracking.
The News and Journalism KPI Dashboard in Power BI is designed specifically for modern news organizations that want to stay ahead. It helps track content production, engagement performance, audience reach, publishing speed, and digital growth — all in a clean, interactive, and powerful dashboard. News and Journalism KPI Dashboard in Power BI with MTD and YTD comparisons, trend visualizations, and drill-through KPI definitions, this dashboard brings complete transparency to your newsroom operations.
News and Journalism KPI Dashboard in Power BI Whether you’re a news editor, journalist, analyst, or leadership executive, this dashboard helps you understand what is working, what needs improvement, and where the newsroom should focus efforts next.
Let’s explore what makes this Power BI dashboard one of the best tools for media performance analysis 👇
✨ Key Features of the News and Journalism KPI Dashboard in Power BI
📊 1. Three Powerful, Ready-to-Use Pages
Includes Summary, KPI Trend, and KPI Definition pages — each designed to give strong insights with clean visuals and smart navigation.
🎯 2. Real-Time KPI Tracking
Monitor MTD and YTD performance, Target vs Actual, CY vs PY, and KPI group-level insights instantly.
📰 3. Tailored for Newsrooms
Track publishing efficiency, content output, digital reach, engagement metrics, operational KPIs, and revenue-related KPIs.
🧭 4. Smart Slicers for Fast Filtering
Filter by Month or KPI Group to explore performance from different angles.
🔍 5. Drill-Through KPI Definition Page
Right-click any KPI to open a detailed page showing formula, unit, definition, and type (UTB or LTB).
📈 6. Month-Wise Trend Analysis
Combo charts track actual vs PY vs target performance for every KPI — helping editors detect improvement areas quickly.
🔄 7. Easy Excel-Based Data Updates
Update your Excel Actuals, Targets, and KPI Definition sheets — and Power BI automatically refreshes everything.
📦 What’s Inside the News and Journalism KPI Dashboard in Power BI
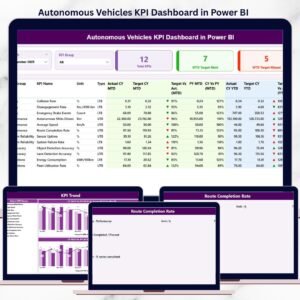
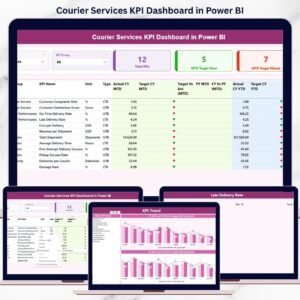
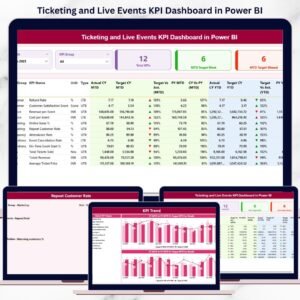
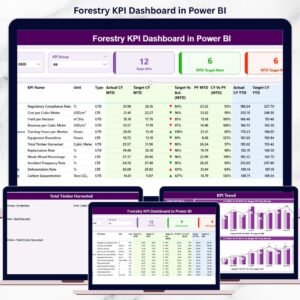
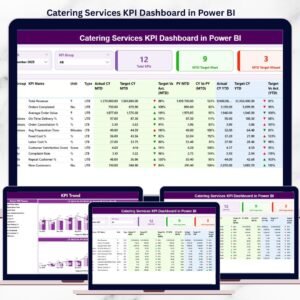
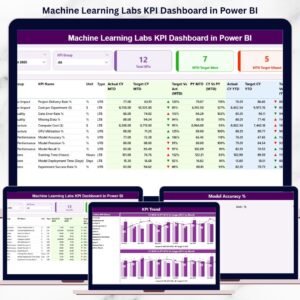
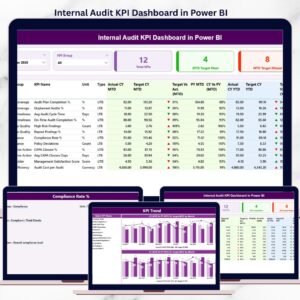
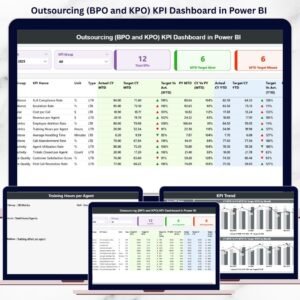
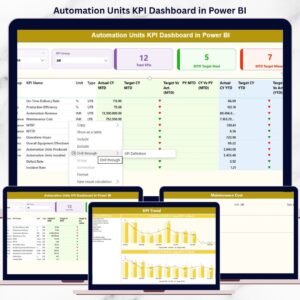
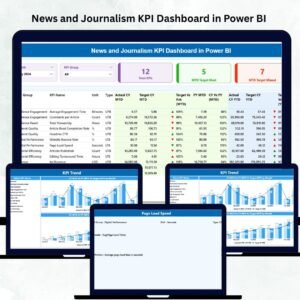
🏠 1. Summary Page (Main Performance Overview)
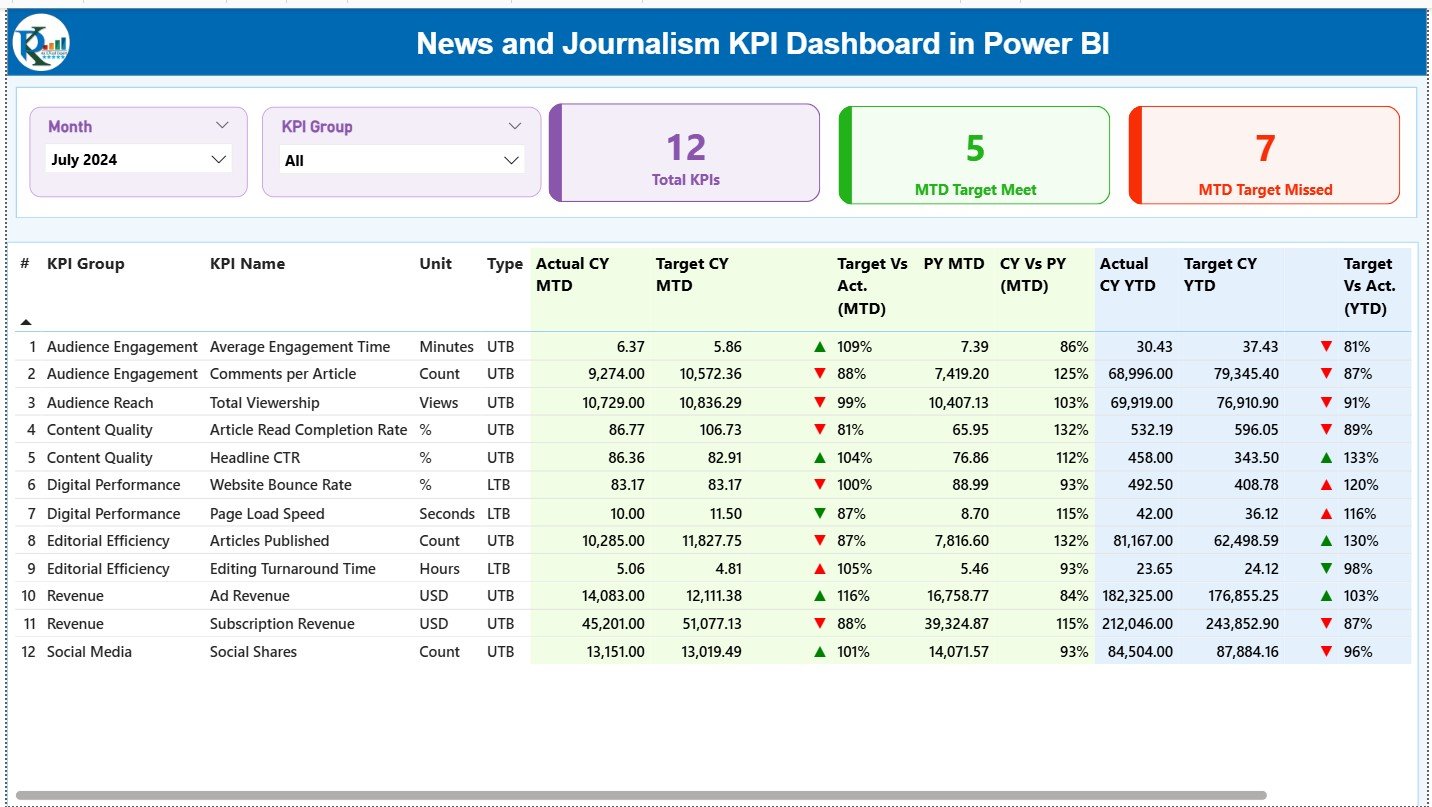
Get a complete snapshot of your newsroom performance:
-
🔵 Month Slicer
-
🟡 KPI Group Slicer
-
🟢 KPI Cards:
-
Total KPIs Count
-
MTD Target Met
-
MTD Target Missed
-
Below these, a detailed comparison table shows the full performance matrix, making it easy to review deviations and take corrective actions.
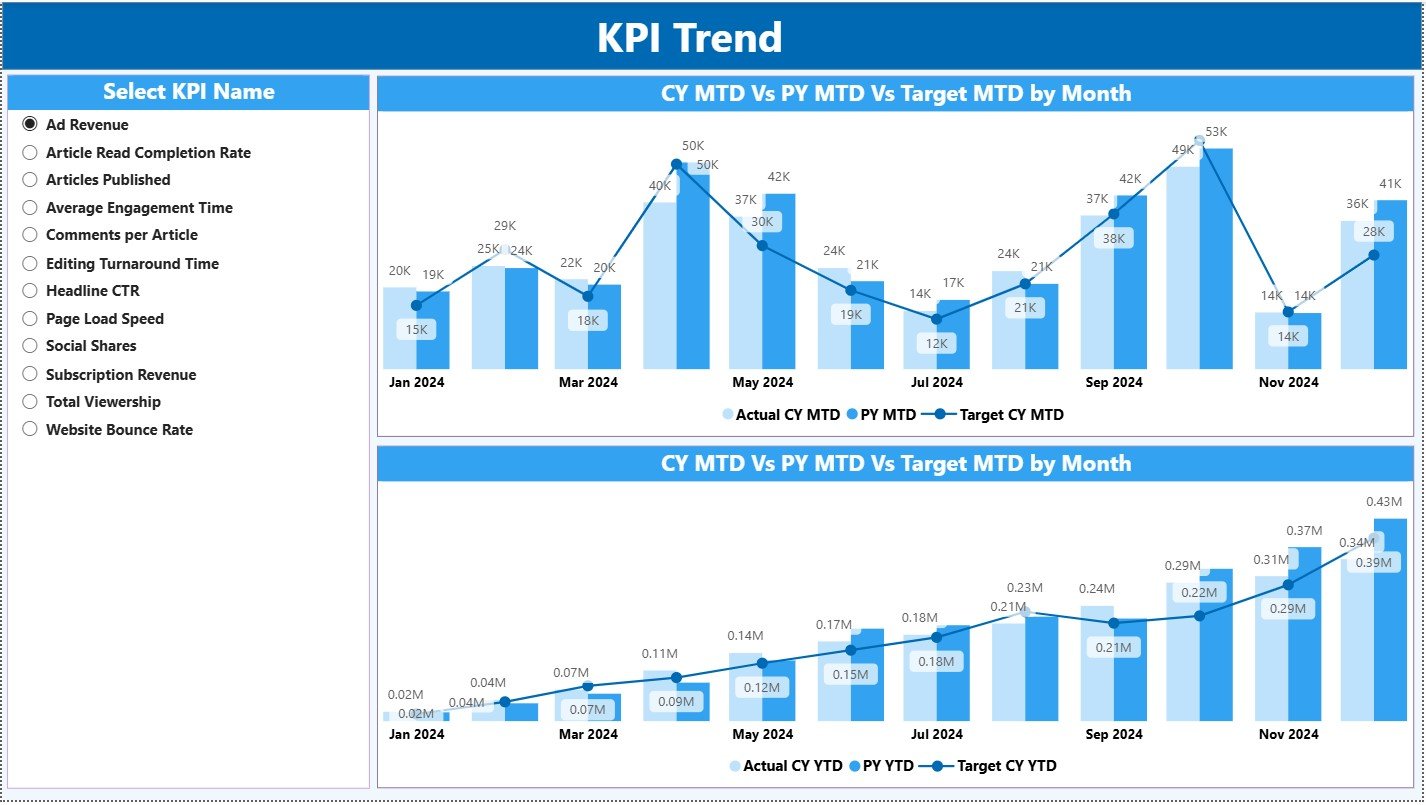
📈 2. KPI Trend Page (Month-Wise Analysis)
Select any KPI and view:
-
📊 MTD Trend (Actual vs Target vs PY)
-
📉 YTD Trend (Actual vs Target vs PY)
Perfect for identifying changes in publishing speed, engagement behavior, story count, digital reach, and operational efficiency throughout the year.
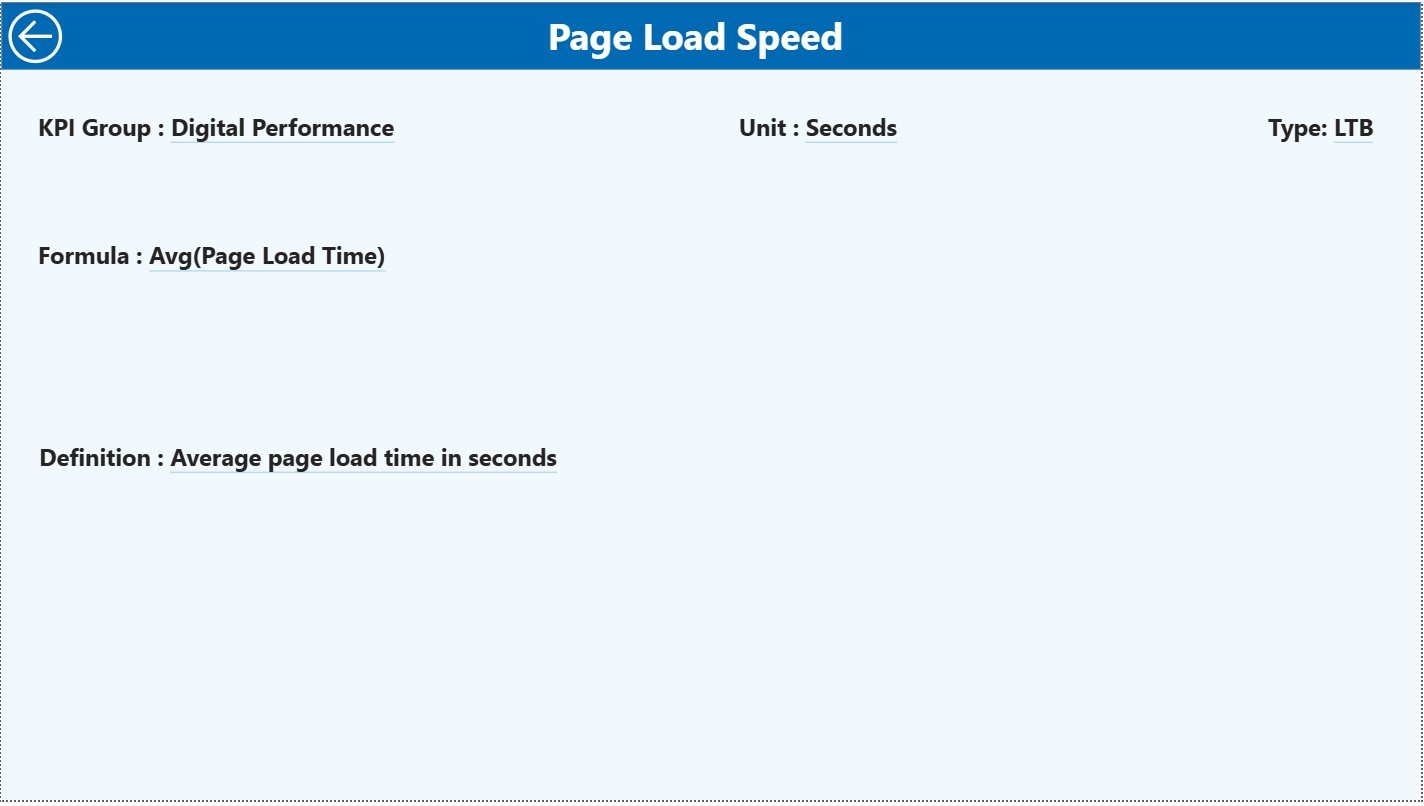
📘 3. KPI Definition Page (Drill-Through Insights)
A complete clarity page showing:
-
KPI Number
-
KPI Group
-
KPI Name
-
Unit
-
Formula
-
Definition
-
Type (LTB or UTB)
This ensures all team members understand KPI logic and calculation methods.
📁 Excel Input Structure
Your Power BI dashboard connects to three Excel sheets:
-
Input_Actual – MTD & YTD Actual
-
Input_Target – MTD & YTD Target
-
KPI Definition Sheet – KPI metadata for drill-through
This makes monthly reporting smooth, fast, and consistent.
🧭 How to Use the News and Journalism KPI Dashboard in Power BI
🔹 Step 1: Update Excel Sheets
Add actuals, targets, and KPI definitions into the respective worksheets.
🔹 Step 2: Refresh Power BI
Load the updated Excel into Power BI Desktop and refresh visuals instantly.
🔹 Step 3: Analyze KPIs
Use slicers to compare categories like Production, Digital Engagement, Audience, Revenue, or Operations.
🔹 Step 4: Use the Trend Page for Long-Term Insights
Track story production growth, viewer engagement changes, and digital performance patterns.
🔹 Step 5: Drill Into KPI Details
Right-click any KPI from the Summary Page to understand its formula and definition.
🔹 Step 6: Share with the Team
Publish the dashboard on Power BI Service for editors, digital teams, managers, and analysts.
🎯 Who Can Benefit from This News and Journalism KPI Dashboard?
📰 News Editors & Journalists
Track publishing timelines, breaking news performance, and story production.
📲 Digital & social media Teams
Analyze engagement, page views, video watch time, impressions, and bounce rate.
👨💼 Leadership Teams & Department Heads
Review MTD/YTD performance, identify trends, and plan quarterly editorial strategies.
📈 Data Analysts & BI Teams
Use structured data and smart visuals to build precise reports quickly.
🎥 TV, Print, Radio & Online Media Companies
Perfect for any media format — supports content tracking across all platforms.


Reviews
There are no reviews yet.