
Are you struggling to monitor network performance across multiple tools and spreadsheets? Finding it difficult to track uptime, latency, and bandwidth usage in real time?
Network Performance KPI Dashboard in Google Sheets!
This powerful, ready-to-use Google Sheets dashboard is designed for IT teams, network engineers, and analysts who want to monitor, analyze, and optimize network performance efficiently. Instead of dealing with scattered data and manual reporting, this dashboard centralizes all your key performance indicators (KPIs) into one interactive and cloud-based platform.
With dynamic visuals, automated calculations, and real-time updates, you can easily track network health, identify performance issues, and make faster, data-driven decisions. As a result, you can improve network reliability, reduce downtime, and enhance operational efficiency.
Key Features of Network Performance KPI Dashboard in Google Sheets
✨ 📊 Real-Time KPI Monitoring – Track network performance metrics like uptime, latency, and bandwidth instantly.
✨ ⚡ Performance Tracking Made Easy – Monitor key KPIs and identify issues before they impact operations.
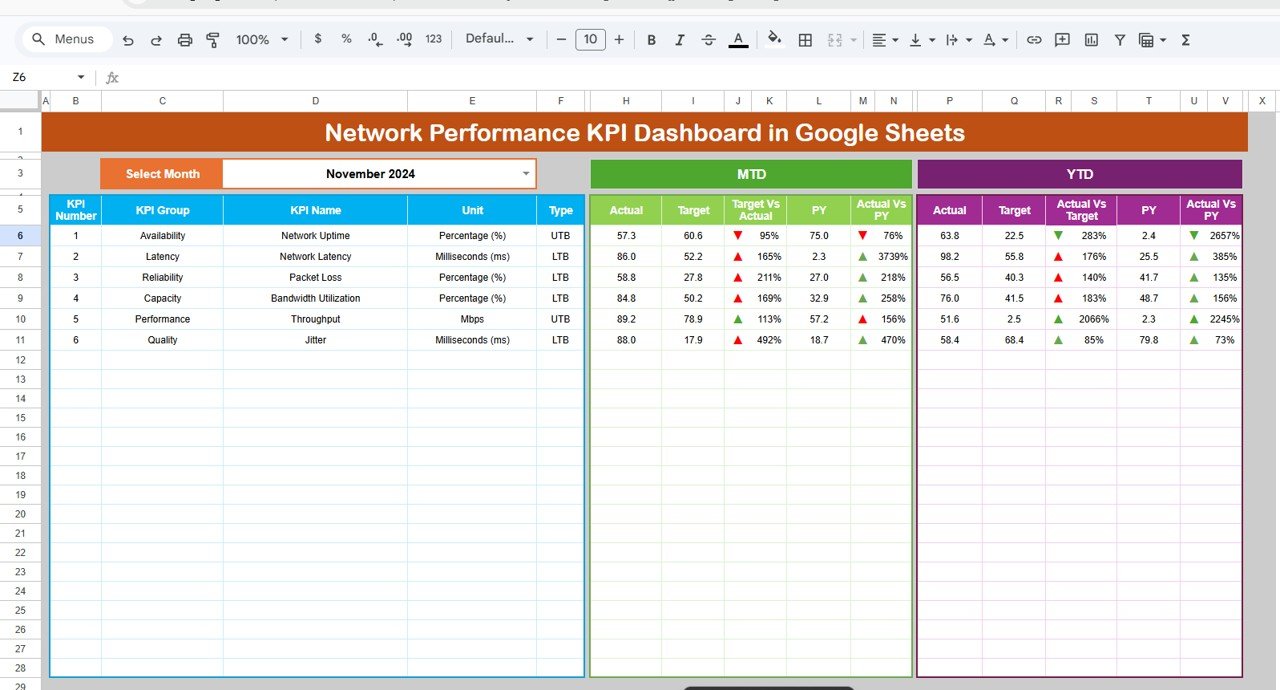
✨ 🎯 Target vs Actual Comparison – Compare actual performance against targets for both MTD and YTD metrics.
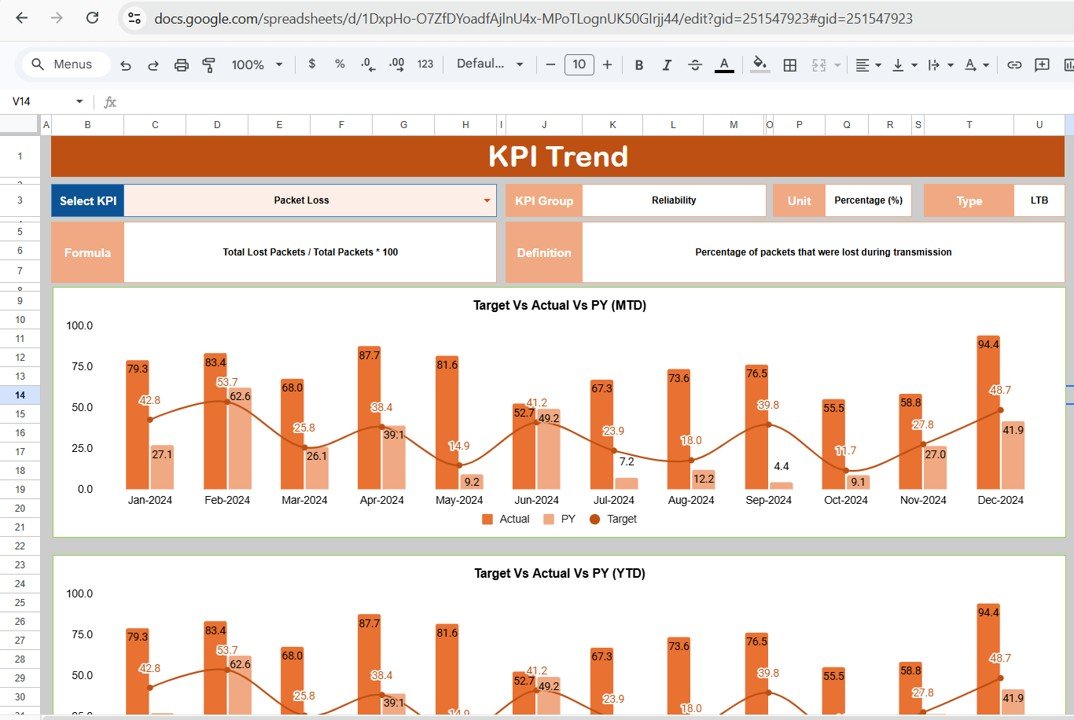
✨ 📈 KPI Trend Analysis – Analyze performance trends over time and identify patterns or bottlenecks.
✨ 🎛️ Interactive Dashboard Controls – Select months and KPIs using dropdowns for dynamic analysis.
✨ ☁️ Cloud-Based Access – Access your dashboard anytime, anywhere with Google Sheets.
✨ ⚡ Automated Calculations & Updates – All charts and KPIs update automatically when data is entered.
📂 What’s Inside the Network Performance KPI Dashboard in Google Sheets
📁 Dashboard Sheet – Central view showing all KPIs with MTD and YTD comparisons, conditional formatting, and visuals.
📁 KPI Trend Sheet – Analyze individual KPI trends with dropdown selection and detailed KPI information.
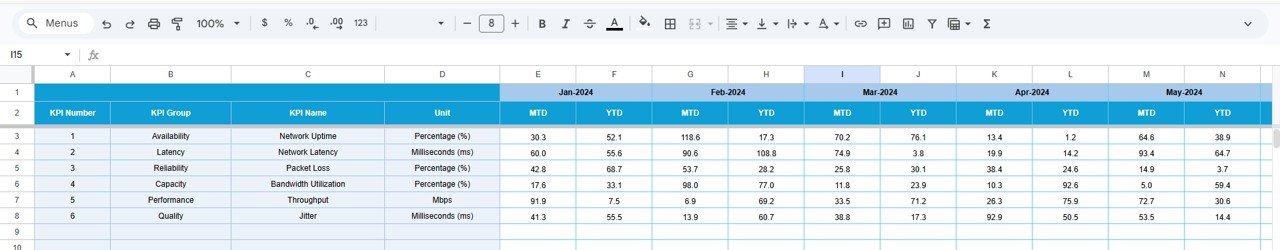
📁 Actual Data Sheet – Input current KPI values including MTD and YTD metrics.
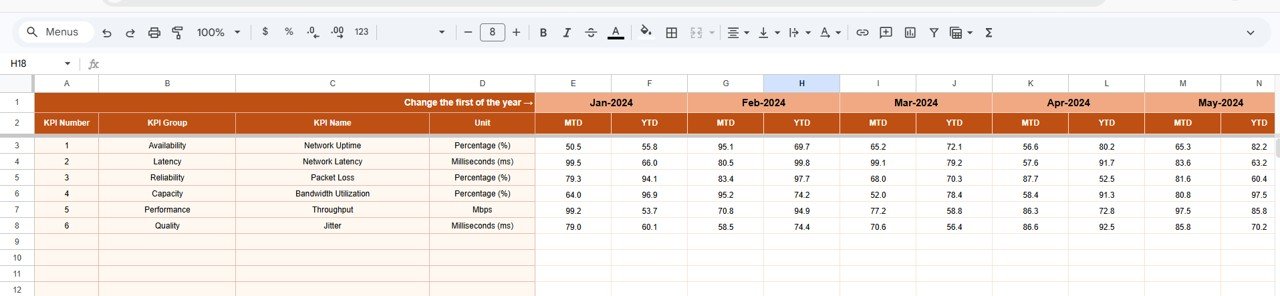
📁 Target Sheet – Define KPI targets for performance benchmarking.
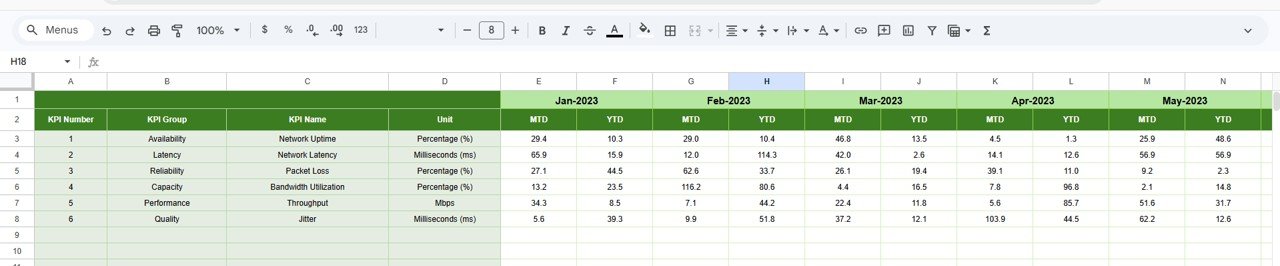
📁 Previous Year Sheet – Compare current performance with historical data.
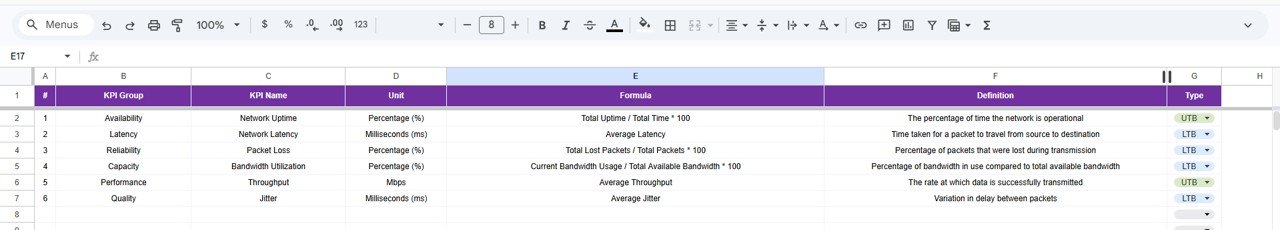
📁 KPI Definition Sheet – Understand KPI formulas, groups, and definitions clearly.
📁 Automated Visuals & Indicators – Conditional formatting with up/down arrows for quick performance insights.
🛠️ How to Use the Network Performance KPI Dashboard in Google Sheets
👉 Step 1: Enter your network KPI data in the Actual Data sheet
👉 Step 2: Define your performance targets in the Target sheet
👉 Step 3: Add previous year data for comparison
👉 Step 4: Select the month from the dropdown in the dashboard
👉 Step 5: Analyze KPIs, trends, and performance insights
💡 No advanced technical skills required—simple, intuitive, and powerful!
👥 Who Can Benefit from This Network Performance KPI Dashboard in Google Sheets
✔️ Network Engineers – Monitor network health and performance metrics
✔️ IT Managers – Track KPIs and improve operational efficiency
✔️ Data Analysts – Analyze trends and generate insights
✔️ Telecom Companies – Manage large-scale network performance
✔️ IT Service Providers – Deliver better service quality and reduce downtime
This dashboard is not just a reporting tool—it’s a complete network performance management solution. It helps you identify issues early, track trends effectively, and ensure smooth network operations.
If you want to reduce downtime, improve monitoring efficiency, and make smarter IT decisions, this dashboard is the perfect choice.


