


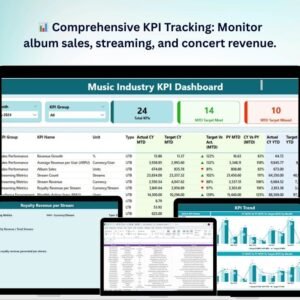
The Music Industry KPI Dashboard in Power BI is an essential tool for music industry professionals, managers, record labels, and artists to track and analyze key performance indicators (KPIs) across various aspects of the music business. Whether you’re monitoring album sales, streaming performance, concert revenues, or social media engagement, this Power BI-based dashboard consolidates all your vital data in one user-friendly interface.
Designed to enhance decision-making, this dashboard provides valuable insights into the success of music releases, marketing efforts, and overall business performance. With real-time data integration and customizable features, you can focus on growing your brand, maximizing profits, and improving your strategies within the ever-evolving music industry.
Key Features of the Music Industry KPI Dashboard in Power BI
📊 Comprehensive Music Industry KPIs
Track critical metrics such as album sales, streaming numbers, revenue from live performances, and social media engagement to gain a holistic view of your music business.
📈 Streaming Platform Performance
Monitor the performance of your music across major streaming platforms like Spotify, Apple Music, and YouTube. Track streams, audience engagement, and revenue generation.
🎤 Concert & Tour Revenue Analysis
Track the performance of live events, concerts, and tours. Analyze ticket sales, merchandise revenue, and overall profitability from live performances.
📅 Marketing Campaign Effectiveness
Evaluate the success of your marketing campaigns by tracking metrics like social media engagement, paid ads performance, and audience reach. This helps you refine your strategies and increase engagement.
💡 Fan Engagement & Social Media Analytics
Analyze fan engagement on social media platforms like Instagram, Twitter, and Facebook. Track likes, shares, comments, and growth in followers to gauge brand success.
⚙️ Customizable Dashboard for Unique Needs
Customize the dashboard to reflect the specific KPIs relevant to your music business. Add unique metrics and tailor the visuals to match your business goals and objectives.
Why You’ll Love the Music Industry KPI Dashboard in Power BI

✅ Comprehensive Insights at Your Fingertips
Track everything from streaming performance to live event success and social media growth, all in one place. This centralized view helps you make informed decisions that drive your business forward.
✅ Real-Time Data Integration
Integrate real-time data from multiple sources, including streaming platforms, social media, and ticket sales systems, for accurate and up-to-date performance tracking.
✅ Optimize Marketing Strategies
Track the effectiveness of your marketing campaigns and promotional efforts. Use data-driven insights to adjust your strategies and maximize reach and engagement.
✅ Increase Revenue with Performance Insights
Identify which revenue streams (streaming, live events, merchandise) are most profitable, helping you allocate resources efficiently and boost earnings.
✅ Customizable & Scalable
The dashboard is fully customizable, enabling you to add any specific KPIs or metrics unique to your music business. Whether you’re an independent artist or part of a large record label, the dashboard scales to meet your needs.
What’s Inside the Music Industry KPI Dashboard in Power BI?
-
Comprehensive Music Industry KPIs: Track album sales, streaming numbers, and concert revenues.
-
Streaming Platform Performance: Monitor performance across Spotify, YouTube, Apple Music, and more.
-
Concert & Tour Revenue: Track revenue from live events, ticket sales, and merchandise.
-
Marketing Campaign Effectiveness: Evaluate the success of promotional campaigns.
-
Fan Engagement & Social Media Analytics: Measure social media engagement and growth.
-
Customizable Features: Tailor the dashboard to track your business’s specific KPIs.
How to Use the Music Industry KPI Dashboard in Power BI
1️⃣ Download the Template: Access the Music Industry KPI Dashboard in Power BI instantly.
2️⃣ Integrate Data Sources: Connect your streaming platforms, ticketing systems, and social media accounts to the dashboard.
3️⃣ Track Key Performance Metrics: Monitor album sales, streaming data, concert revenue, and social media engagement.
4️⃣ Analyze Marketing Campaigns: Track the effectiveness of marketing efforts and refine strategies.
5️⃣ Make Data-Driven Decisions: Use the insights from the dashboard to improve your music business performance and grow your brand.
Who Can Benefit from the Music Industry KPI Dashboard in Power BI?
🔹 Independent Artists & Musicians
🔹 Record Labels & Music Managers
🔹 Concert Promoters & Event Organizers
🔹 Music Industry Executives & Analysts
🔹 Social Media & Marketing Teams
🔹 Music Distributors & Streaming Platforms
🔹 Music Investors & Stakeholders
Optimize your music business with the Music Industry KPI Dashboard in Power BI. Track and analyze critical performance metrics, from album sales to concert revenue, and improve your marketing strategies with real-time insights.
Click here to read the Detailed blog post
Visit our YouTube channel to learn step-by-step video tutorials
Youtube.com/@PKAnExcelExpert


Reviews
There are no reviews yet.