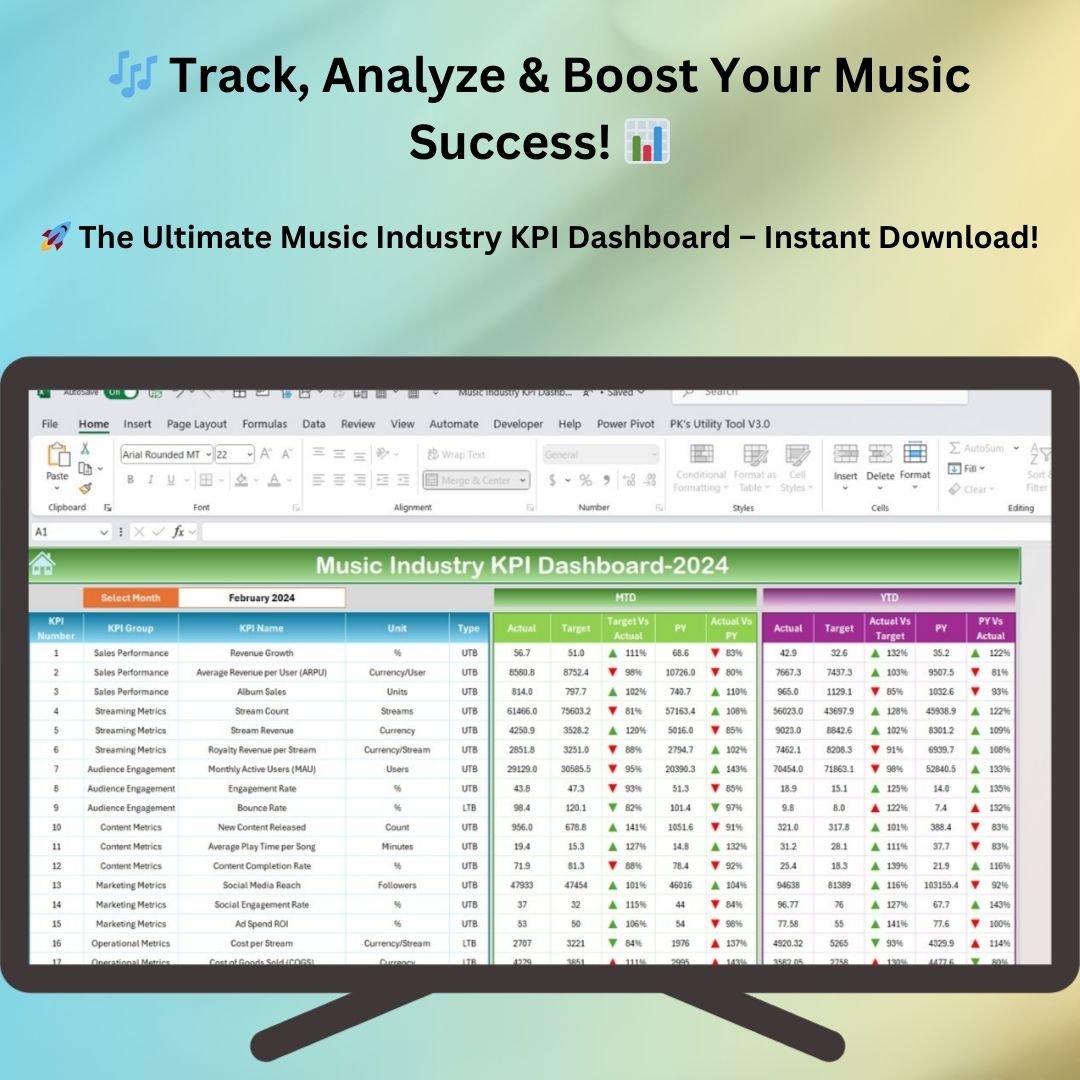

Managing key performance indicators (KPIs) in the music industry has never been easier! Our Music Industry KPI Dashboard in Excel provides an intuitive, structured, and highly visual way to track essential metrics such as streaming revenue, album sales, audience engagement, social media growth, and more. With seven dedicated sheets, this dashboard ensures seamless monitoring, data entry, and performance analysis for musicians, record labels, and music industry professionals.
Key Features of the Music Industry KPI Dashboard
This Excel-based KPI Dashboard is designed for professionals who need real-time data insights in the music business. It features:
✅ Easy-to-Navigate Interface – Move between sheets using a structured home page with quick access buttons. ✅ Automated Calculations – No manual computation needed; formulas update automatically based on input data. ✅ MTD & YTD Metrics – View Month-to-Date (MTD) and Year-to-Date (YTD) statistics instantly. ✅ Trend Analysis – Monitor the movement of critical KPIs over time with dynamic charts. ✅ Data Input Flexibility – Quickly update monthly actuals, targets, and past performance for comparison. ✅ Conditional Formatting – Color-coded indicators and arrows help in spotting trends, growth, and decline.
Detailed Breakdown of Dashboard Components
1. Home Sheet
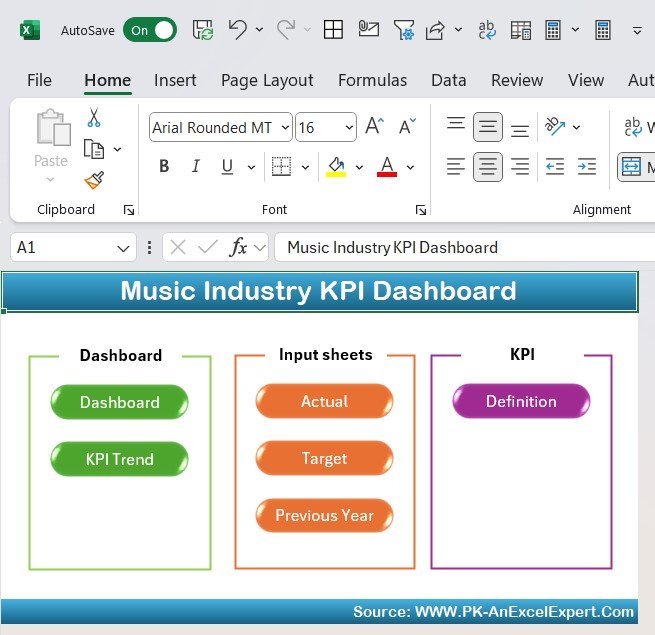
The Home Sheet acts as the central hub of your KPI dashboard, allowing users to navigate between different sections efficiently. It contains:
- Navigation Buttons – Instantly jump to different sheets with a single click.
- Quick Overview – A summary of the available KPIs to help you stay focused on key metrics.
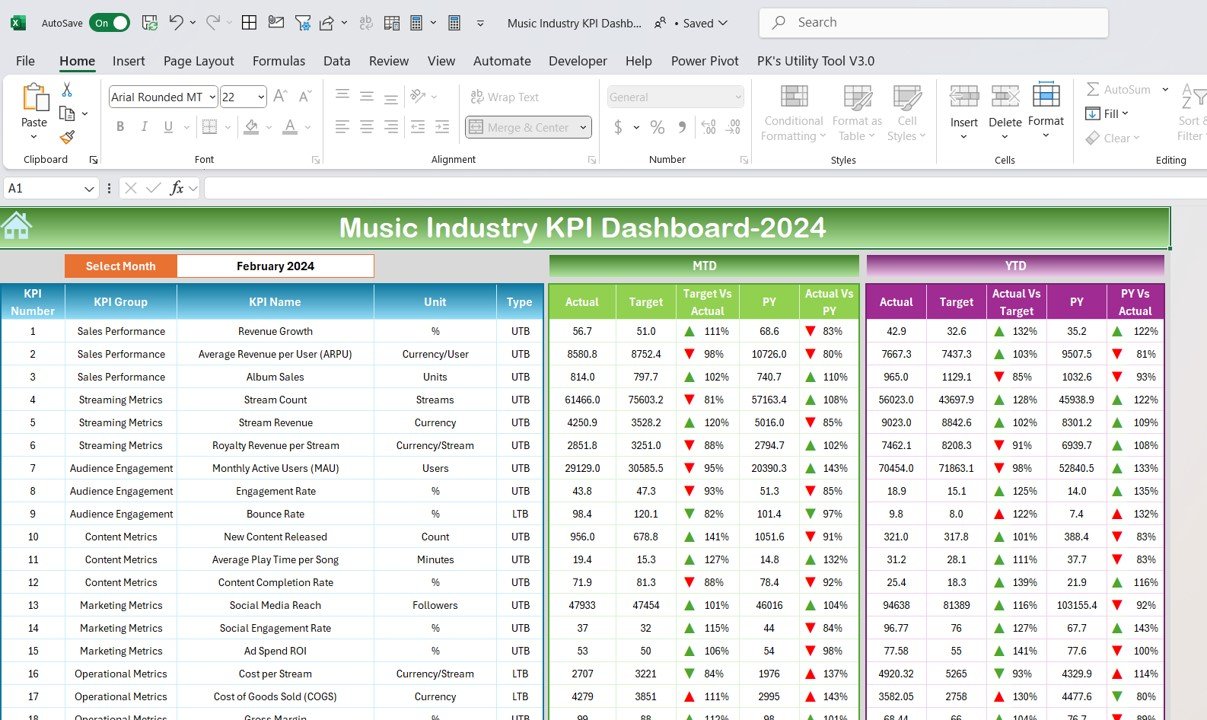
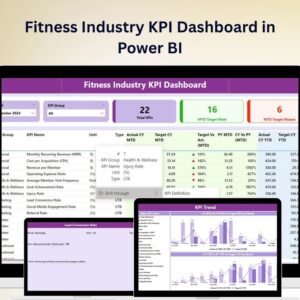
2. Dashboard Sheet
The Dashboard Sheet is the heart of this template, offering a comprehensive view of the music industry KPIs. It allows users to:
- Select a Month (Dropdown in Cell D3) – Instantly filter data to see the latest performance updates.
- View MTD & YTD Performance – Compare actual performance against targets and track growth.
- Analyze Previous Year (PY) Comparisons – Understand year-over-year changes in revenue, engagement, and sales.
- Visual Cues – Up/down arrows and color-coded formatting instantly highlight areas that need attention.
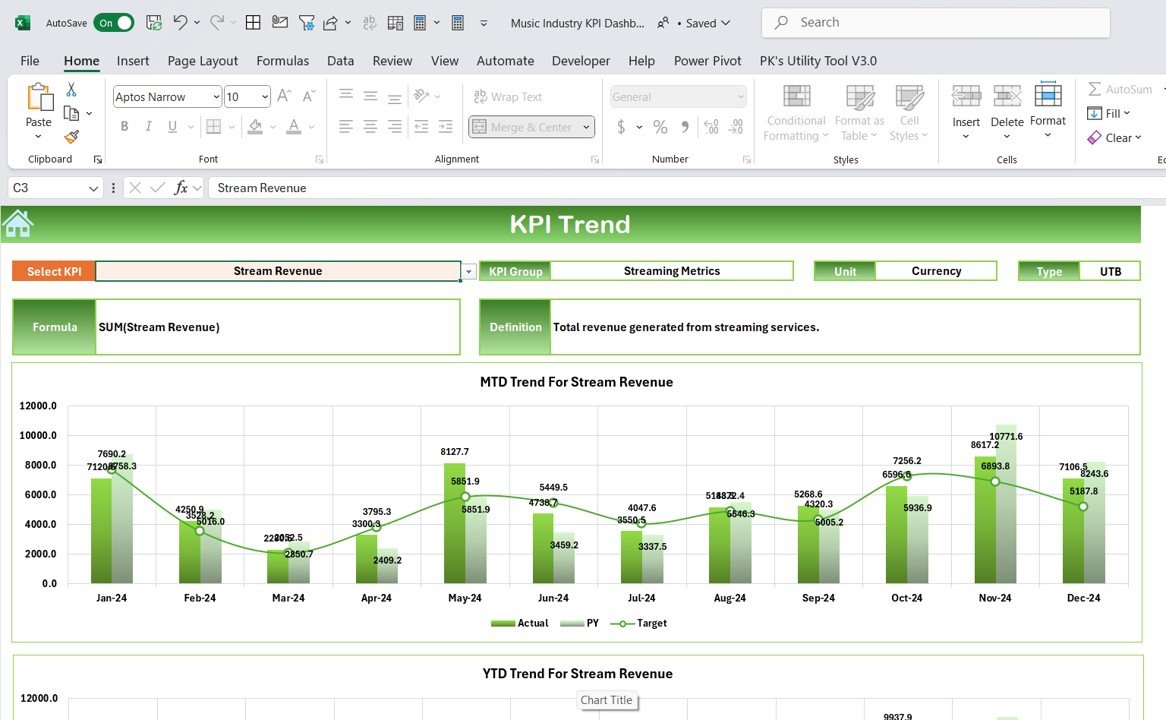
3. KPI Trend Sheet
This sheet provides a graphical representation of KPI trends over time. Users can:
- Select Any KPI from the Dropdown (Cell C3) – Customize data analysis based on selected metrics.
- View KPI Details – See KPI Group, Unit Type (Upper or Lower Focus), and Definitions.
- Analyze Trends Using Charts – Compare MTD and YTD actual values against targets and previous year data.
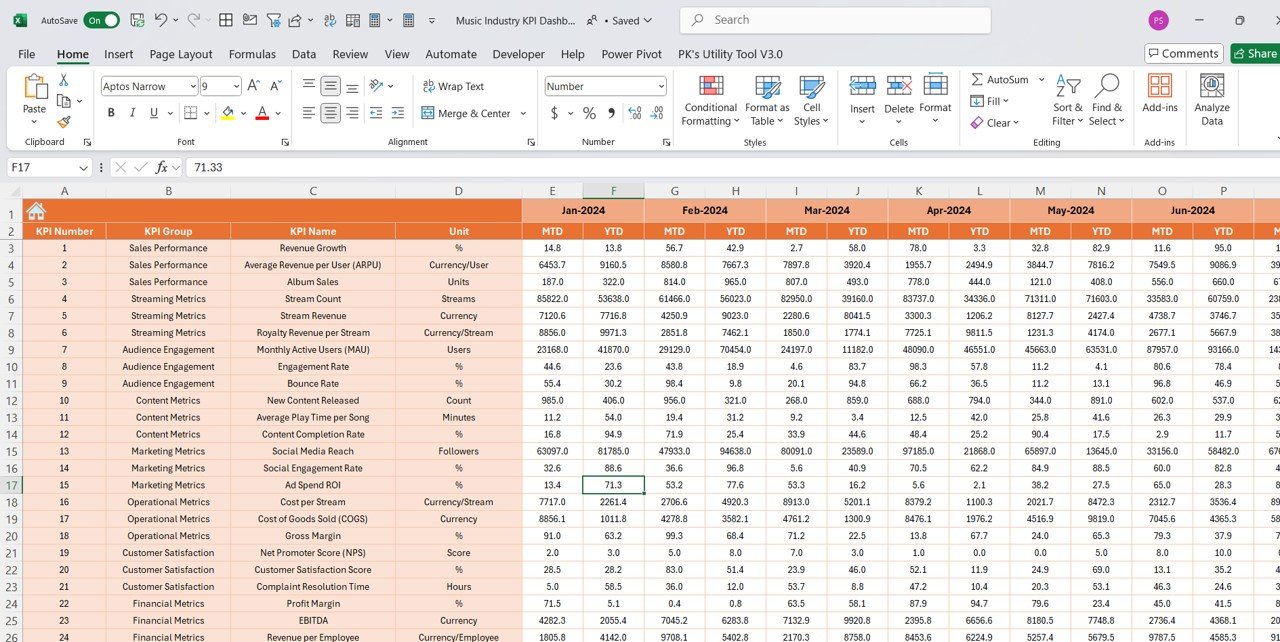
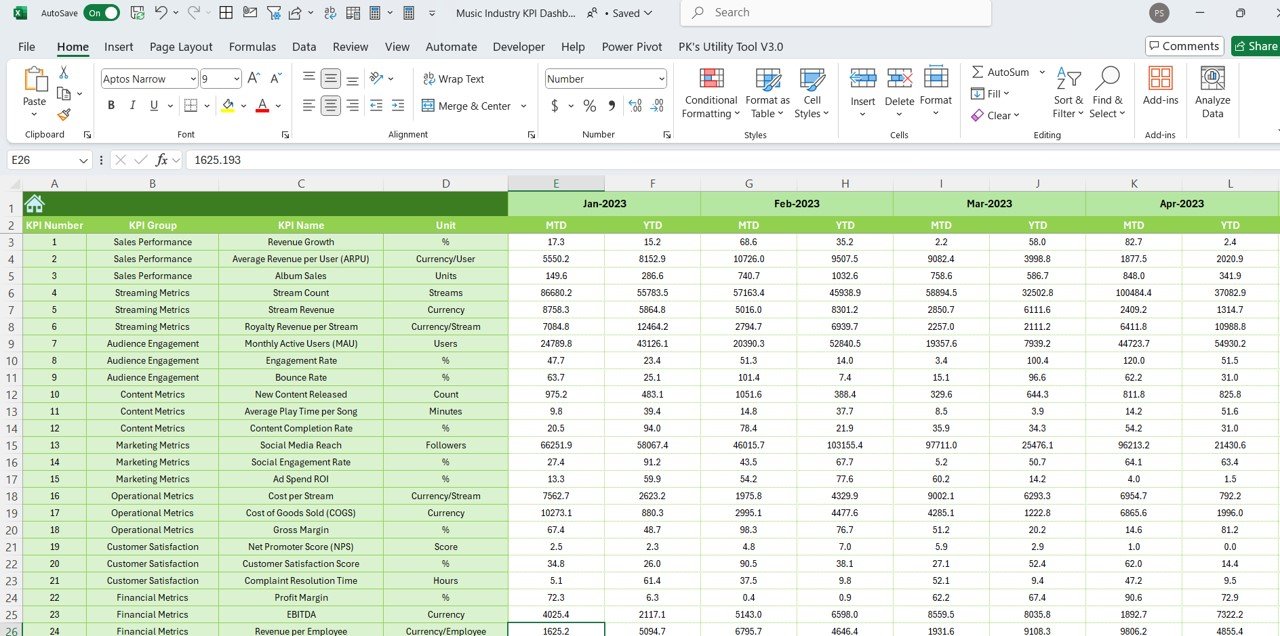
4. Actual Numbers Input Sheet
This is where users input real-time data to keep the dashboard updated. Key features include:
- MTD and YTD Input Fields – Enter monthly actuals to keep reports up to date.
- Year Start Month Selection (Cell E1) – Define the start of the financial year for accurate reporting.
- Consistent Data Entry – Ensures all reports pull from a centralized dataset.
5. Target Sheet
This tab helps set performance benchmarks for the music business. It enables users to:
- Define Monthly (MTD) & Yearly (YTD) Goals – Keep track of progress against set goals.
- Compare Targets vs. Actual Performance – Helps identify areas that need improvement.
- Maintain Strategic Alignment – Ensures KPI goals are aligned with business objectives.
6. Previous Year Numbers Sheet
Historical data is crucial for analyzing industry trends and making data-driven decisions. This sheet allows you to:
- Store Last Year’s KPI Values – Track changes over time and assess performance growth.
- Use Data for Benchmarking – Compare previous trends to identify best practices.
- Improve Forecasting – Helps in estimating future performance based on historical trends.
7. KPI Definition Sheet
Understanding each KPI is key to making informed decisions in the music industry. This sheet provides:
- KPI Descriptions – Clear definitions of each metric used in the dashboard.
- Calculation Formulas – Standardized formulas for consistency in reporting.
- Data Interpretation Guide – Explains how to analyze and act on KPI trends.
Who Can Benefit from This Dashboard?
This Music Industry KPI Dashboard is designed for: 🎵 Music Producers & Labels – Track streaming revenue, album sales, and artist performance. 🎤 Independent Artists & Managers – Monitor fan engagement, social media growth, and tour success. 📊 Marketing & Promotion Teams – Analyze digital marketing KPIs and ad campaign success rates. 🎶 Event Organizers & Promoters – Evaluate ticket sales, audience retention, and regional performance.
Why Choose This KPI Dashboard?
✅ Excel-Based & Easy to Use – No complicated software required. ✅ Customizable – Modify KPIs to fit your specific needs. ✅ Professional Reporting – Generate high-quality reports and presentations. ✅ Instant Download – Get started immediately after purchase!
Click hare to read the Detailed blog post
Visit our YouTube channel to learn step-by-step video tutorials


Reviews
There are no reviews yet.