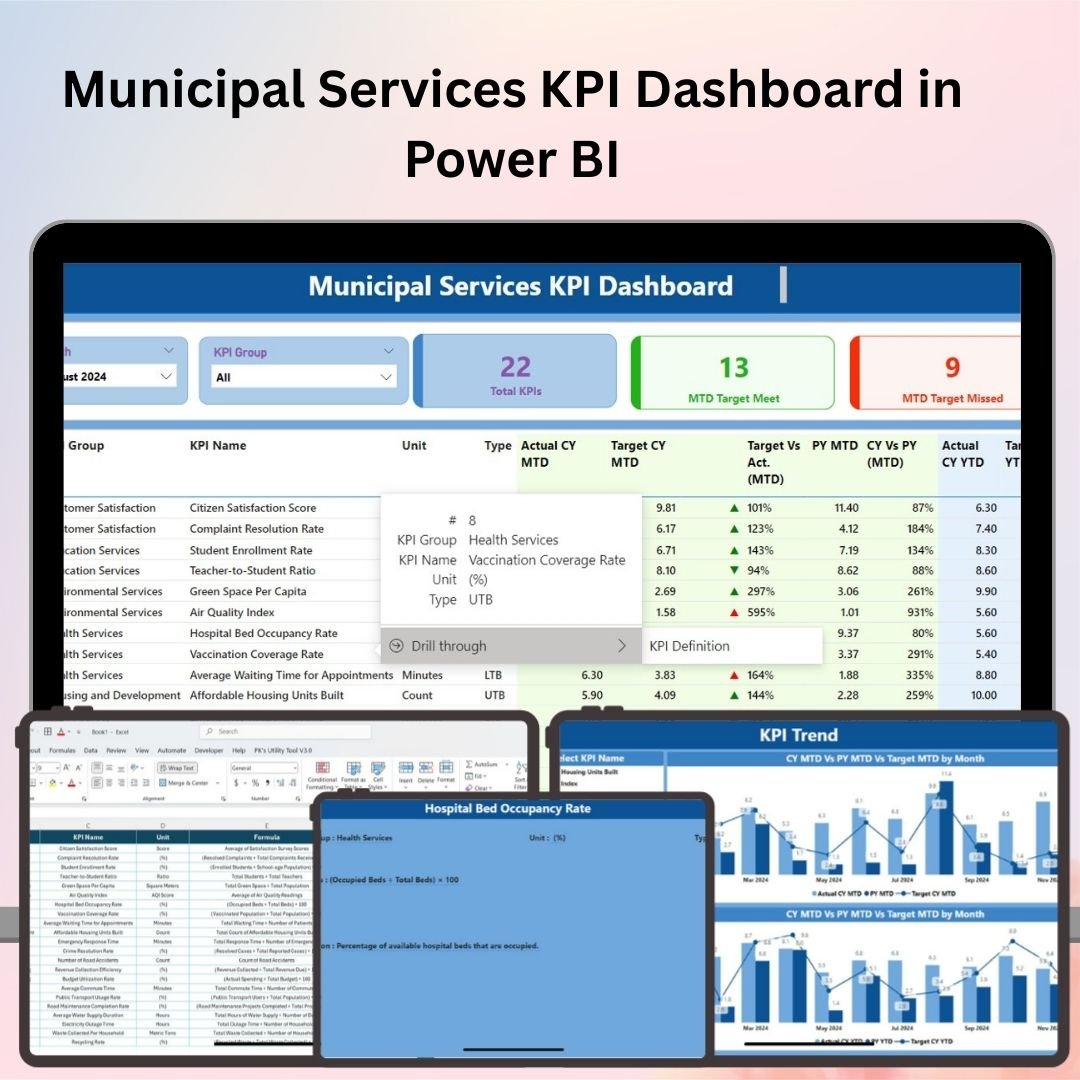
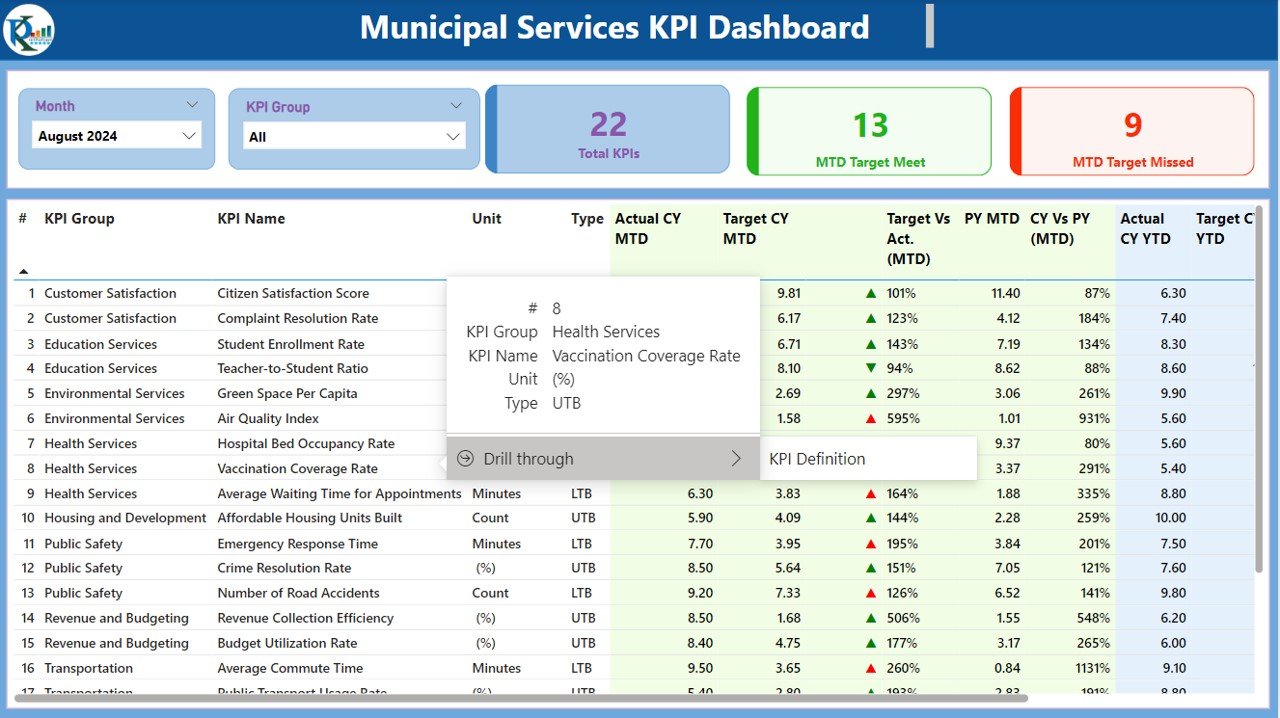
The Municipal Services KPI Dashboard in Power BI is an advanced and comprehensive tool designed for municipal managers, city planners, and local government officials to monitor and optimize the performance of various municipal services. This Power BI-based dashboard enables users to track key performance indicators (KPIs) related to waste management, water and sanitation, public health, transportation, and other essential public services.
With interactive visualizations, real-time tracking, and customizable reports, this dashboard helps local governments optimize service delivery, improve resource allocation, and make data-driven decisions that enhance the quality of life for their citizens.

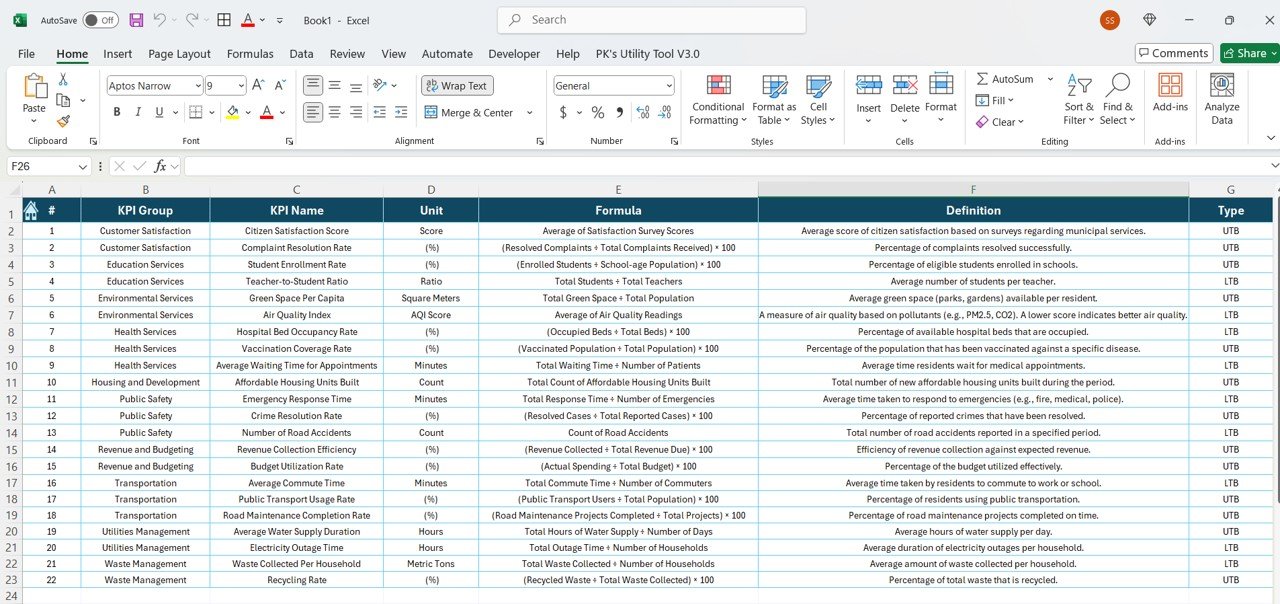
Key Features of the Municipal Services KPI Dashboard in Power BI:
🚮 Waste Management Performance
Track waste collection efficiency, recycling rates, and landfill usage to optimize waste management operations and reduce environmental impact.
💧 Water and Sanitation Monitoring
Monitor water usage, distribution efficiency, and sanitation services to ensure the public has access to clean water and waste management systems.
🚦 Transportation and Traffic Management
Track public transportation performance, road maintenance schedules, traffic congestion, and accident statistics to improve city-wide mobility and infrastructure.
🏥 Public Health and Safety
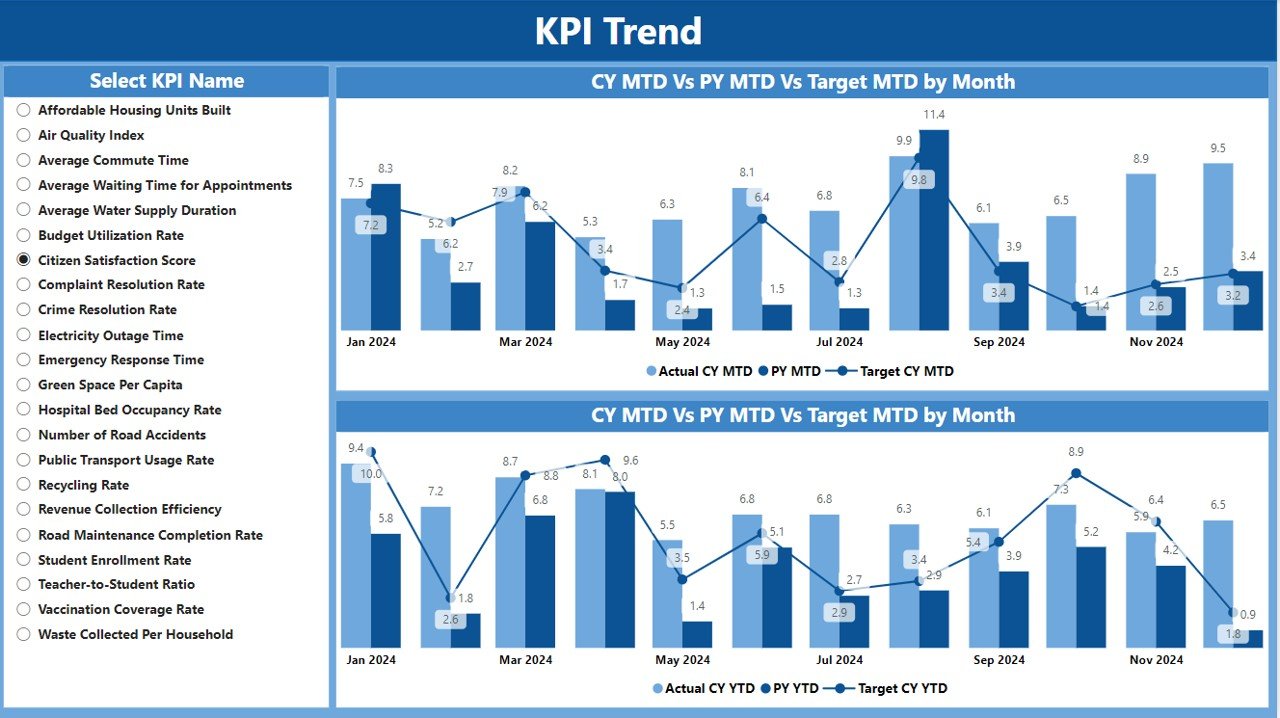
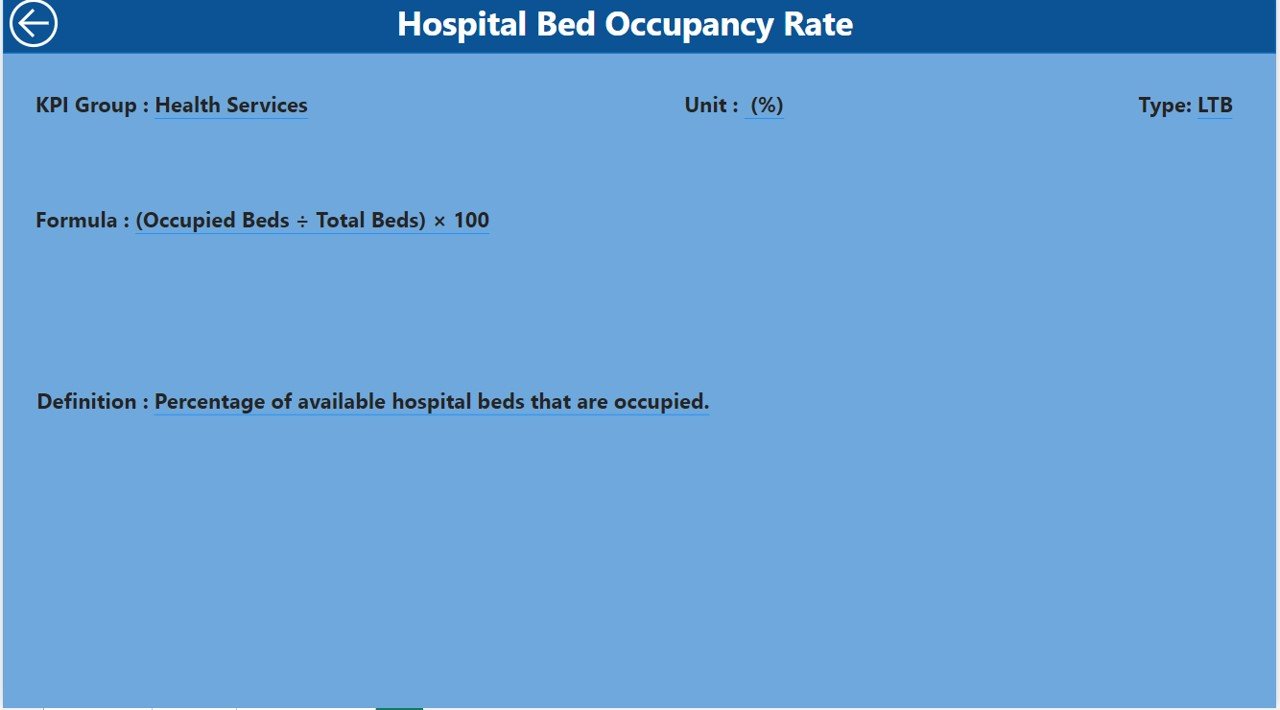
Monitor public health metrics, such as vaccination rates, hospital bed occupancy, and emergency services response times to ensure the health and safety of the community.
📊 Service Cost and Resource Allocation
Analyze the cost of municipal services and the allocation of resources to identify inefficiencies and ensure that budgets are optimized for maximum service delivery.
🚀 Why You’ll Love the Municipal Services KPI Dashboard in Power BI:
✅ Track Key Municipal KPIs – Monitor vital services such as waste management, water usage, transportation, and public health to ensure optimal city operations.
✅ Make Data-Driven Decisions – Use real-time data to make informed decisions that optimize resource allocation, improve service delivery, and meet citizen needs.
✅ Improve Service Efficiency – Identify inefficiencies in municipal services such as waste collection, water distribution, and traffic management, helping you implement improvements.
✅ Enhance Public Safety and Health – Track health and safety metrics, including emergency services performance, ensuring that your community remains safe and healthy.
✅ Fully Customizable and Interactive – Fully customizable to meet your municipality’s specific needs, with interactive dashboards and visualizations for seamless data analysis.
✅ Comprehensive Reporting – Generate detailed reports that summarize key metrics and trends, helping you keep stakeholders informed and optimize your municipal operations.
What’s Inside the Municipal Services KPI Dashboard in Power BI:
-
Waste Management: Track waste collection, recycling rates, landfill usage, and overall waste management performance to reduce environmental impact and optimize operations.
-
Water and Sanitation: Monitor water distribution, consumption rates, and sanitation performance to ensure adequate water supply and waste treatment.
-
Transportation and Traffic: Track public transportation efficiency, road maintenance schedules, traffic congestion, and accident statistics to enhance mobility and infrastructure.
-
Public Health: Monitor healthcare services, including vaccination rates, hospital capacity, and emergency services response times to improve public health outcomes.
-
Service Costs and Resources: Analyze the cost of municipal services and resource allocation to optimize budget usage and reduce inefficiencies.
-
Custom Reports: Generate customized reports to provide city officials with insights into municipal service performance, helping improve decision-making.
How to Use the Municipal Services KPI Dashboard in Power BI:
1️⃣ Download the Template – Instantly access your Power BI template upon purchase.
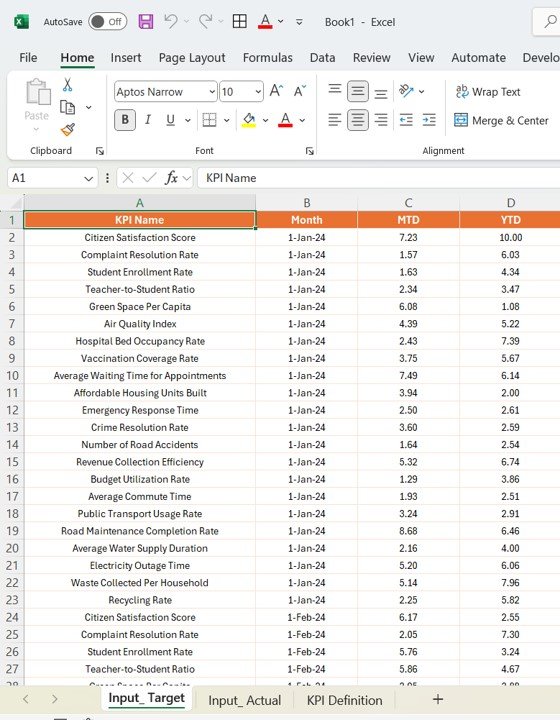
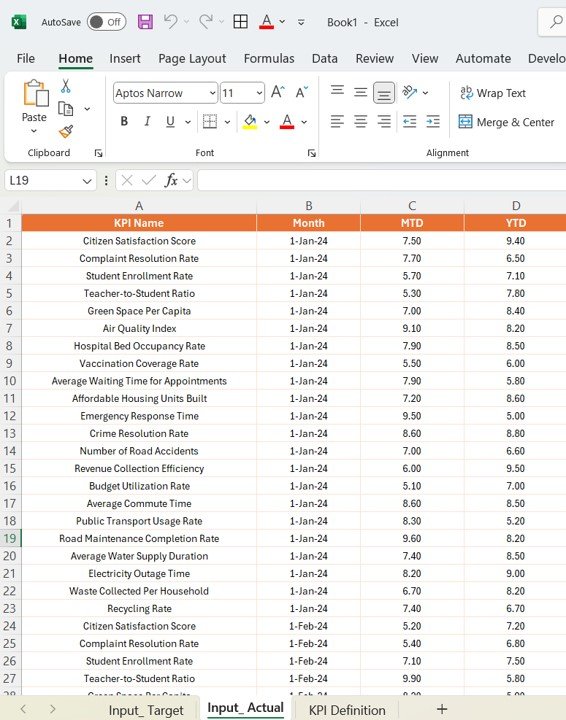
2️⃣ Input Municipal Data – Enter data related to waste management, water services, transportation, and public health to begin tracking key performance metrics.
3️⃣ Monitor KPIs – Use the interactive dashboard to monitor services like waste management, transportation, water usage, and health performance in real-time.
4️⃣ Analyze Trends – Identify patterns and trends in municipal services to ensure optimal resource allocation and improve city operations.
5️⃣ Generate Reports – Create detailed and customized reports summarizing key performance indicators, helping city managers make data-driven decisions.
Who Can Benefit from the Municipal Services KPI Dashboard in Power BI:
-
Municipal Managers
-
City Planners
-
Local Government Officials
-
Public Health Administrators
-
Waste Management Teams
-
Transportation and Traffic Managers
-
Budget and Resource Allocation Teams
-
Large Cities and Townships
-
Government and Public Sector Agencies
The Municipal Services KPI Dashboard in Power BI is the perfect tool for managing and optimizing the delivery of public services in cities and municipalities. With real-time tracking, interactive reporting, and data-driven insights, this dashboard ensures that your services meet the needs of your community while remaining efficient and cost-effective.
Click here to read the Detailed blog post
https://www.pk-anexcelexpert.com/municipal-services-kpi-dashboard-in-power-bi/
Visit our YouTube channel to learn step-by-step video tutorials
Youtube.com/@PKAnExcelExpert


Reviews
There are no reviews yet.