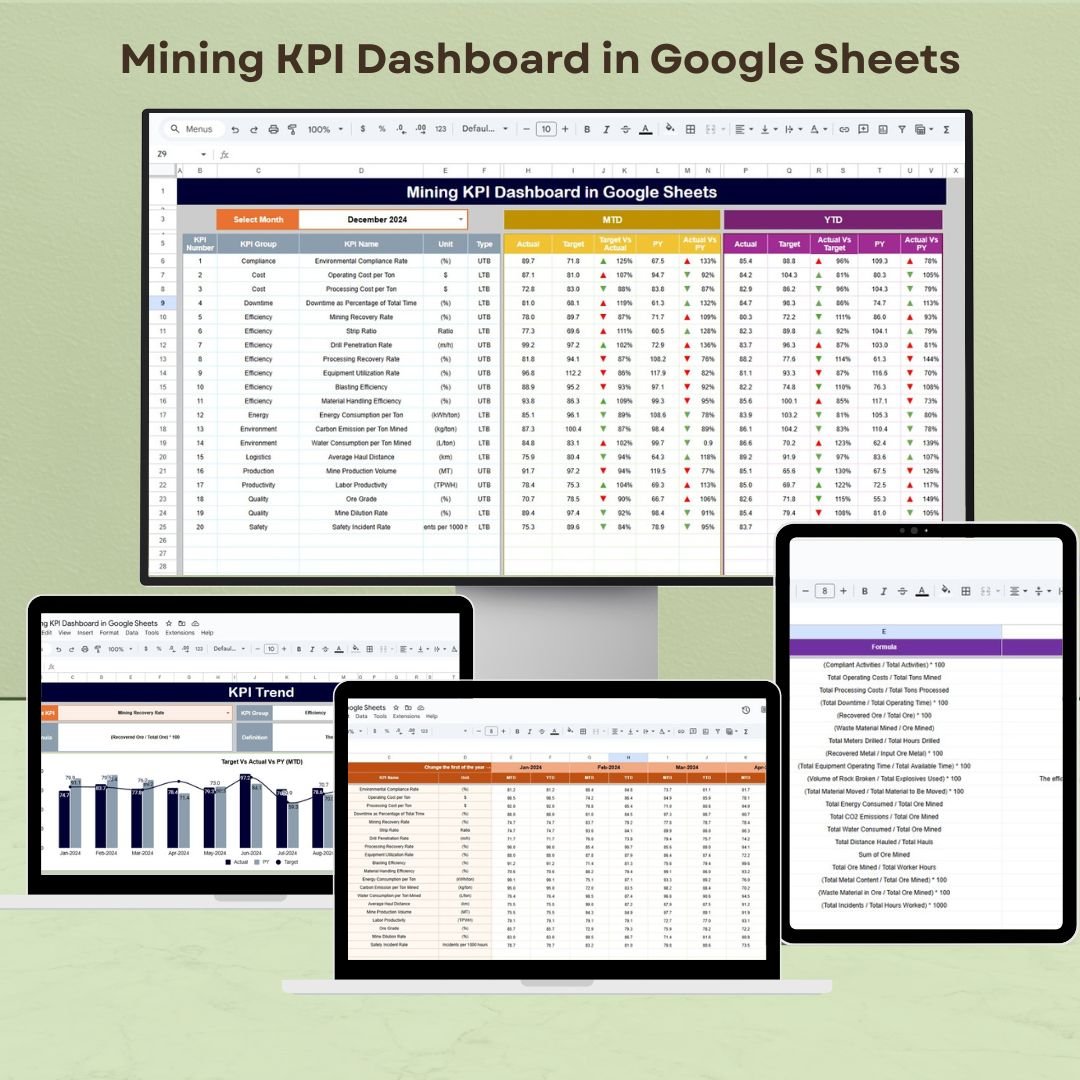


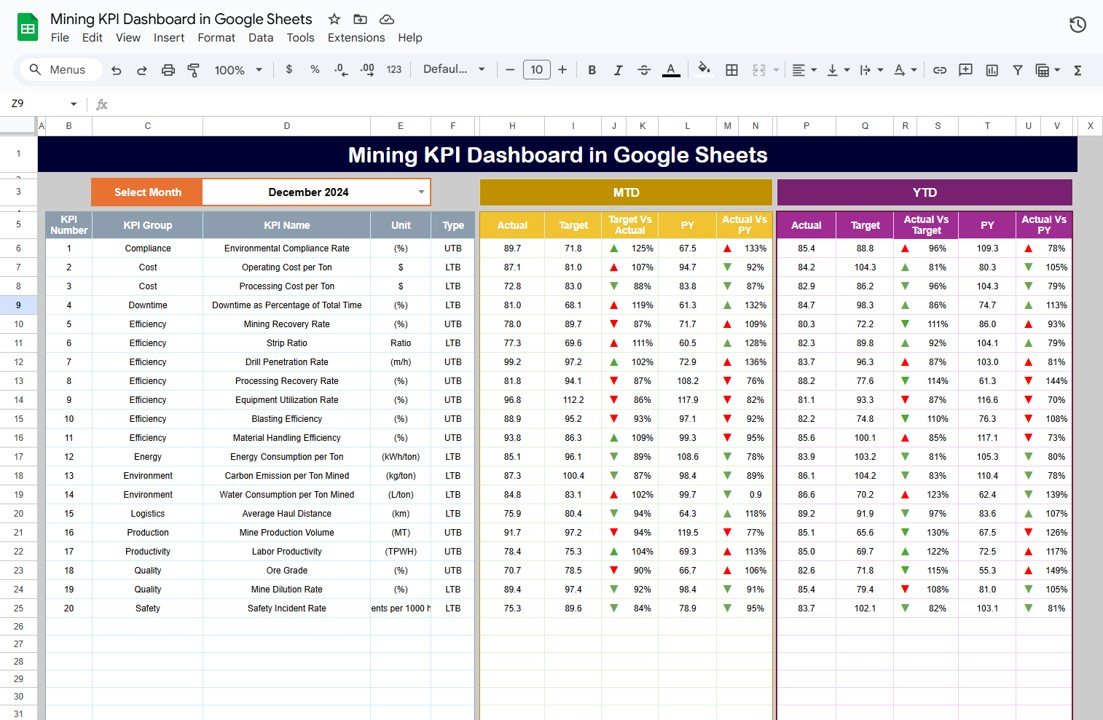
The Mining KPI Dashboard in Google Sheets is a powerful tool designed to help mining professionals monitor, analyze, and optimize key performance indicators (KPIs) within their operations. This dashboard consolidates vital metrics such as production output, equipment efficiency, safety compliance, and operational costs, providing a clear overview of mining activities.
By using this Google Sheets-based dashboard, mining teams can make informed, data-driven decisions to enhance productivity, reduce operational costs, and ensure safety and compliance across all mining operations.
Key Features of the Mining KPI Dashboard in Google Sheets
📊 Comprehensive KPI Tracking
-
Monitor Essential Metrics: Track important KPIs such as ore extraction rates, processing yields, equipment utilization, downtime, and safety incident rates.
-
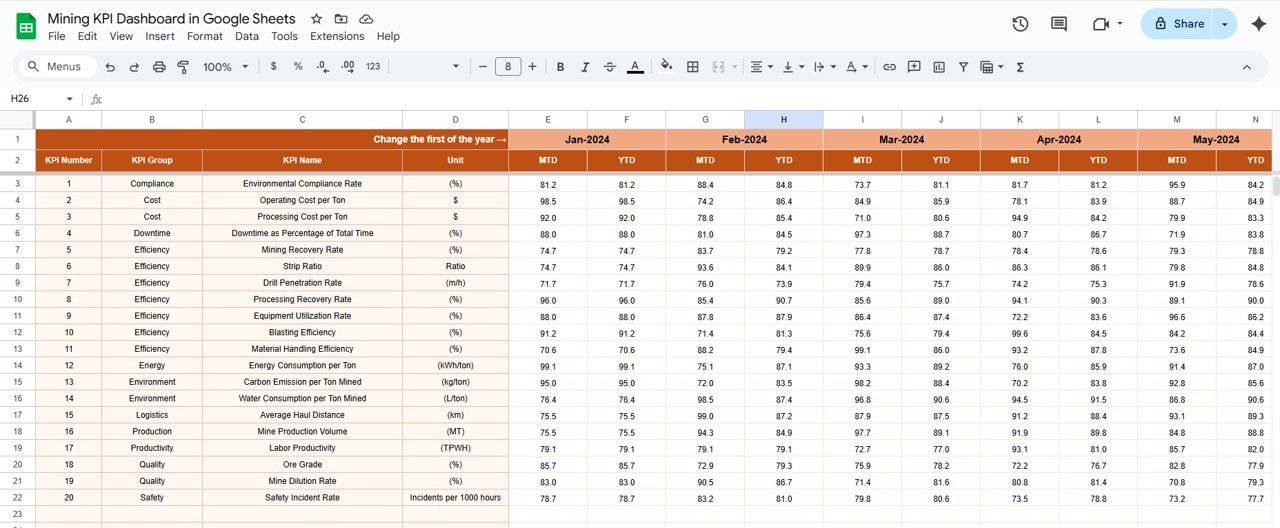
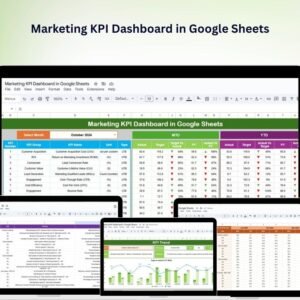
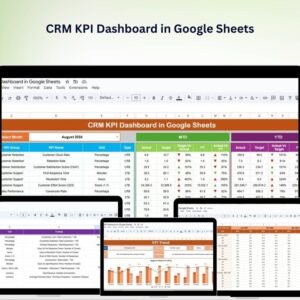
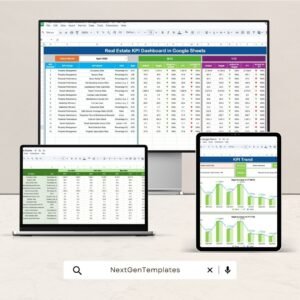
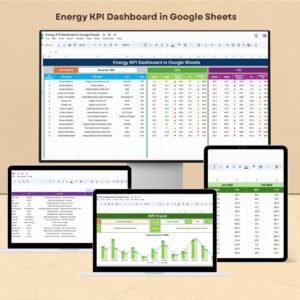
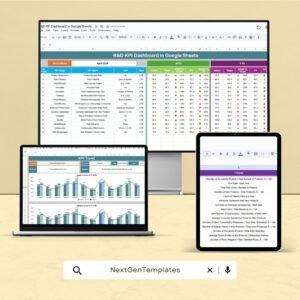
Visualize Data: Use dynamic charts and graphs to visualize trends and performance over time, providing quick insights into operational efficiency.
📈 Customizable Inputs
-
Tailored to Your Operations: Easily input actual, target, and historical data to ensure your reporting stays accurate and relevant to your specific mining operations.
-
Data Integration: Import data from operational systems to keep the dashboard updated with real-time information.
🔧 User-Friendly Interface
-
Easy to Use: The dashboard is designed to be intuitive, making it accessible to all team members, even those with limited experience in Google Sheets.
-
Flexible Layout: Adjust the dashboard to suit your specific reporting needs and modify KPIs as required.
📅 Performance Monitoring & Reporting
-
MTD & YTD Tracking: Monitor Month-to-Date (MTD) and Year-to-Date (YTD) performance to compare results over different periods.
-
Target vs. Actual Comparison: Track and compare actual performance against predefined targets to ensure your mining operations meet objectives.
Benefits of Using the Mining KPI Dashboard in Google Sheets
✅ Informed Decision-Making
Access real-time data that enables quick, informed decisions to optimize mining operations and improve performance.
✅ Improved Efficiency
Identify inefficiencies in equipment use or processing, and take corrective actions to improve productivity and reduce costs.
✅ Increased Accountability
Transparent tracking of KPIs helps foster accountability across teams, ensuring that performance standards are met consistently.
✅ Streamlined Reporting
Automate data collection and reporting with visualizations, saving time and ensuring consistency in tracking mining performance.
Getting Started with Your Mining KPI Dashboard in Google Sheets
-
Download the Template: Begin by downloading the Mining KPI Dashboard template to customize it for your mining operations.
-
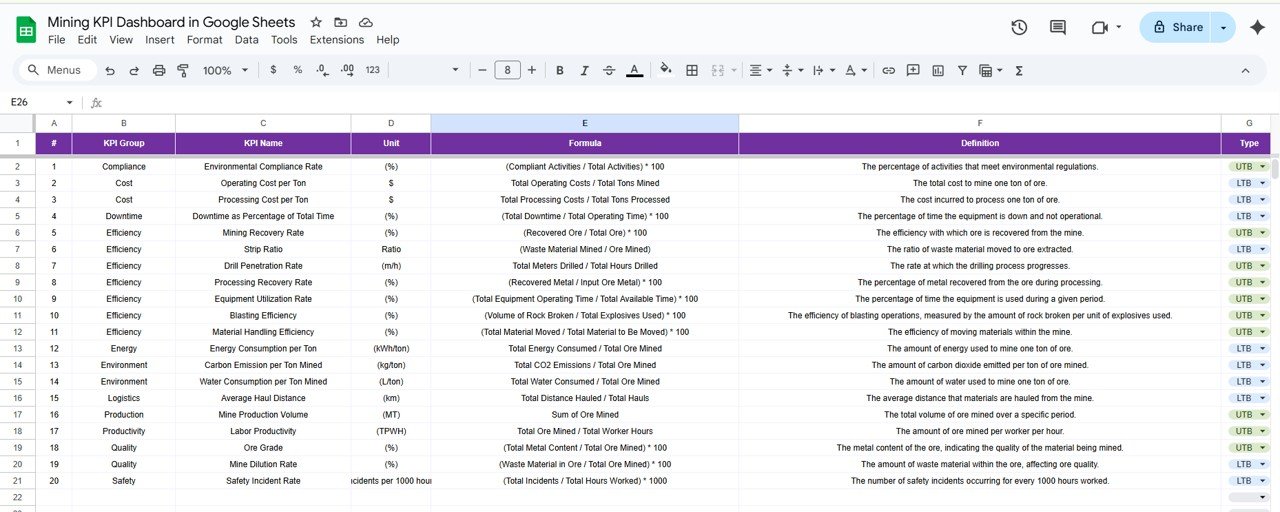
Set Up Your KPIs: Define the KPIs that are most relevant to your mining operations, such as production rates, equipment efficiency, and downtime.
-
Integrate Data: Import data from mining systems to keep the dashboard updated with real-time metrics.
-
Track & Analyze: Use the dashboard to monitor trends, track performance, and make data-driven decisions to optimize operations.
-
Share Insights: Distribute the dashboard to stakeholders to improve transparency and foster collaboration.
By utilizing the Mining KPI Dashboard in Google Sheets, your team can optimize mining operations, improve efficiency, and ensure compliance and safety standards are met across all activities.
Click here to read the Detailed blog post
Mining KPI Dashboard in Google Sheets
Visit our YouTube channel to learn step-by-step video tutorials
YouTube.com/@NeotechNavigators


Reviews
There are no reviews yet.