Managing Mental Health Services KPI Dashboard goes beyond dedication—it requires data-driven insights to ensure patients receive the best possible care. From tracking patient outcomes to monitoring therapy completion rates, healthcare leaders face the challenge of making informed decisions in a timely manner. Without a structured system, monitoring becomes inconsistent, decisions are delayed, and service quality can decline.
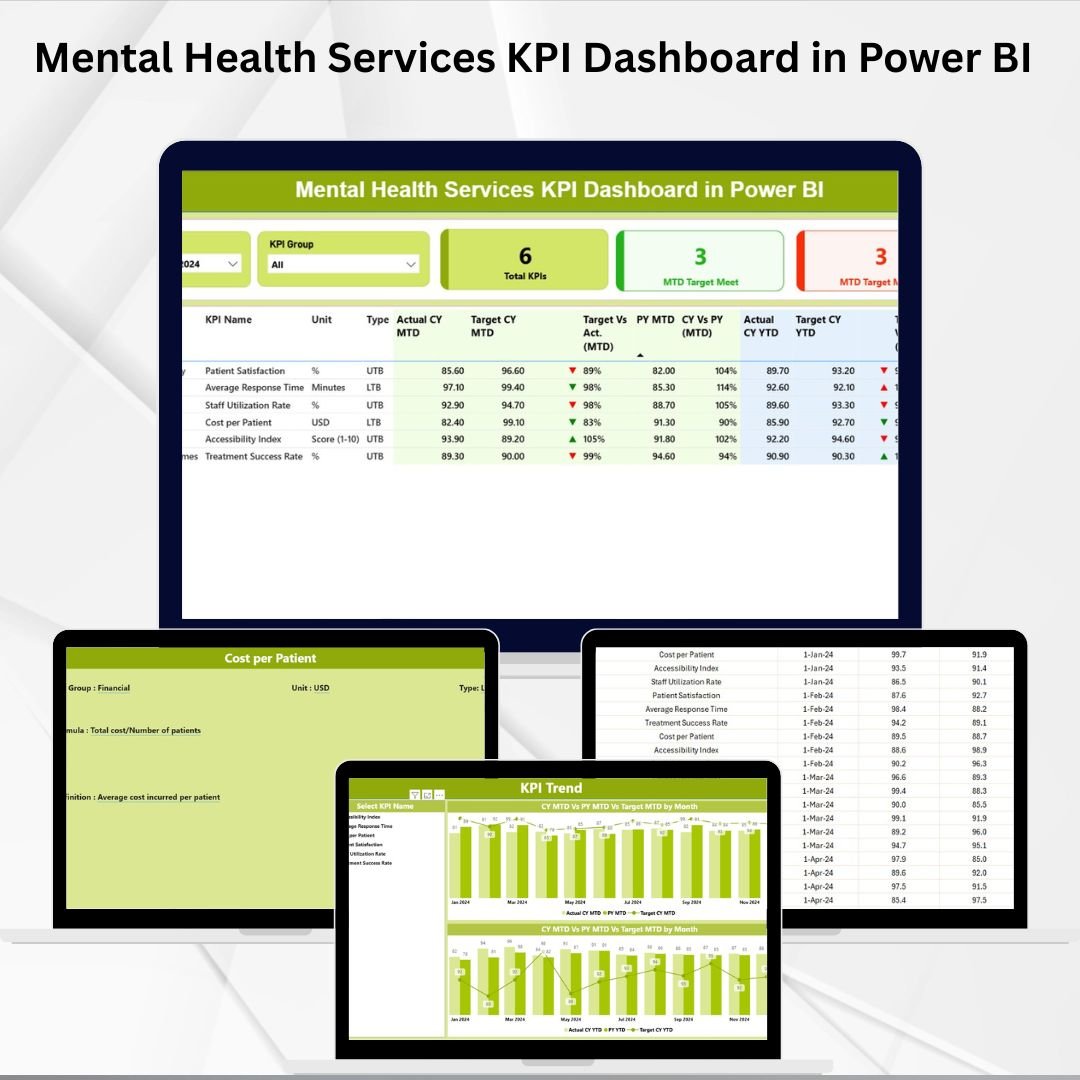
The Mental Health Services KPI Dashboard in Power BI is designed to solve these challenges. This ready-to-use analytics solution transforms raw data into meaningful insights through interactive visuals, trend analysis, and real-time reporting. With it, healthcare providers, clinics, and NGOs can track performance, identify gaps, and improve service delivery seamlessly.
✨ Key Features of Mental Health Services KPI Dashboard in Power BI
-
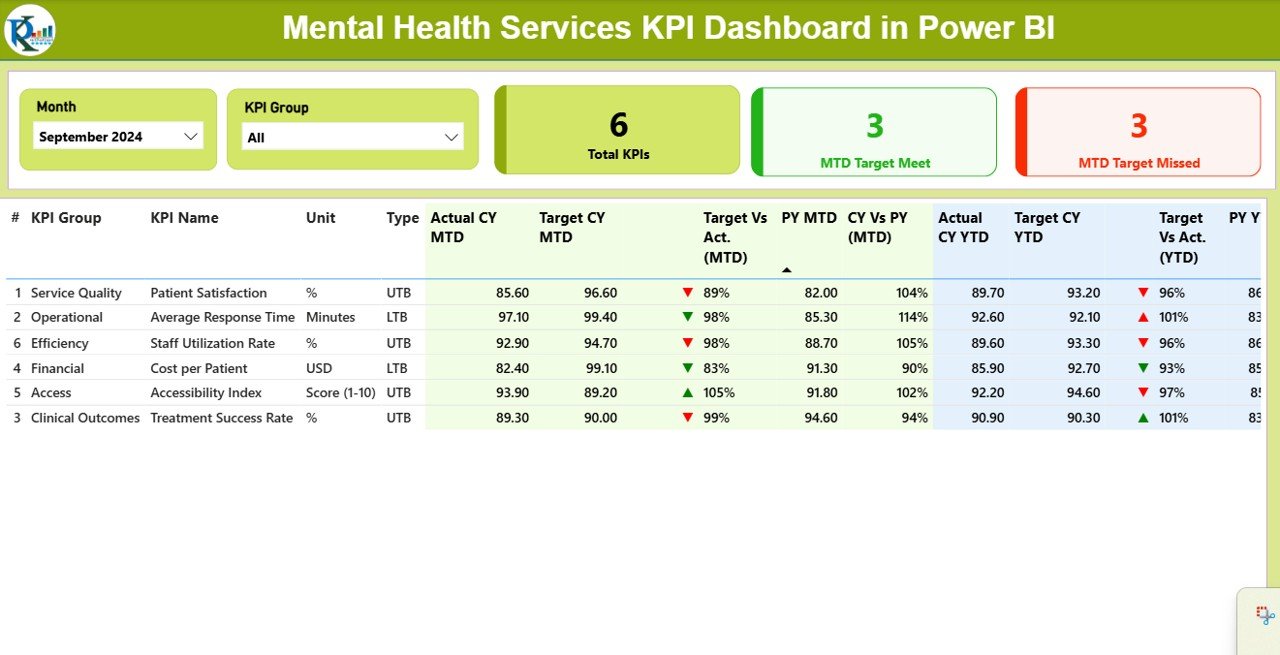
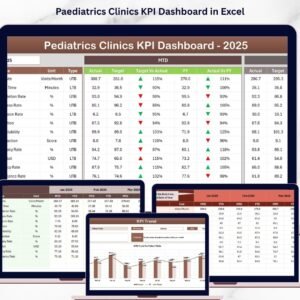
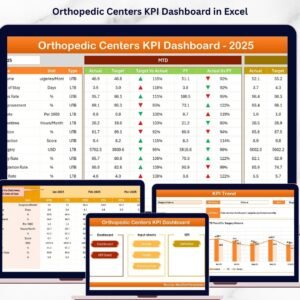
📊 Summary Page – Get a snapshot of total KPIs, MTD/YTD targets, actuals, and red/green performance icons for quick evaluation.
-
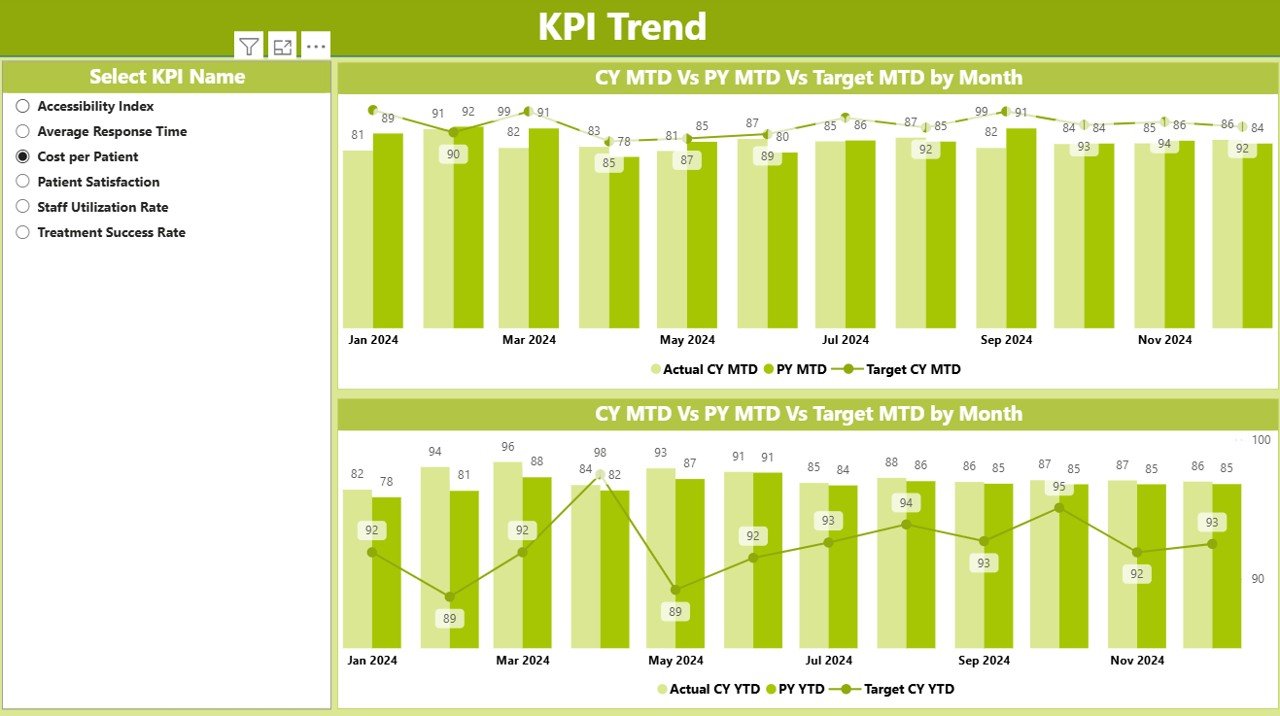
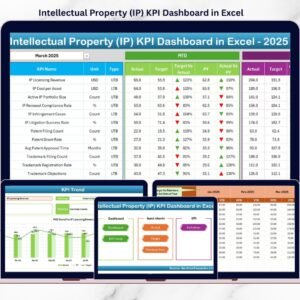
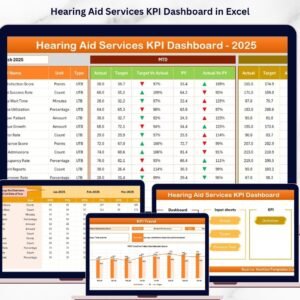
📈 KPI Trend Page – Analyze short- and long-term performance with combo charts comparing current vs. previous year against targets.
-
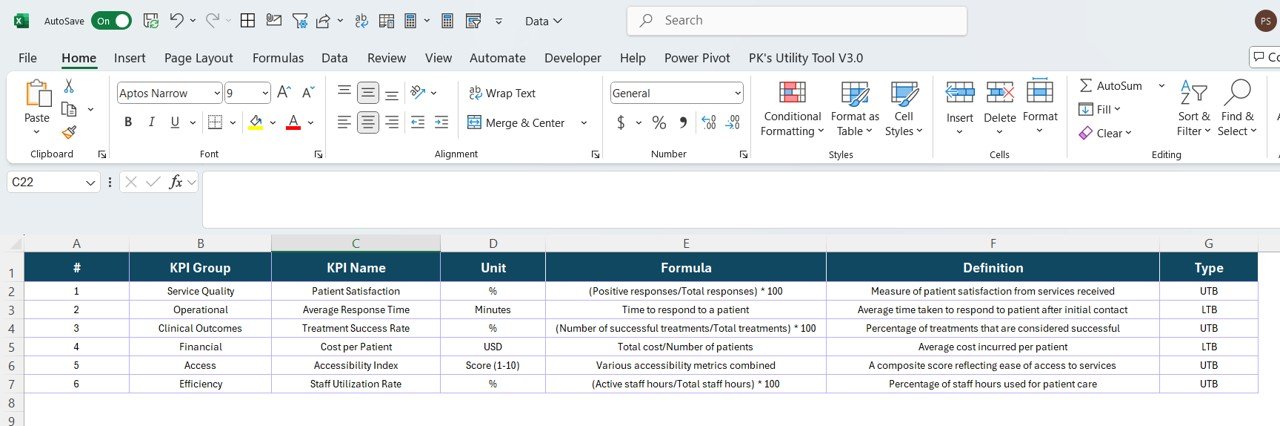
📑 KPI Definition Page – Ensure consistency with detailed KPI documentation (Number, Group, Unit, Formula, Type: LTB/UTB).
-
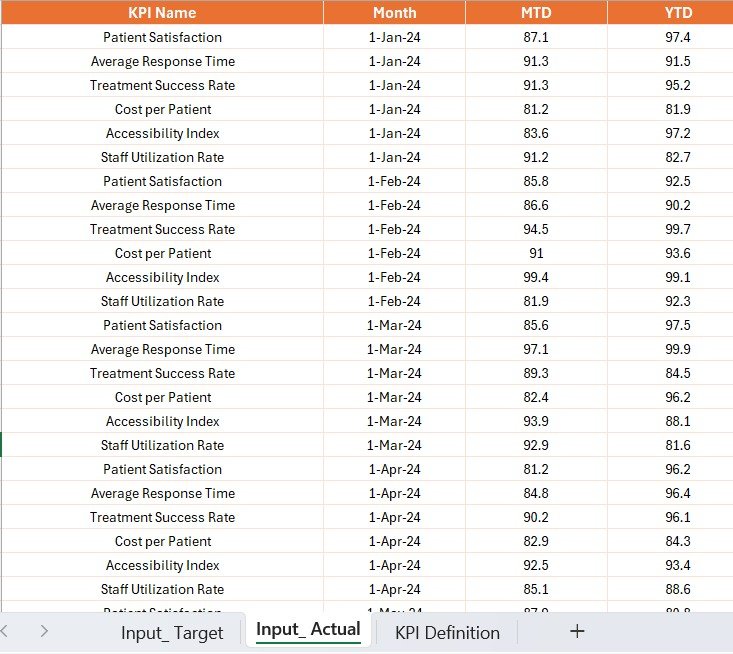
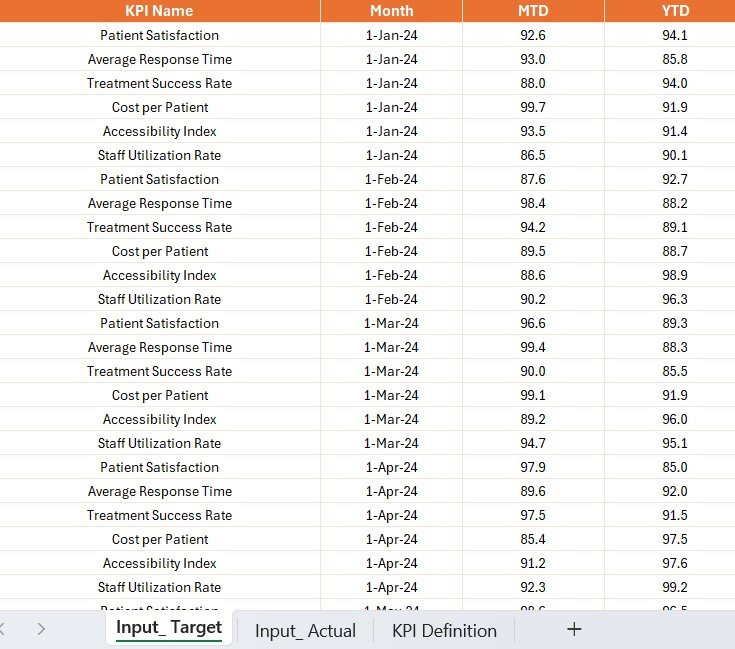
🔗 Excel Integration – Update KPI data via simple Excel sheets for Actuals, Targets, and Definitions—no advanced Power BI skills required.
-
⚡ Interactive Slicers – Filter data by month, KPI group, department, or program instantly.
-
🏥 Healthcare-Focused Metrics – Patient satisfaction, waiting times, therapy completion, compliance, staff workload, and more.
-
🎯 Target vs. Actual Icons – Instantly see which KPIs are on track with conditional formatting indicators.
-
🌍 Scalable & Customizable – Works for small clinics, hospitals, NGOs, government programs, and corporate wellness initiatives.
📂 What’s Inside the Mental Health Services KPI Dashboard
The dashboard includes three main pages plus Excel data sources:
-
Summary Page – The hub for KPI performance with cards, slicers, and a detailed KPI table covering MTD and YTD metrics.
-
KPI Trend Page – Combo charts and trend visuals for performance comparison over time.
-
KPI Definition Page – A hidden but powerful documentation tool for KPI clarity.
-
Excel Integration – Input_Actual, Input_Target, and KPI_Definition sheets keep the dashboard easy to update and maintain.
🛠 How to Use the Mental Health Services KPI Dashboard
-
Update Excel Data – Add monthly actuals and targets in the provided Excel sheets.
-
Refresh Power BI – Sync data to update visuals automatically.
-
Navigate Pages – Use slicers to filter by KPI group, month, or program.
-
Check Summary Page – Review high-level KPI performance with status icons.
-
Drill Into Trends – Use the KPI Trend Page to spot seasonal changes and long-term progress.
-
Refer to Definitions – Use the KPI Definition Page to ensure consistency in measurement.
👥 Who Can Benefit from This Mental Health Services KPI Dashboard
This dashboard is built for all stakeholders in mental health services, including:
-
🏥 Hospitals & Clinics – Monitor patient outcomes, therapy success rates, and compliance.
-
🌐 NGOs & Non-profits – Track the effectiveness of funded mental health programs.
-
🏛 Government Programs – Measure performance against national or regional health goals.
-
🏢 Corporate Wellness Initiatives – Evaluate employee mental health and support services.
-
🎓 Universities & Schools – Track student counseling utilization and outcomes.


Reviews
There are no reviews yet.