Memes and viral content move the internet. They shape conversations, build communities, and drive massive engagement for brands and creators. However, while creativity sparks virality, data sustains long-term success. Without structured performance tracking, meme marketing quickly turns into guesswork.
That is exactly why the Meme and Viral Content Creation KPI Dashboard in Excel becomes a powerful and practical solution.
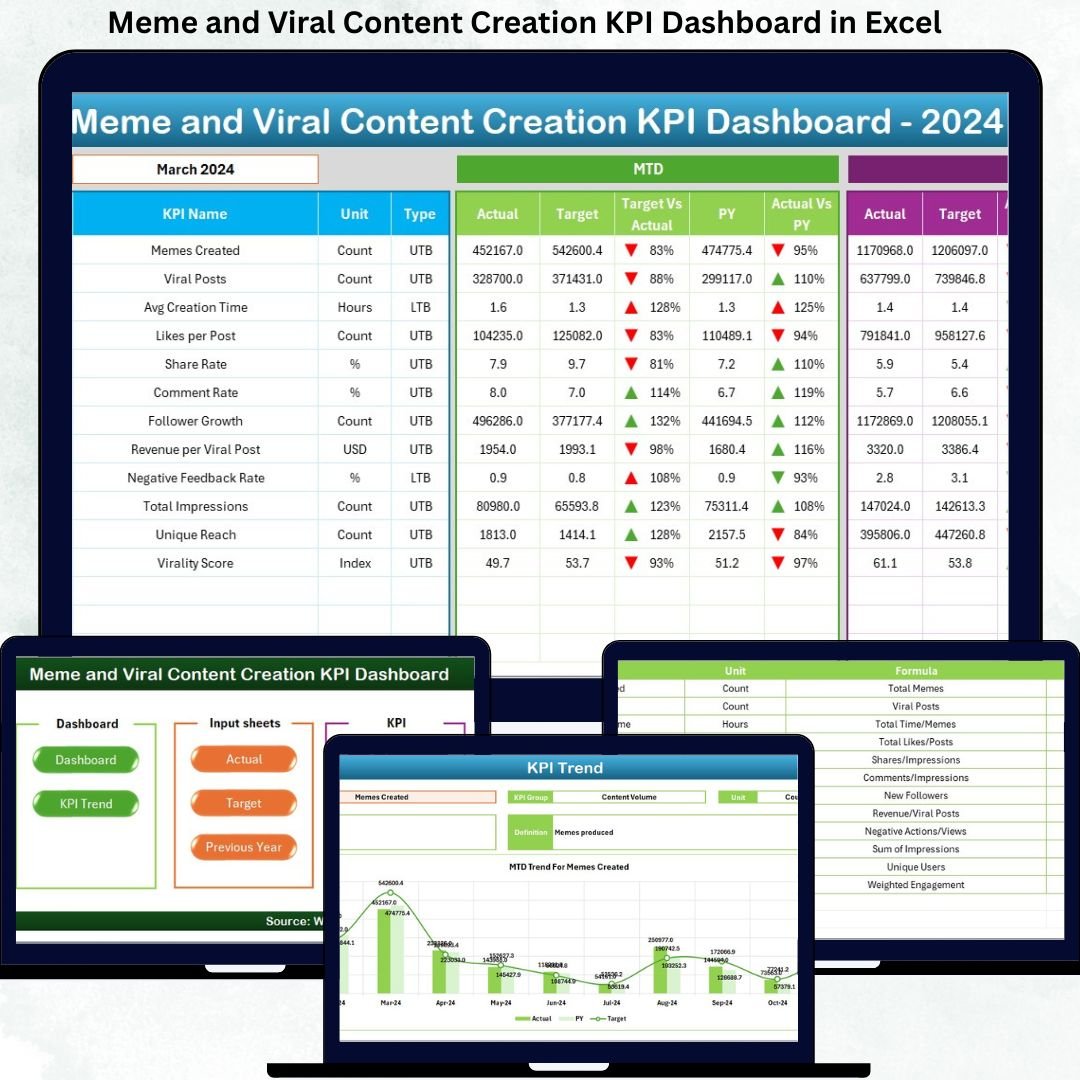
This ready-to-use Excel dashboard converts meme and viral content data into clear KPIs, automated calculations, and visual performance indicators. Instead of tracking likes, shares, and reach across scattered files and platforms, creators and social media teams gain one centralized dashboard to monitor MTD, YTD, targets, and historical performance. As a result, creativity aligns with measurable impact.
🔑 Key Features of Meme and Viral Content Creation KPI Dashboard in Excel
📊 Centralized Viral KPI Tracking
Track engagement, reach, growth, and performance KPIs in one structured Excel file.
📅 MTD & YTD Performance Monitoring
Analyze short-term viral momentum and long-term growth together.
🎯 Target vs Actual Comparison
Instantly see whether engagement goals are met or missed.
📈 Current Year vs Previous Year Analysis
Measure viral growth trends and benchmark past performance.
🧭 Month-Based Filtering
Select any reporting month using a simple drop-down to refresh the dashboard.
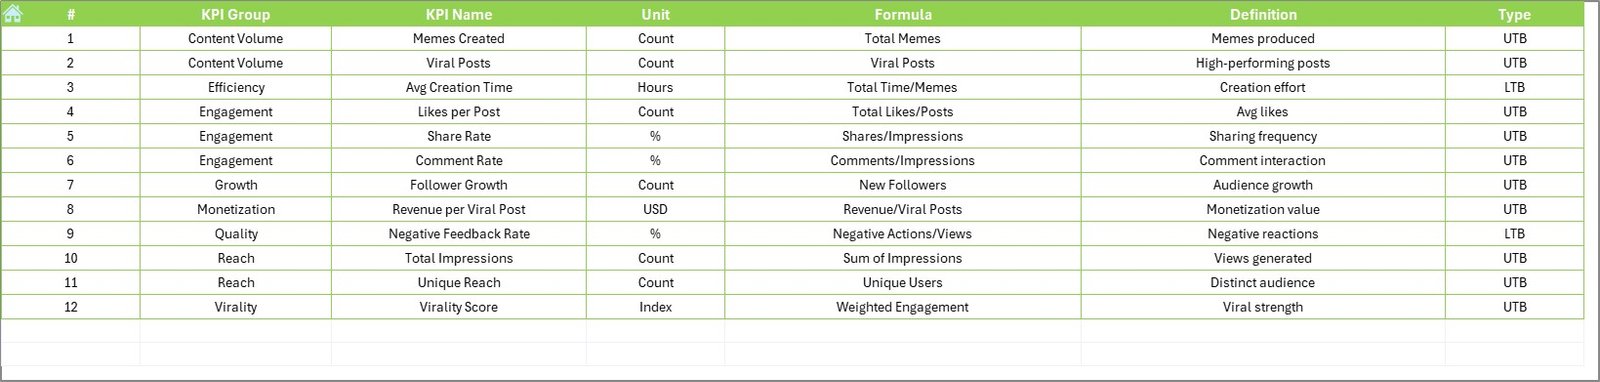
📘 Clear KPI Definitions & Logic
Maintain KPI group, unit, formula, and LTB / UTB classification.
⚙️ 100% Excel-Based & Creator-Friendly
No advanced tools required—easy updates with minimal learning curve.
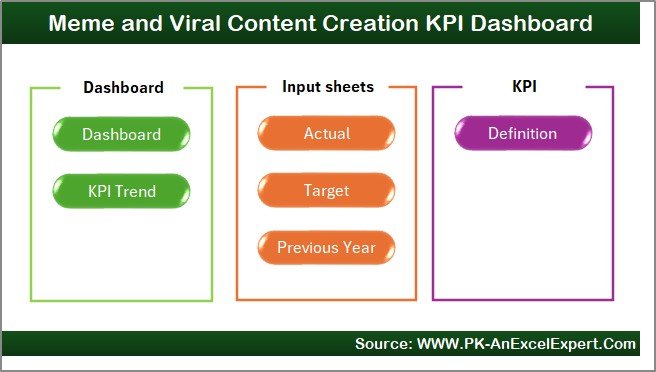
📦 What’s Inside the Meme and Viral Content Creation KPI Dashboard in Excel
This professional dashboard includes 7 well-structured worksheets; each designed for clarity and speed:
🏠 Home Sheet
A clean navigation hub with 6 buttons for one-click access to all major sheets.
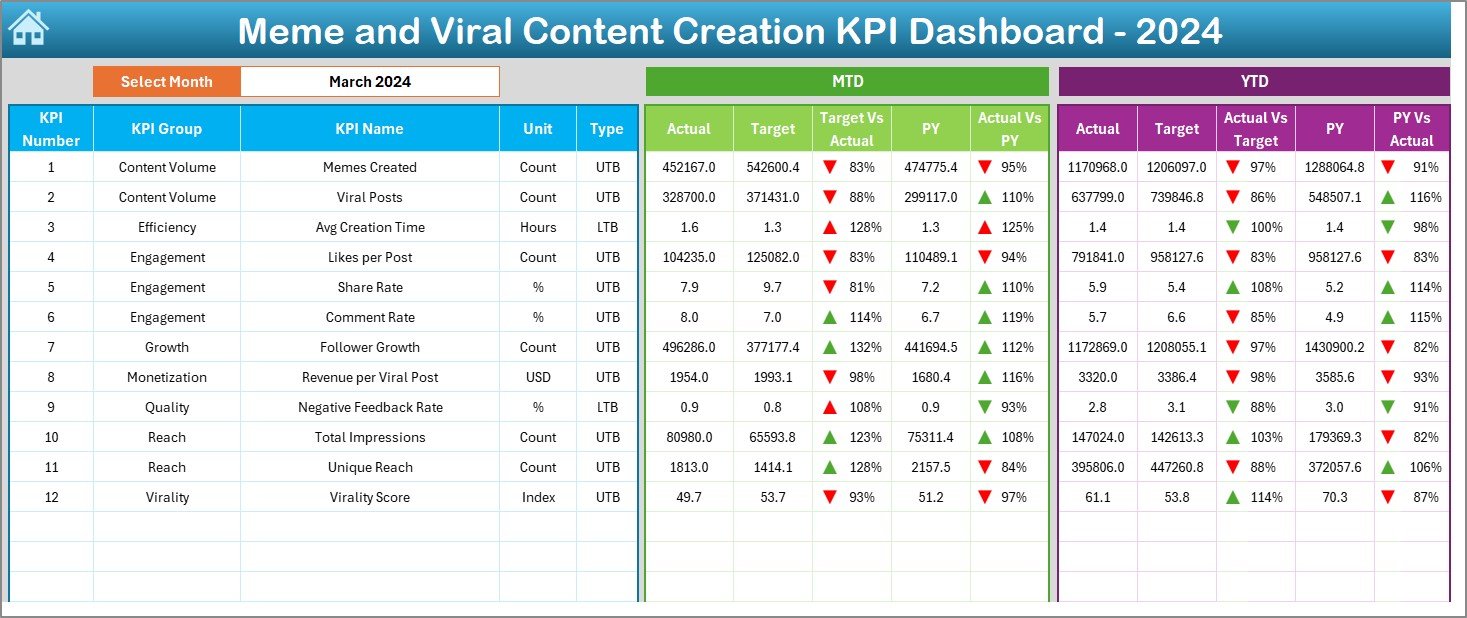
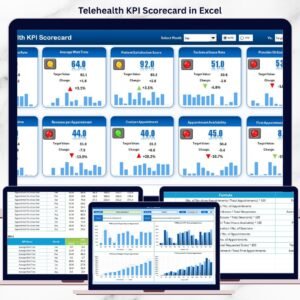
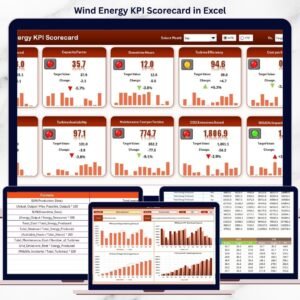
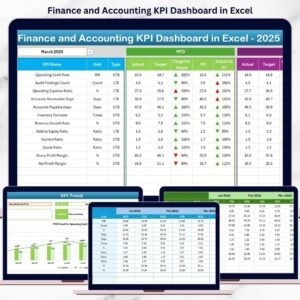
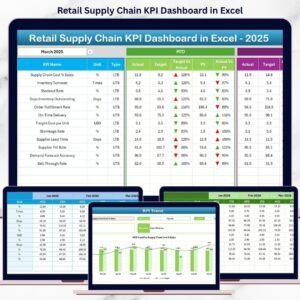
📊 Dashboard Sheet
The main performance overview showing:
-
Month selection at cell D3
-
MTD Actual, Target, and Previous Year values
-
Target vs Actual % and PY vs Actual %
-
YTD Actual, Target, and Previous Year values
-
Green ▲ / Red ▼ conditional formatting indicators
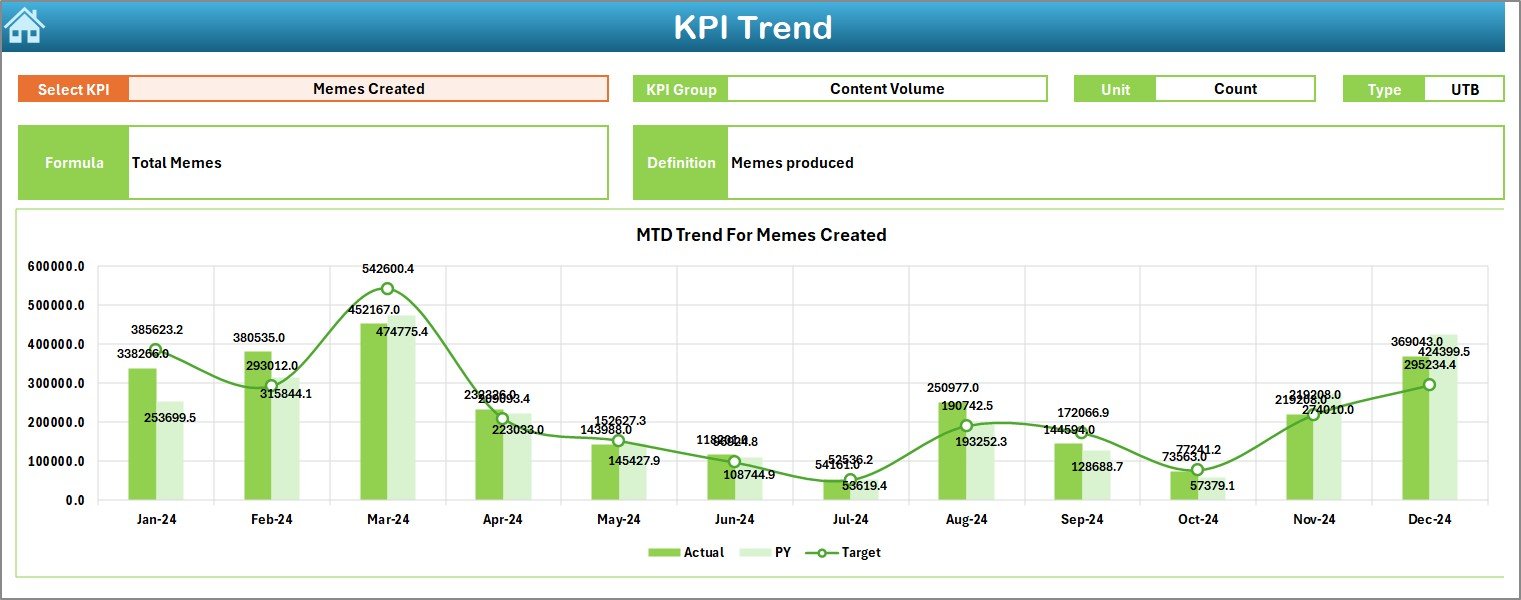
📈 KPI Trend Sheet
Designed for trend discovery with:
-
KPI selection drop-down (cell C3)
-
KPI Group, Unit, Type, Formula, and Definition
-
MTD trend chart (Actual, Target, PY)
-
YTD trend chart (Actual, Target, PY)
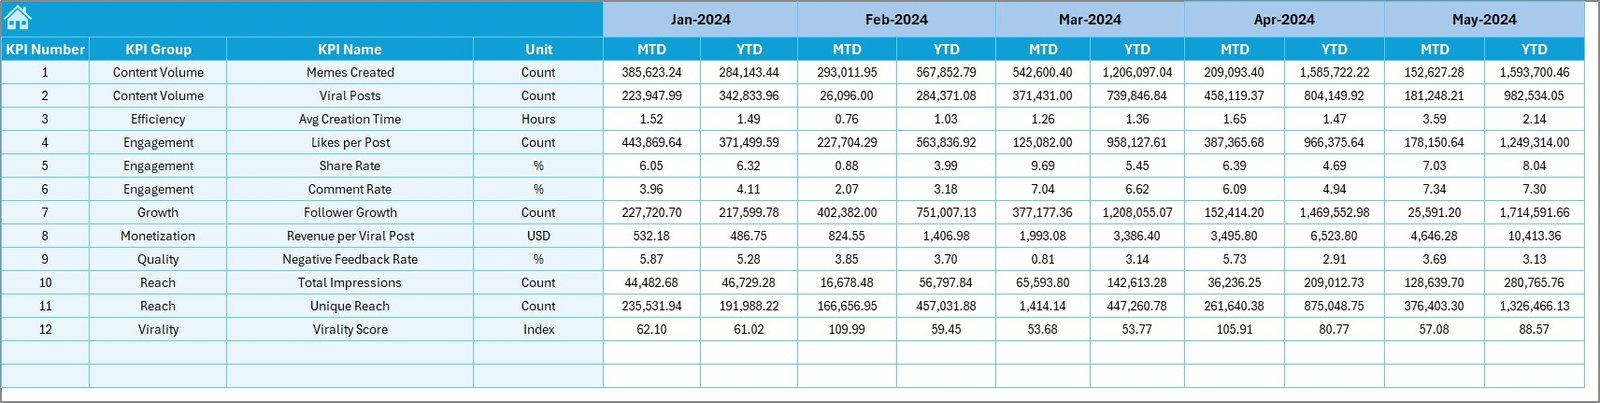
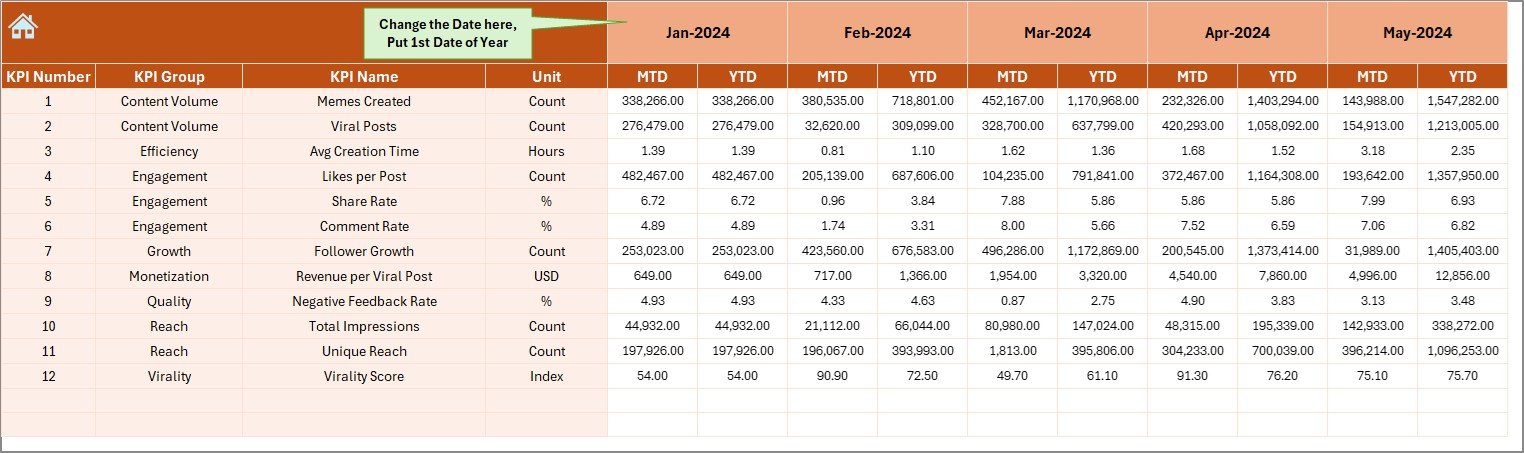
📝 Actual Numbers Input Sheet
Used to enter MTD and YTD actual engagement data in a structured format.
🎯 Target Sheet
Stores KPI-wise MTD and YTD engagement targets.
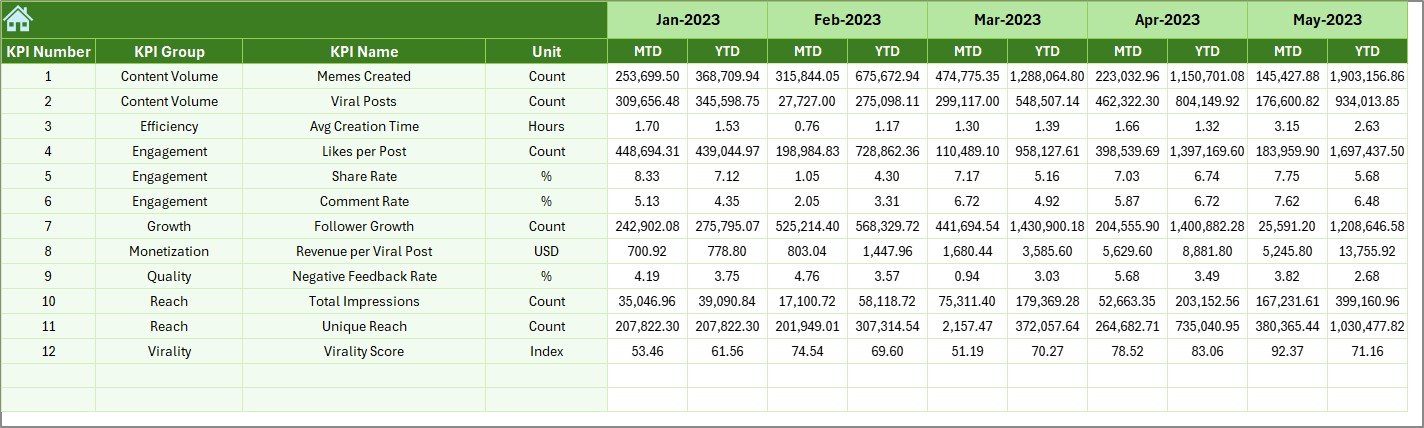
📜 Previous Year Number Sheet
Holds historical MTD and YTD data for year-over-year comparison.
📘 KPI Definition Sheet
Acts as the master reference for KPI name, group, unit, formula, and definition.
▶️ How to Use the Meme and Viral Content Creation KPI Dashboard in Excel
Using the dashboard is fast and creator-friendly:
1️⃣ Enter engagement data in the Actual Numbers Input Sheet
2️⃣ Update goals in the Target Sheet
3️⃣ Maintain KPI structure in the KPI Definition Sheet
4️⃣ Select the reporting month from the drop-down
5️⃣ Review MTD and YTD performance on the Dashboard
6️⃣ Analyze content trends on the KPI Trend Sheet
7️⃣ Optimize meme strategy using data-driven insights
No advanced Excel skills are required.
🎯 Who Can Benefit from This Meme and Viral Content Creation KPI Dashboard in Excel
😂 Meme Creators & Pages – Track what truly goes viral
📱 Social Media Managers – Optimize engagement strategies
🎯 Digital Marketing Teams – Align memes with campaign goals
🏢 Agencies & Brands – Measure ROI of viral content
📊 Content Strategists – Turn trends into repeatable success
The dashboard supports both creative experimentation and performance discipline.
👉 Click here to read the Detailed Blog Post
🔔 Visit our YouTube channel to learn step-by-step video tutorials
👉 YouTube.com/@PKAnExcelExpert


Reviews
There are no reviews yet.