
The Mass Media KPI Scorecard in Excel is the ultimate solution for broadcasters, publishers, journalists, and content creators who want to measure performance with precision. Whether you’re tracking ad revenue, audience engagement, or production efficiency, this Excel-based scorecard gives you all the insights you need — fast, visual, and data-driven 📊.
This professionally designed Excel template simplifies your entire performance management process. Instead of juggling spreadsheets or paying for expensive BI tools, you can now monitor your KPIs in one central, dynamic, and fully customizable dashboard.
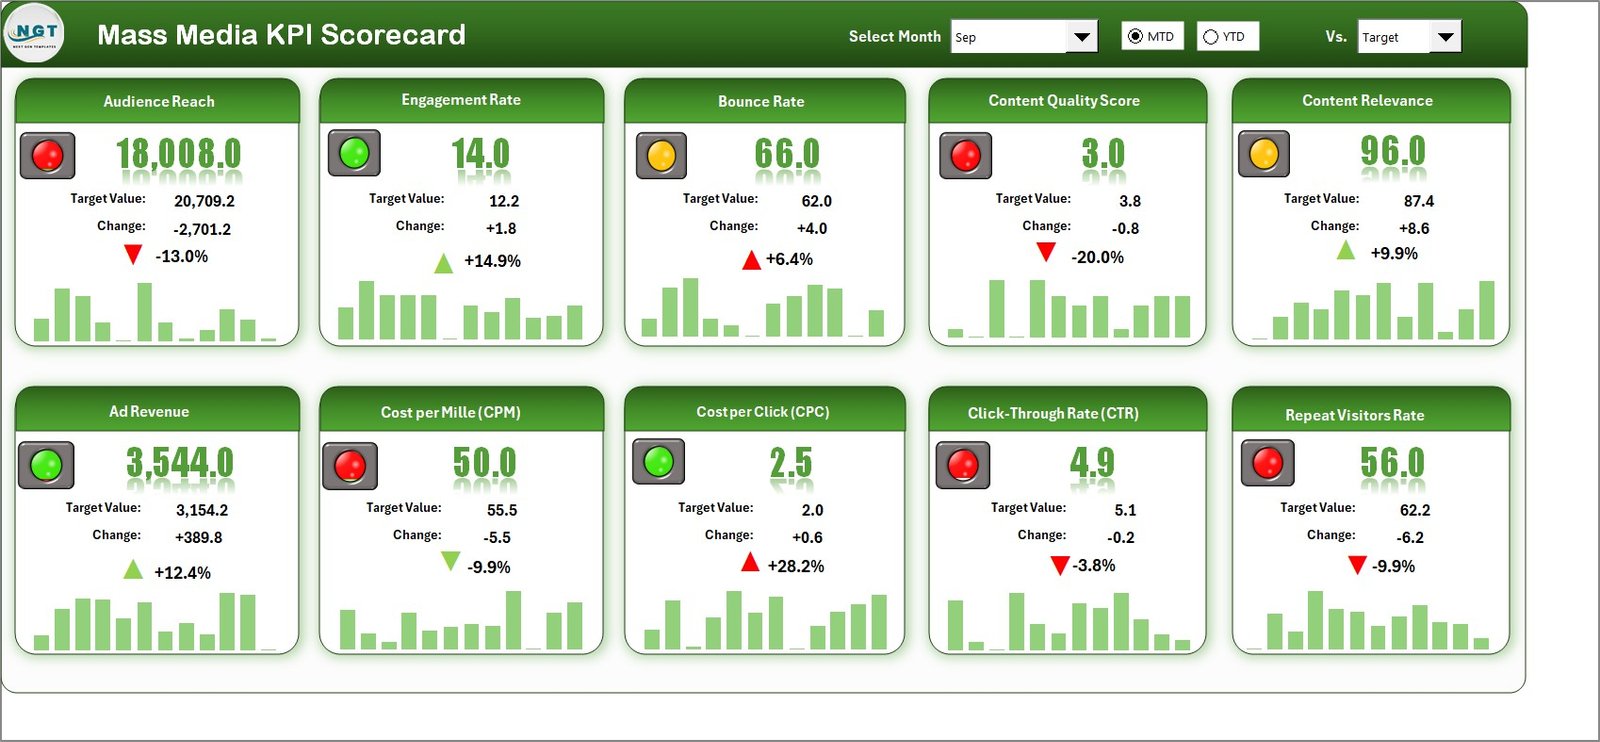
✨ Key Features of Mass Media KPI Scorecard in Excel
✅ Interactive Dashboard: Instantly visualize Month-to-Date (MTD) and Year-to-Date (YTD) performance using dynamic charts and color-coded indicators.
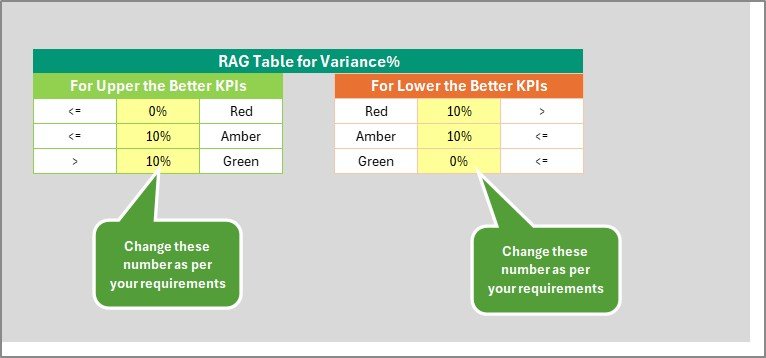
✅ Actual vs Target Comparison: See how your current results stack up against set goals — with automatic variance calculations and visual signals (green ✅, yellow ⚠️, red ❌).
✅ Customizable KPIs: Add or edit KPIs for TV, radio, digital media, or publishing, and adjust formulas to fit your exact operational needs.
✅ Real-Time Data Refresh: As soon as you update the Input Data sheet, all visuals and calculations refresh automatically.
✅ Cost-Effective & User-Friendly: No coding, no macros, no third-party tools — just Excel! Perfect for both beginners and professionals.
✅ Professional Layout: Clean design, easy navigation, and slicers for department, region, or media type selection.
📂 What’s Inside the Mass Media KPI Scorecard in Excel
📄 1. Scorecard Sheet:
Your main dashboard interface — displaying MTD/YTD KPIs, actual vs target comparisons, and trend visuals. Includes dropdowns for period selection and performance indicators using traffic-light icons.
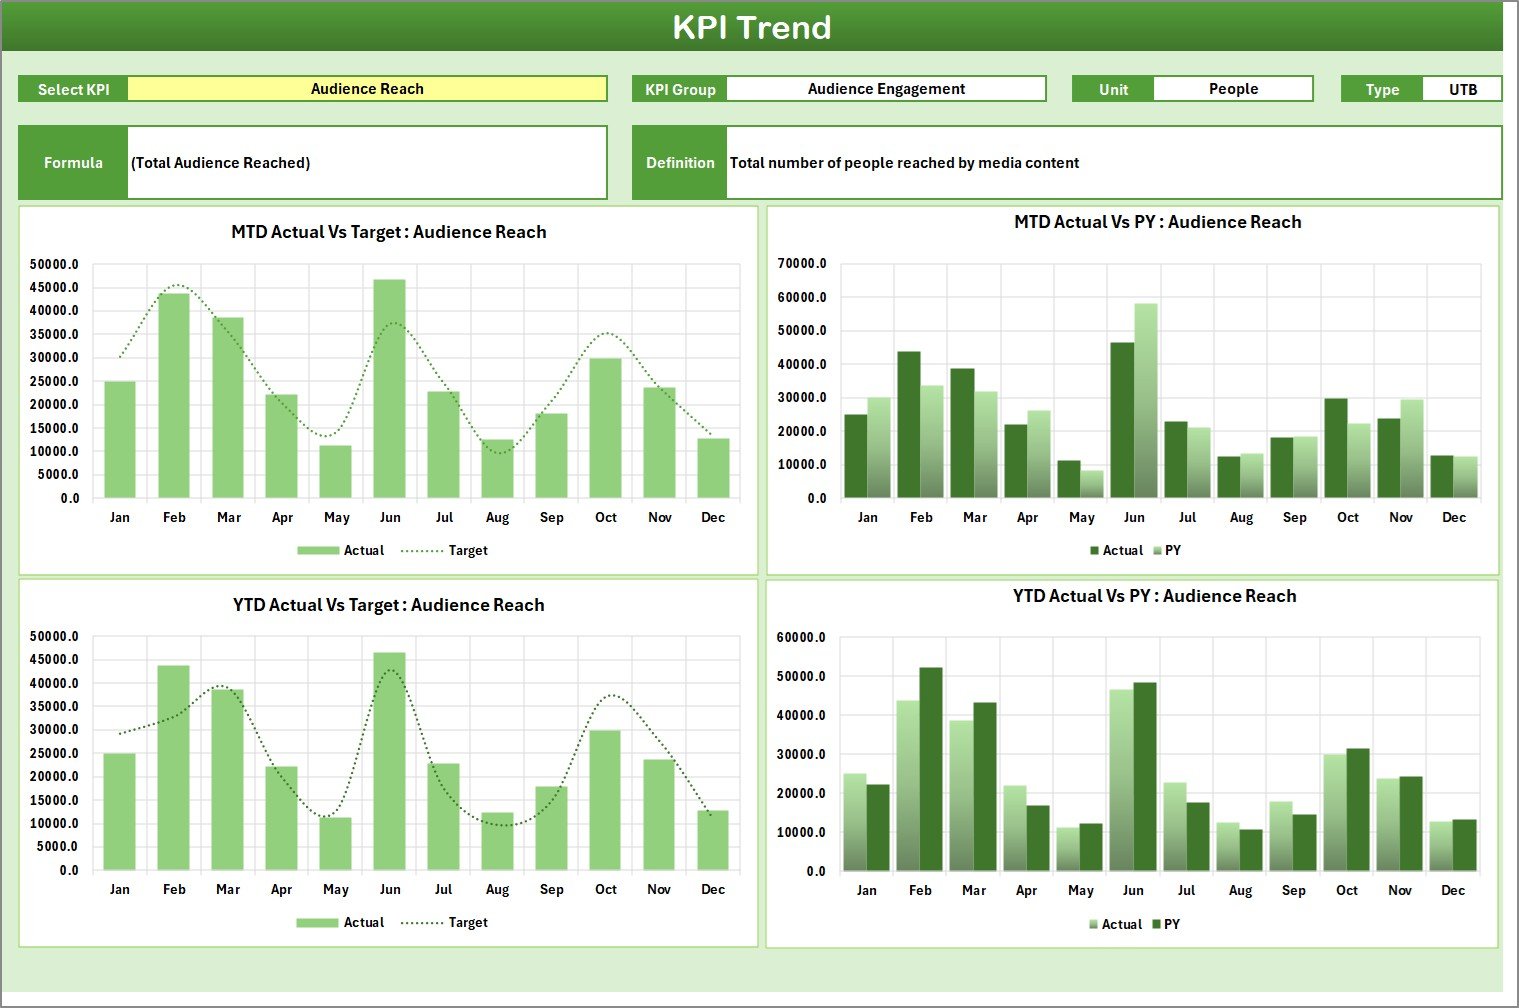
📈 2. KPI Trend Sheet:
View detailed performance trends over time. Choose a KPI from the dropdown (Cell C3) to see group, formula, definition, and type (UTB/LTB) — plus trend lines comparing Actual, Target, and Previous Year.
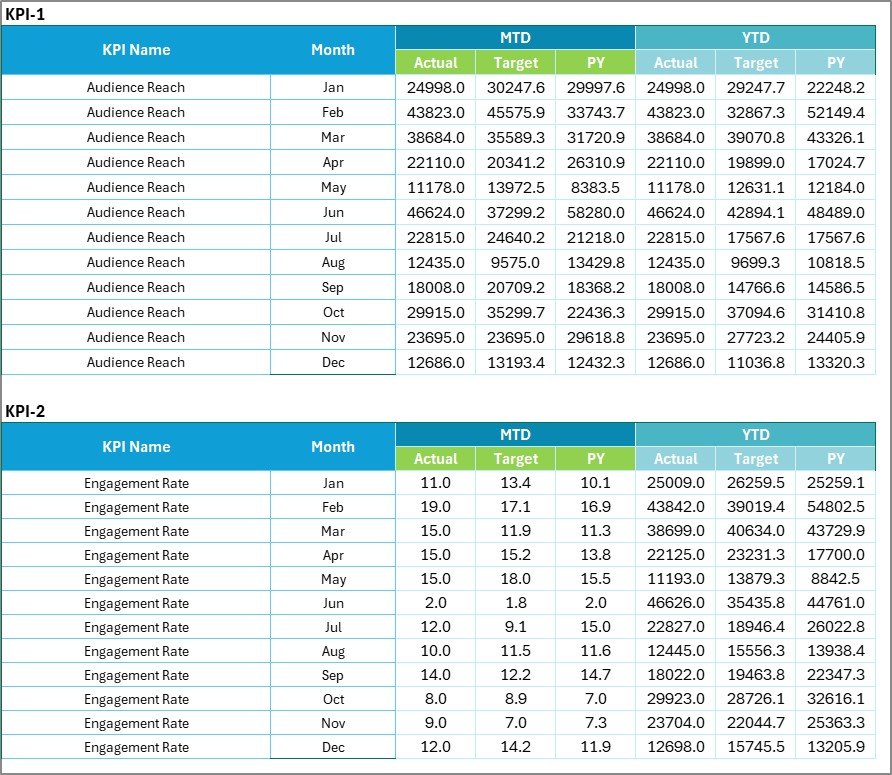
🧮 3. Input Data Sheet:
Enter monthly performance data — Actual, Target, and PY values. The sheet auto-feeds all dashboards to maintain accuracy and consistency.
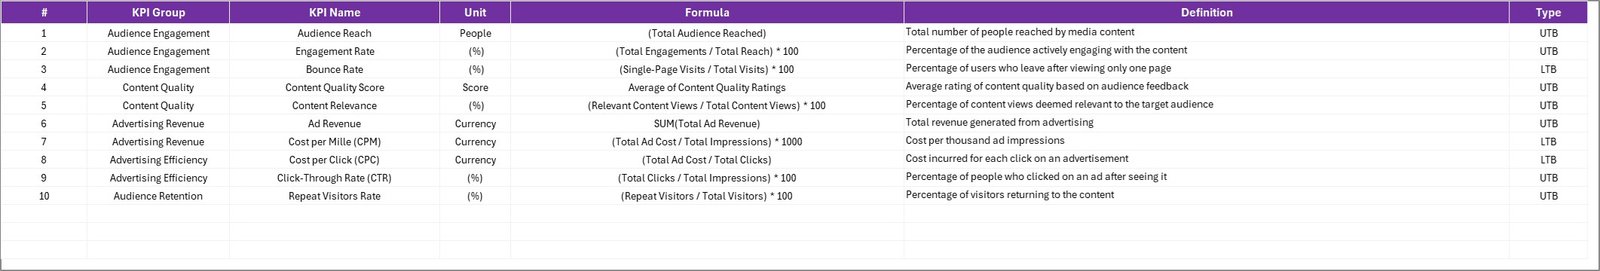
📘 4. KPI Definition Sheet:
A complete KPI reference library with fields for KPI Name, Group, Unit, Formula, Definition, and Type. Ensures every user understands what’s being measured and how it’s calculated.
🧠 How to Use the Mass Media KPI Scorecard in Excel
🚀 Step 1: Go to the Input Data Sheet and enter your KPIs’ Actual, Target, and Previous Year numbers.
📊 Step 2: Open the KPI Definition Sheet to review or modify KPI formulas and units.
📅 Step 3: Navigate to the Scorecard Sheet, choose your Month and MTD/YTD view, and see results update instantly.
📈 Step 4: Use the Trend Sheet to analyze progress over time and identify areas for improvement.
⚙️ Step 5: Adjust your media strategies based on the data-driven insights and performance variances highlighted on the dashboard.
Within minutes, you’ll be able to identify what’s working, what’s lagging, and where to allocate resources for maximum ROI.
👥 Who Can Benefit from This Mass Media KPI Scorecard in Excel
🎬 TV & Radio Broadcasters – Track advertising revenue, airtime efficiency, and content performance.
📰 News Agencies – Monitor audience reach, engagement, and journalist productivity.
💻 Digital Media Houses – Measure website traffic, ad impressions, social media performance, and content ROI.
📱 Marketing Teams – Analyze cross-platform campaigns and optimize audience engagement strategies.
🏢 Media Executives & Managers – Get a real-time overview of performance trends for better decision-making.
📊 Consultants & Analysts – Provide clients with accurate reports and visual insights without needing Power BI or Tableau.
This template bridges the gap between complex data and simple insights — helping your organization make smarter, faster, and more transparent media decisions.


Reviews
There are no reviews yet.