
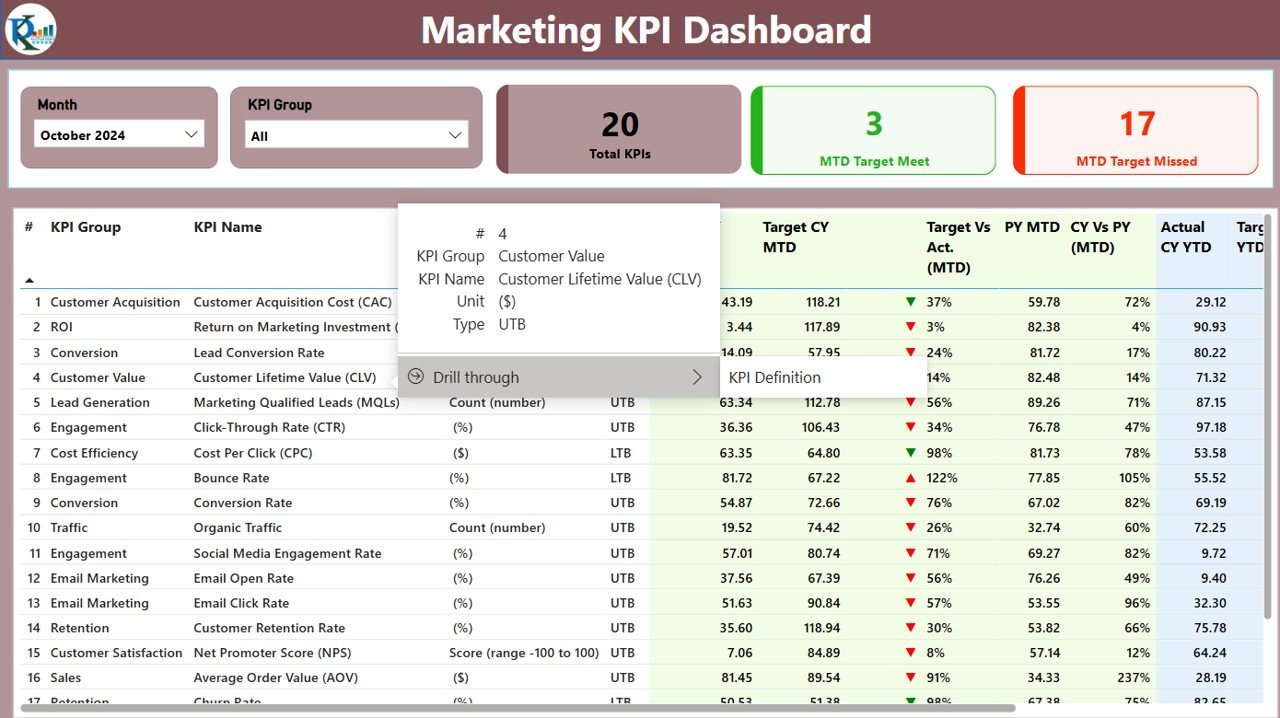

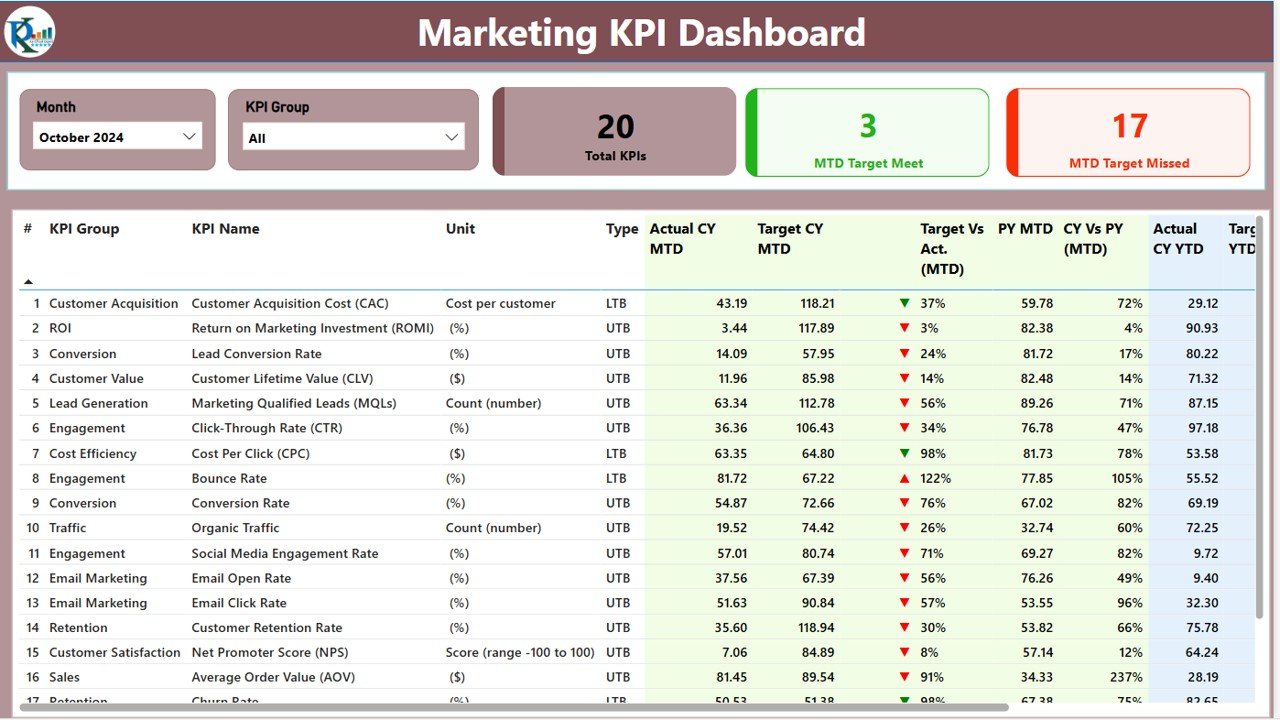
The Marketing KPI Dashboard in Power BI is an advanced analytics tool designed for marketers to track, analyze, and optimize their marketing efforts. This interactive dashboard allows businesses to measure the effectiveness of their marketing campaigns, monitor lead generation, sales conversions, and ROI in real-time, and ultimately, improve marketing strategies based on data-driven insights.
Whether you’re managing social media campaigns, email marketing efforts, or paid ads, this Power BI dashboard provides a comprehensive view of all marketing KPIs. With customizable visualizations, you can easily track campaign performance, customer engagement, and overall marketing success, ensuring that your marketing budget is spent effectively.
Key Features of the Marketing KPI Dashboard in Power BI
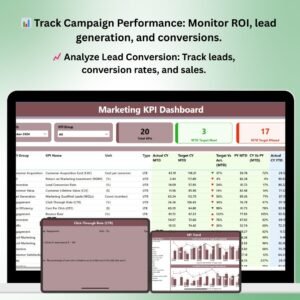
📊 Track Marketing Campaign Performance
Monitor the effectiveness of all marketing campaigns, including digital ads, email marketing, and content marketing. Track metrics such as impressions, clicks, conversions, and ROI.
📈 Lead Generation & Conversion Analysis
Track the number of leads generated, conversion rates, and sales performance. Visualize how effectively your marketing efforts are converting prospects into customers.
💡 Real-Time Data Insights
Get up-to-the-minute insights into campaign performance, customer engagement, and marketing ROI. Stay ahead of trends and optimize your marketing activities in real-time.
💰 ROI & Budget Tracking
Monitor the return on investment (ROI) for various marketing campaigns and track how your marketing budget is allocated and spent. Make data-driven decisions to maximize ROI.
📉 Customer Engagement Metrics
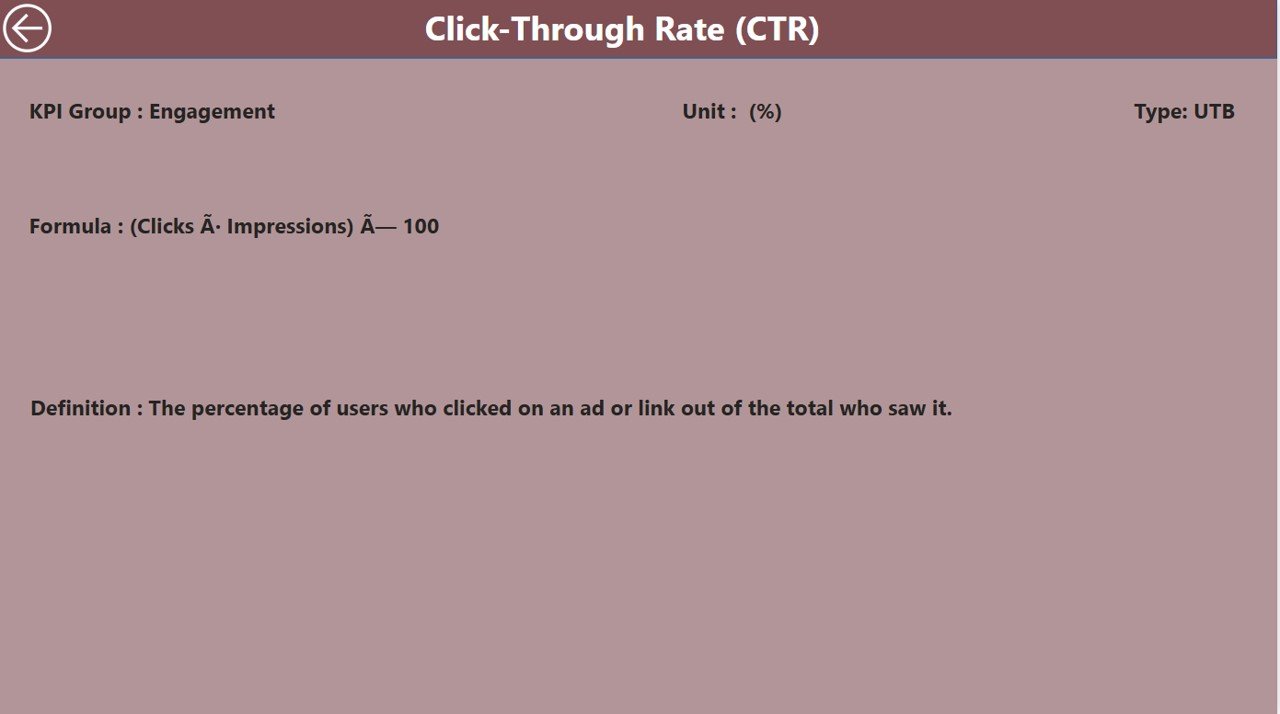
Track key customer engagement metrics such as click-through rates (CTR), bounce rates, and social media interactions. Understand how your audience is engaging with your content.
🖥️ Customizable & Interactive Dashboard
Fully interactive and customizable, this dashboard allows you to filter data by campaign type, time period, or marketing channel to get the insights that matter most to your business.
Why You’ll Love the Marketing KPI Dashboard in Power BI
✅ Data-Driven Marketing Decisions
Leverage real-time data to make informed decisions about your marketing strategy. Optimize campaigns for better performance and higher ROI.
✅ Improve Campaign Efficiency
Identify which marketing campaigns are working and which need adjustments. Track and optimize efforts across all channels to ensure your marketing activities are as efficient as possible.
✅ Maximize Marketing ROI
Track the performance of each campaign to ensure that your marketing budget is being spent effectively. Improve the ROI on each marketing activity.
✅ Monitor Customer Engagement
Gain a deeper understanding of your customers’ interactions with your brand. Track click-through rates, social media engagement, and more to refine your approach.
✅ Fully Customizable & Scalable
Adapt the dashboard to fit your marketing goals. Whether you’re tracking multiple campaigns, analyzing customer behavior, or comparing marketing channels, this dashboard scales to your needs.
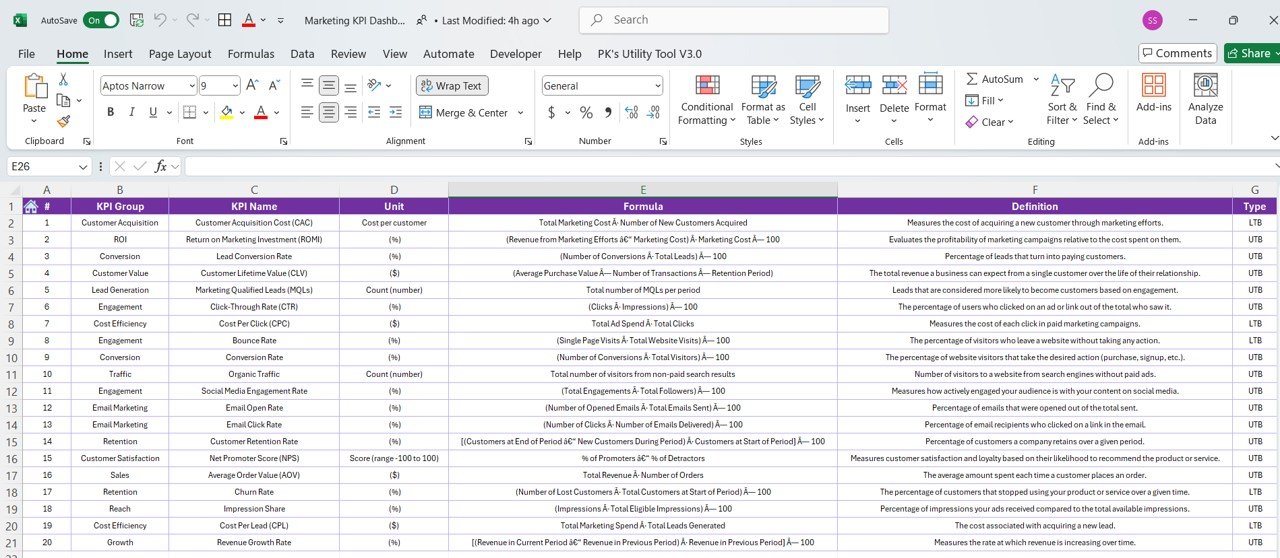
What’s Inside the Marketing KPI Dashboard Template in Power BI?
- Campaign Performance Tracking: Monitor the effectiveness of your marketing campaigns across various channels.
- Lead Generation & Conversion Metrics: Track leads, conversions, and sales performance.
- ROI & Budget Analysis: Analyze the ROI for each marketing activity and track spending.
- Customer Engagement Insights: Measure customer interactions, such as clicks, likes, shares, and more.
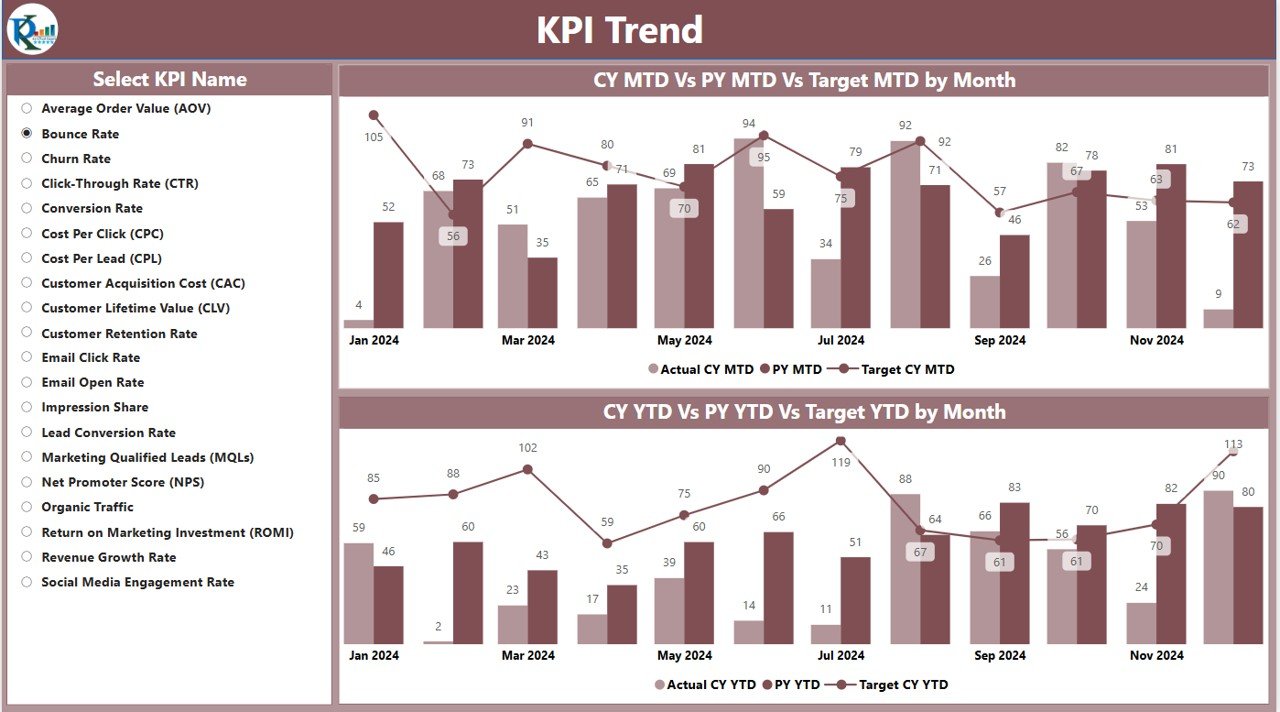
- Real-Time Data Visualizations: Use interactive charts, graphs, and slicers to drill down into the performance data.
- Customizable Dashboard: Filter data by marketing campaign, channel, or time period for more specific insights.
How to Use the Marketing KPI Dashboard in Power BI
1️⃣ Download the Template: Instantly get access to the Marketing KPI Dashboard in Power BI.
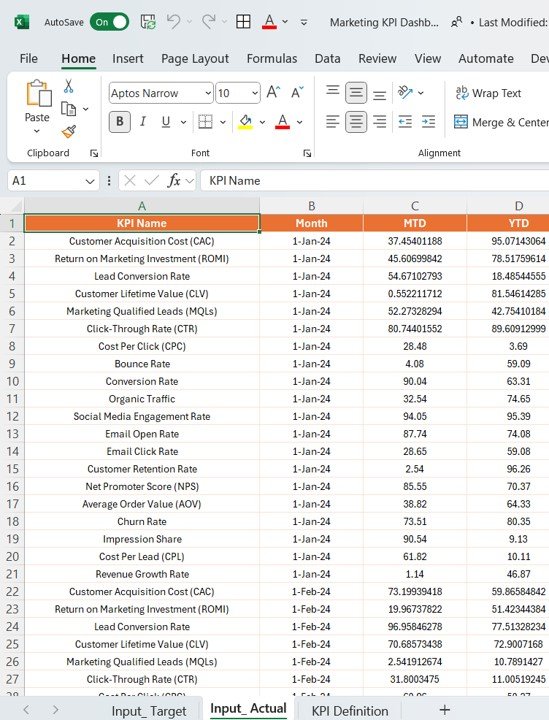
2️⃣ Input Marketing Data: Enter your campaign data, including spending, leads, conversions, and engagement metrics.
3️⃣ Track & Optimize KPIs: Use the dashboard to monitor key metrics and optimize your marketing strategies.
4️⃣ Analyze Campaign Performance: Visualize and analyze campaign effectiveness to refine your marketing approach.
5️⃣ Generate Reports & Insights: Create custom reports to track performance trends, optimize ROI, and make informed decisions.
Who Can Benefit from the Marketing KPI Dashboard in Power BI?
🔹 Marketing Teams & Campaign Managers
🔹 Digital Marketing Professionals
🔹 E-commerce Businesses & Online Retailers
🔹 Business Owners & CEOs
🔹 Marketing Analysts & Data Analysts
🔹 Companies with Multichannel Marketing Strategies
Improve your marketing efforts with the Marketing KPI Dashboard in Power BI. Track performance, measure ROI, and optimize campaigns for maximum efficiency and growth.
Click here to read the Detailed blog post
Visit our YouTube channel to learn step-by-step video tutorials
Youtube.com/@PKAnExcelExpert


Reviews
There are no reviews yet.