

The Maritime KPI Dashboard in Power BI is an essential tool for maritime industry professionals looking to track and optimize key performance indicators (KPIs) related to vessel operations, shipping efficiency, port performance, and fleet management. This interactive and customizable dashboard helps maritime companies, ship operators, and port managers streamline operations, reduce costs, and improve performance through data-driven insights.
With visually appealing charts and real-time data updates, this dashboard gives you a comprehensive view of all relevant maritime KPIs, from fuel consumption and delivery times to vessel utilization and port throughput. The user-friendly interface allows you to monitor your fleet’s performance, track operational efficiency, and optimize processes across various maritime operations.
Key Features of the Maritime KPI Dashboard in Power BI
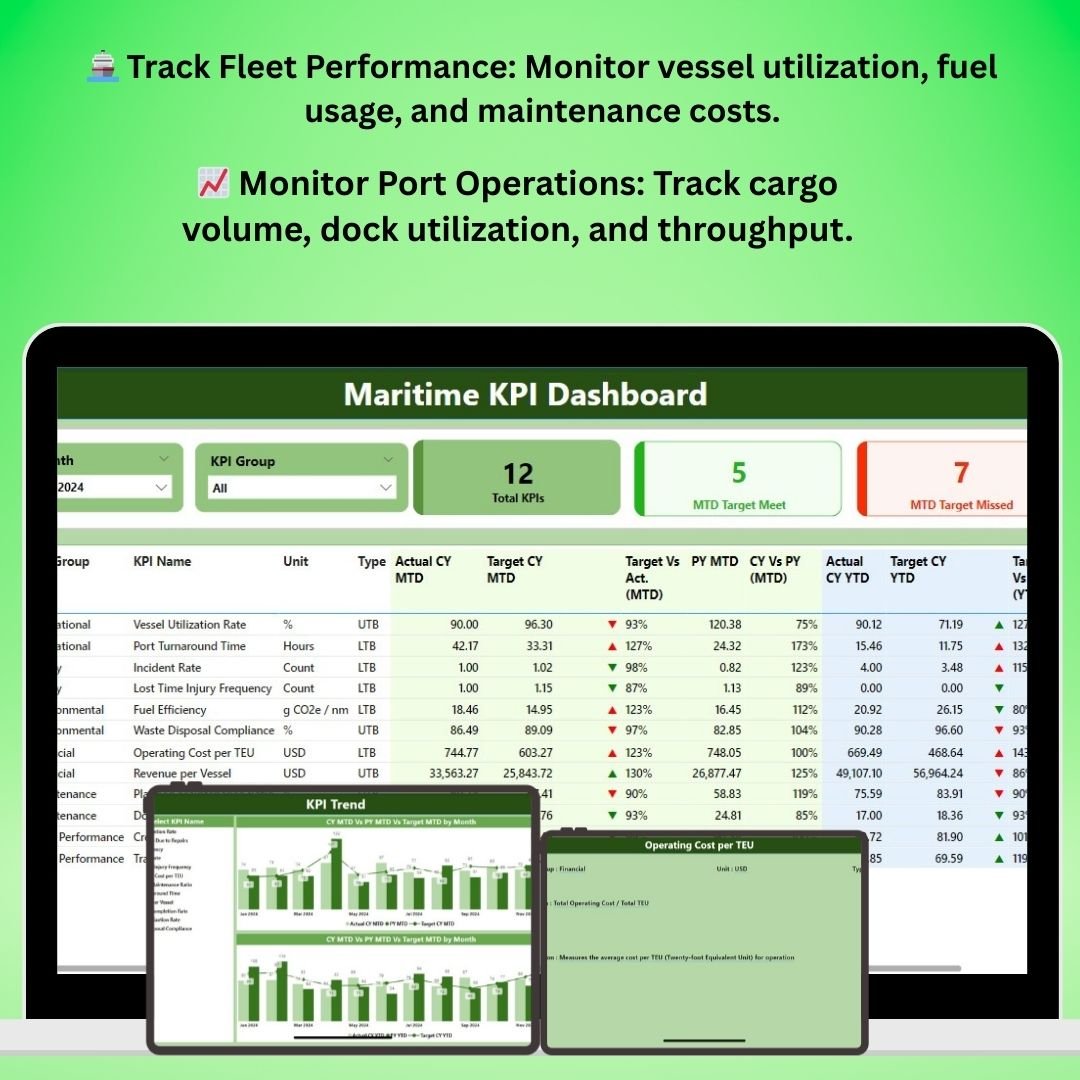
🚢 Track Vessel & Fleet Performance
Monitor the performance of your fleet with KPIs like vessel utilization, fuel consumption, maintenance costs, and on-time delivery. Track individual vessel performance and optimize fleet operations to improve overall efficiency.
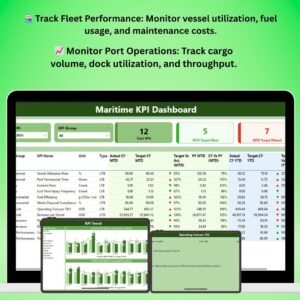
📈 Port & Terminal Performance Monitoring
Track key performance indicators related to port and terminal operations, including throughput, cargo volume, dock utilization, and turnaround times. Optimize port operations and reduce bottlenecks for faster and more efficient service.
⚓ Fuel Efficiency & Consumption Tracking
Monitor fuel usage across vessels and ensure fuel efficiency is optimized. Track fuel consumption patterns, identify areas for improvement, and reduce fuel-related costs to improve the profitability of your operations.
⏱️ Operational Time & Delivery Monitoring
Track operational time, turnaround times, and delivery schedules to ensure your fleet meets key deadlines and performance targets. Minimize delays, optimize shipping schedules, and improve overall logistics efficiency.
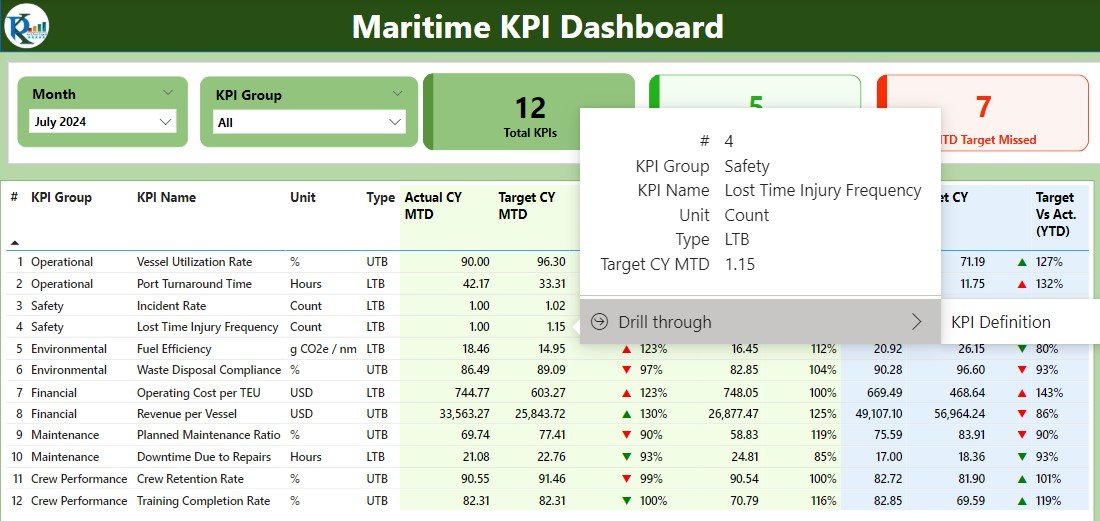
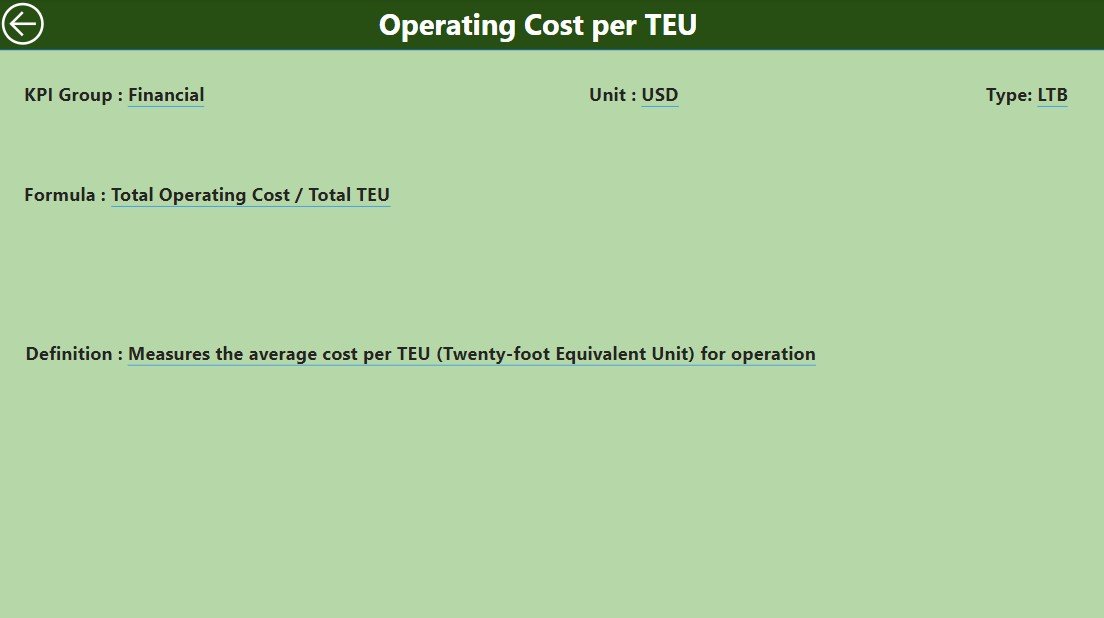
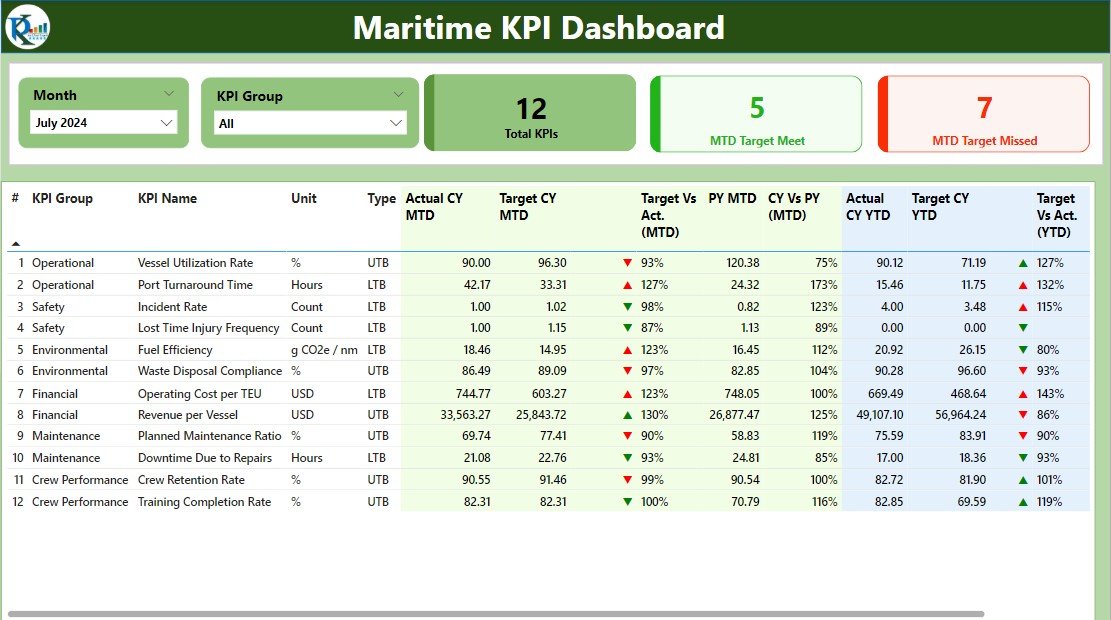
📊 Real-Time Data Visualization
Visualize KPIs and performance metrics in real time with interactive charts, graphs, and dashboards. Customize visualizations to drill down into specific areas, such as fleet performance, port operations, or fuel consumption, for deeper insights.
🖥️ Customizable & Interactive Layout
Fully customizable to match the specific KPIs and data points relevant to your maritime business. Filter data by time period, vessel, port, or other variables for tailored insights that help you make informed decisions.
Why You’ll Love the Maritime KPI Dashboard in Power BI
✅ Monitor Fleet Efficiency & Performance
Track critical metrics such as vessel utilization, fuel consumption, and maintenance costs to ensure the efficient operation of your fleet. Optimize operations to reduce costs and improve service delivery.
✅ Improve Port & Terminal Operations
Monitor port performance, dock utilization, and cargo throughput to optimize port and terminal activities. Identify bottlenecks and make data-driven decisions to improve operational flow.
✅ Enhance Fuel Efficiency & Cost Management
Track fuel consumption across your fleet and monitor fuel efficiency. Use the data to optimize fuel usage and reduce operational costs associated with fuel consumption.
✅ Optimize Delivery Schedules & Timeliness
Monitor operational time and turnaround times to ensure your fleet meets delivery deadlines. Minimize delays and improve logistics efficiency for timely service delivery.
✅ Fully Customizable & Scalable
Tailor the dashboard to your specific business needs. Filter and customize KPIs, data points, and visualizations to focus on what matters most to your maritime operations.
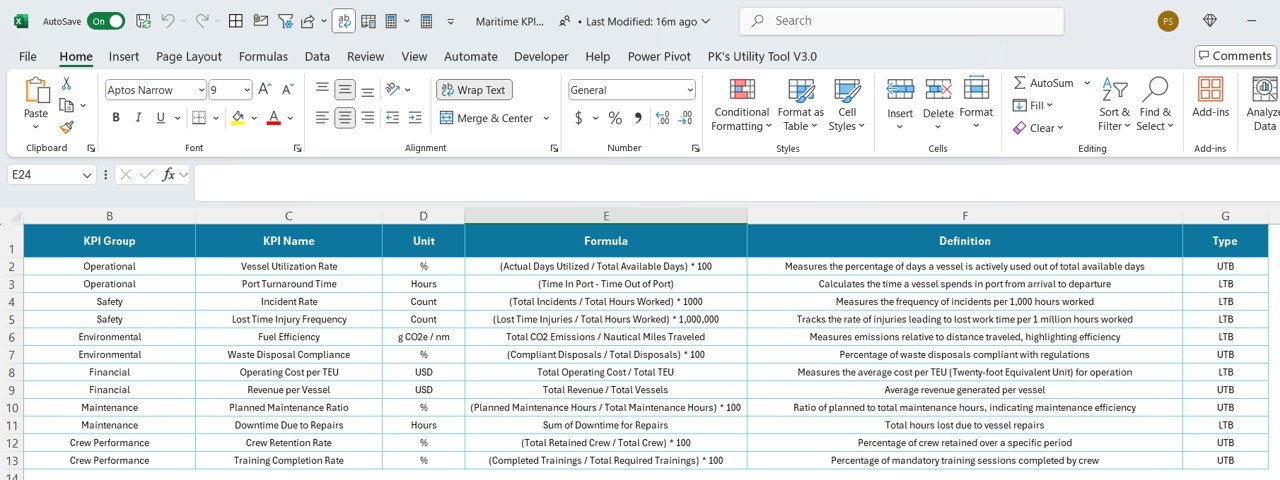
What’s Inside the Maritime KPI Dashboard Template in Power BI?
- Vessel & Fleet Performance Tracking: Track vessel utilization, fuel consumption, and maintenance costs.
- Port & Terminal Operations Monitoring: Track throughput, dock utilization, and cargo volume.
- Fuel Efficiency Tracking: Monitor fuel consumption across vessels to improve fuel efficiency.
- Operational Time & Delivery Tracking: Monitor turnaround times, delivery schedules, and operational efficiency.
- Customizable Dashboards: Customize filters, KPIs, and visualizations to suit your specific business needs.
- Interactive Data Visualizations: Use dynamic charts and graphs to drill down into performance metrics.
How to Use the Maritime KPI Dashboard in Power BI
1️⃣ Download the Template: Get instant access to the Maritime KPI Dashboard in Power BI.
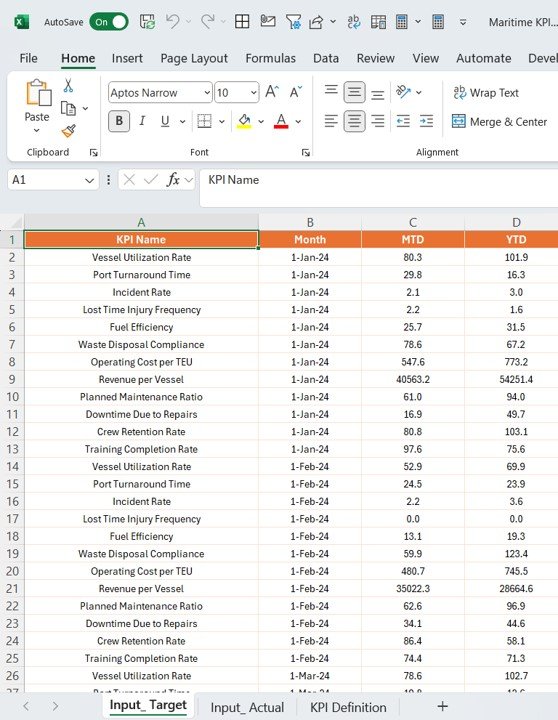
2️⃣ Input Your Maritime Data: Enter data related to fleet performance, port operations, fuel consumption, and operational time.
3️⃣ Track & Monitor KPIs: Use the dashboard to monitor and measure KPIs such as vessel utilization, cargo throughput, and fuel efficiency.
4️⃣ Analyze & Optimize Performance: Use data insights to optimize operations, reduce costs, and improve fleet and port performance.
5️⃣ Generate Reports & Insights: Create customized reports to share with stakeholders, managers, or clients.
Who Can Benefit from the Maritime KPI Dashboard in Power BI?
🔹 Maritime Fleet Operators
🔹 Port & Terminal Managers
🔹 Shipping & Logistics Companies
🔹 Shipping Agencies & Transport Providers
🔹 Maritime Consultants & Analysts
🔹 Business Owners in the Maritime Industry
Ensure efficient and optimized operations across your fleet and ports with the Maritime KPI Dashboard in Power BI. Track vessel performance, fuel efficiency, port throughput, and more to drive your business toward operational excellence.
Click here to read the Detailed blog post
Visit our YouTube channel to learn step-by-step video tutorials
Youtube.com/@PKAnExcelExpert


Reviews
There are no reviews yet.