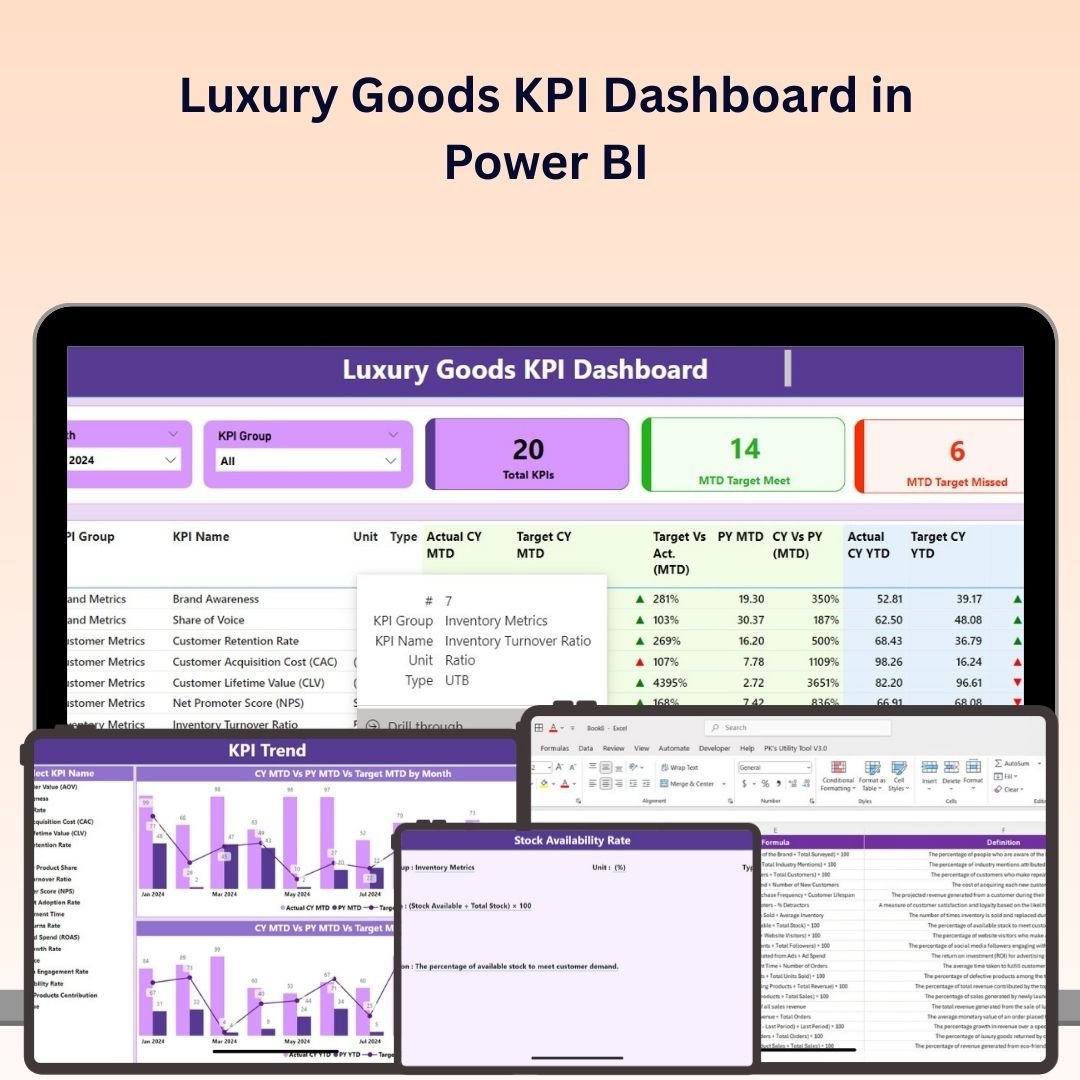
The Luxury Goods KPI Dashboard in Power BI is a powerful tool for luxury brand managers, business owners, and analysts who want to track and optimize the performance of their luxury goods business. This Power BI-based dashboard helps you monitor key performance indicators (KPIs) such as sales trends, customer demographics, inventory turnover, brand awareness, and profitability, ensuring that your luxury goods brand remains competitive and profitable.
With interactive visualizations, real-time tracking, and customizable reports, this dashboard provides valuable insights into sales performance, customer behavior, and inventory management, enabling you to make data-driven decisions to boost your brand’s success.
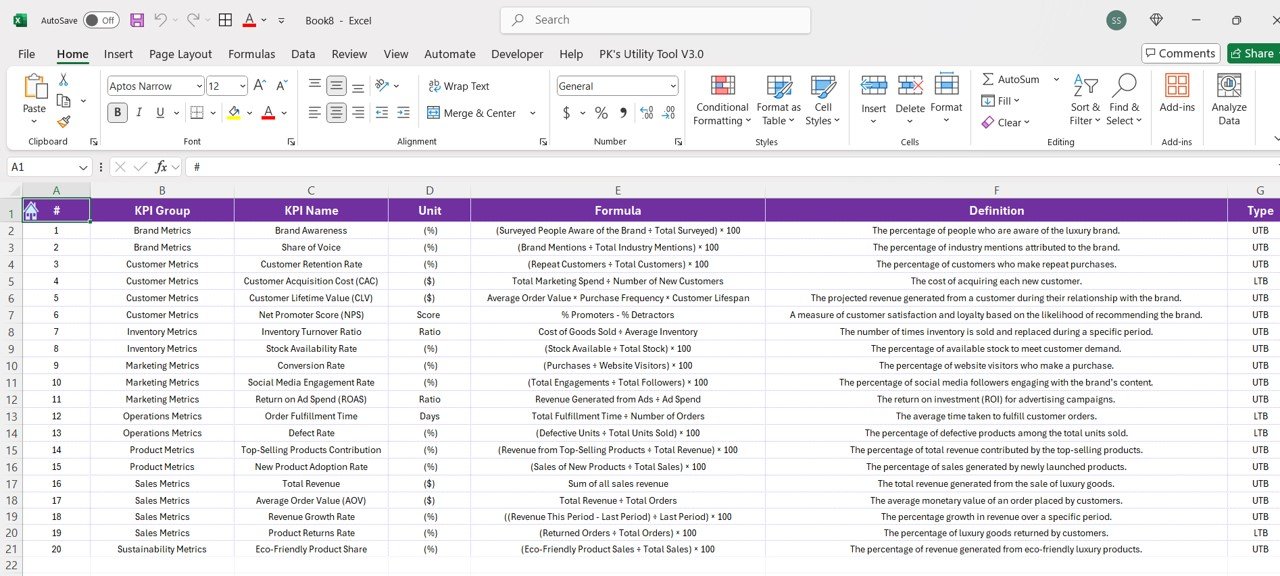
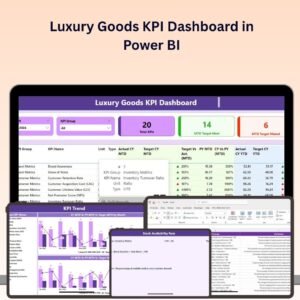
Key Features of the Luxury Goods KPI Dashboard in Power BI:
💎 Sales and Revenue Tracking
Monitor total sales, revenue, and growth trends for different product categories, identifying high-performing products and areas for improvement.
📈 Profitability Analysis
Track the profitability of individual products, brands, and channels to understand which areas are generating the most profit and which require optimization.
🎯 Customer Demographics and Behavior
Analyze customer demographics, purchasing behavior, and preferences to better understand your target market and tailor your marketing strategies.
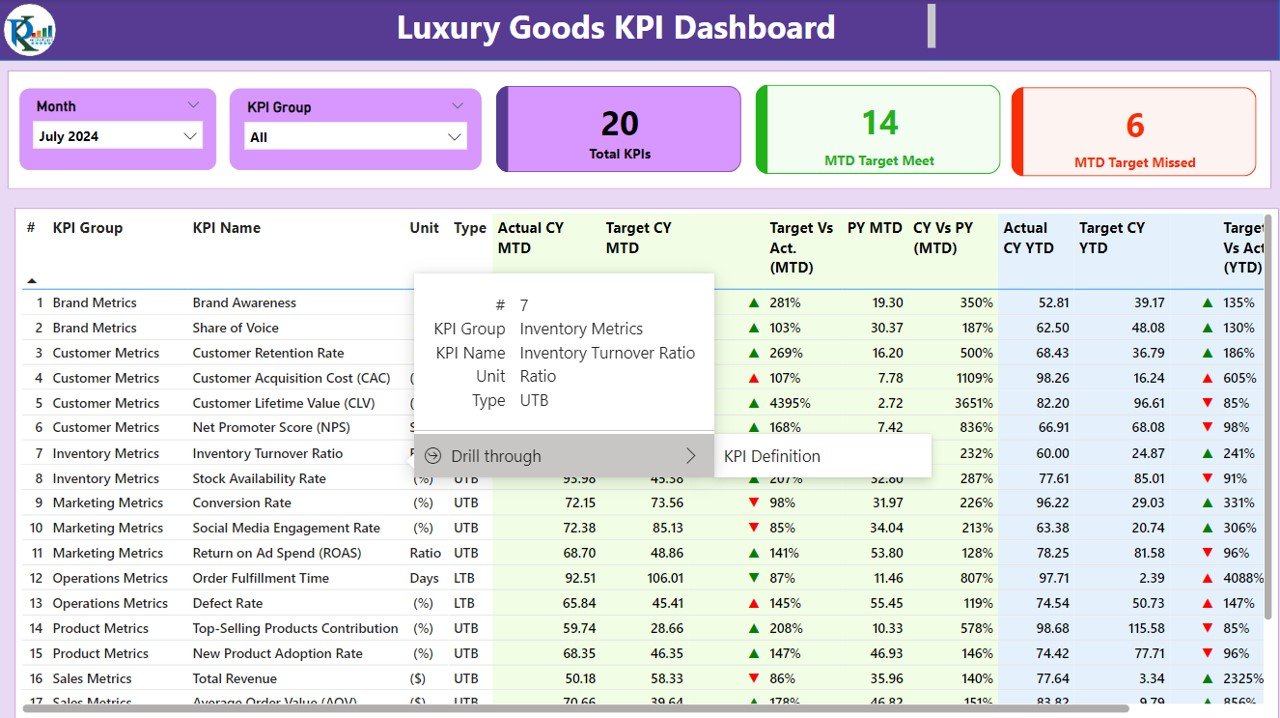
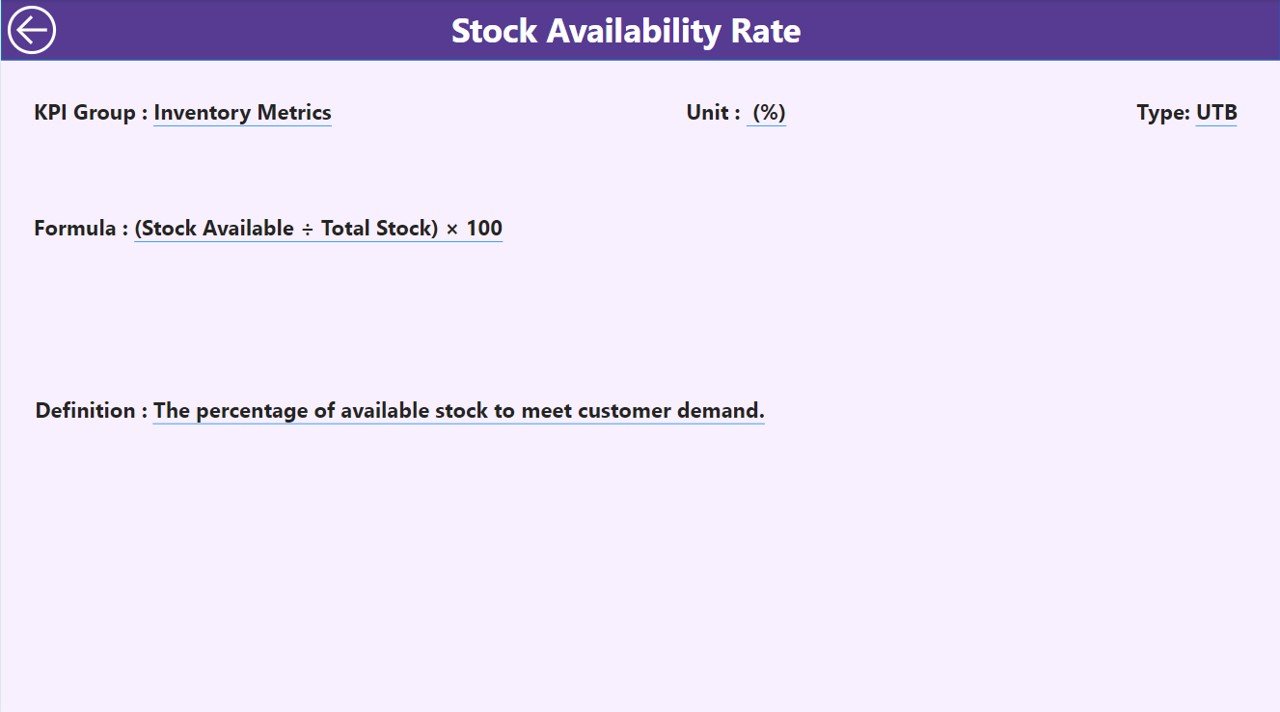
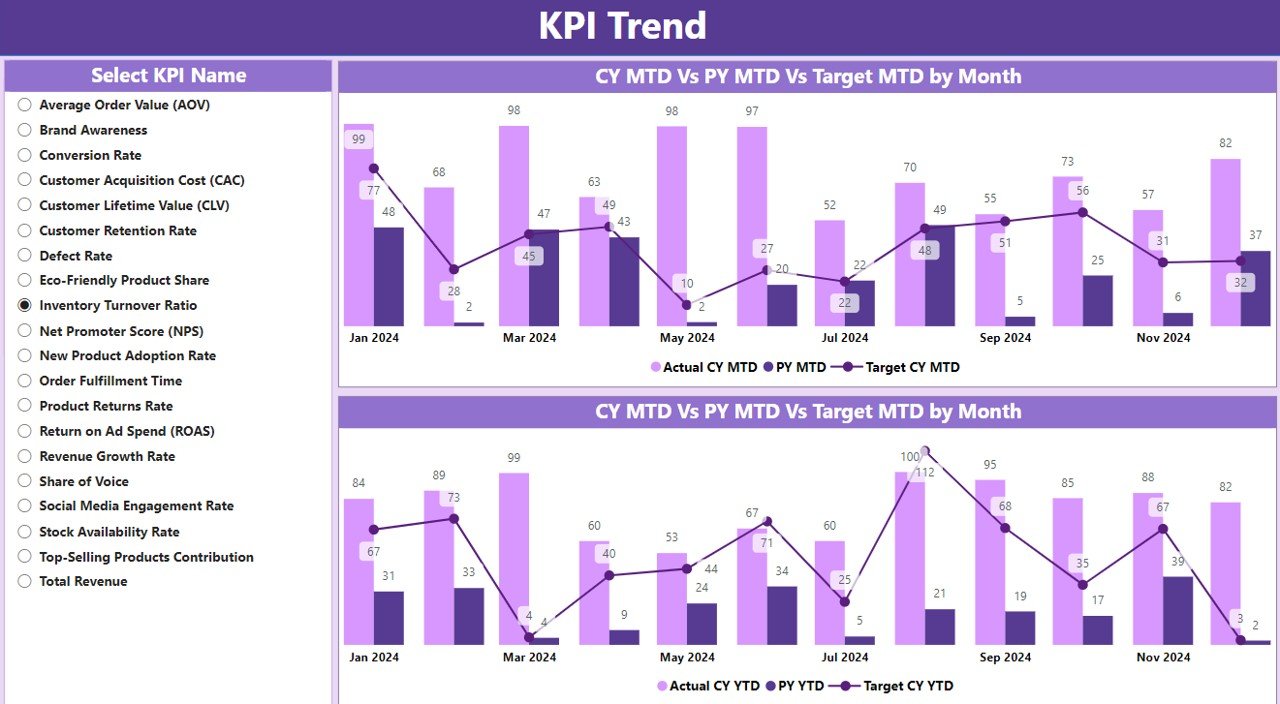
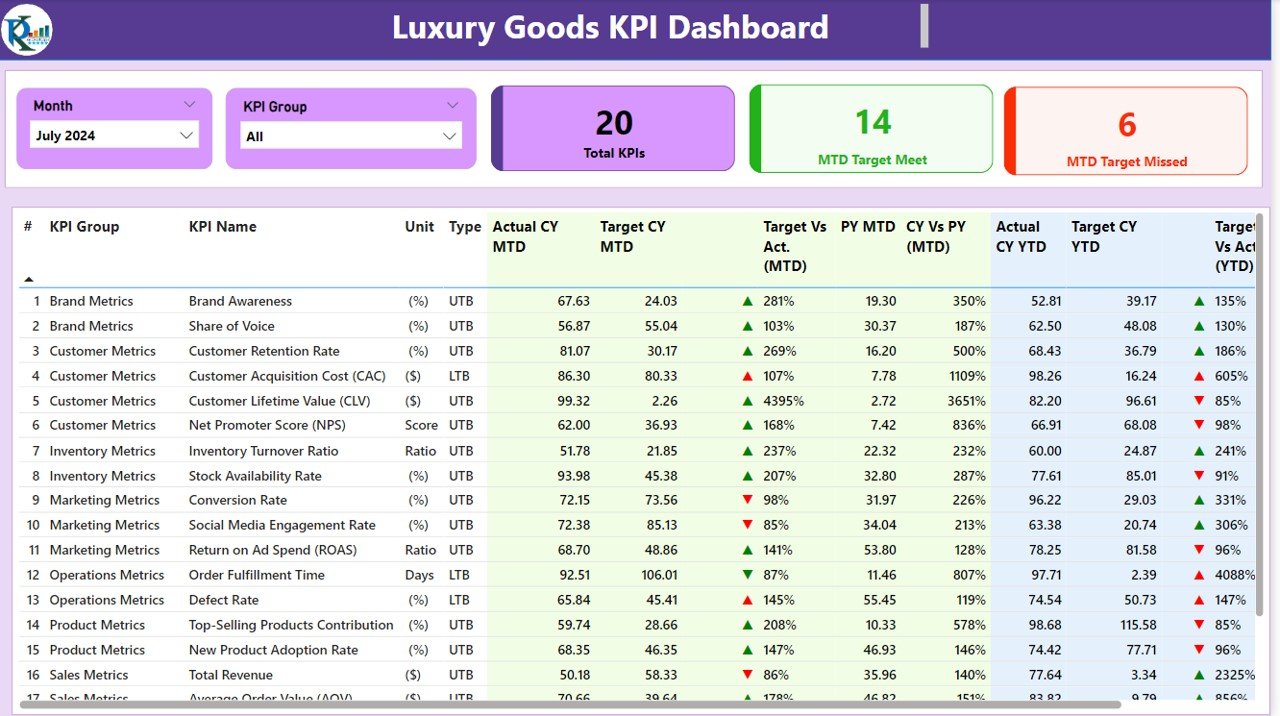
📦 Inventory and Stock Management
Track inventory levels, stock turnover rates, and product availability to ensure that you maintain optimal stock levels while minimizing excess inventory.
📊 Brand Awareness and Market Share
Monitor brand awareness, social media mentions, and market share to assess the success of your marketing efforts and brand positioning.
🚀 Why You’ll Love the Luxury Goods KPI Dashboard in Power BI:
✅ Track Sales Performance – Monitor sales trends, revenue, and product performance to ensure that your luxury goods are meeting sales targets.
✅ Analyze Profitability – Track profit margins for different products and categories to identify areas where you can increase profitability.
✅ Understand Customer Behavior – Use customer demographics and purchasing trends to tailor your marketing strategies and improve engagement.
✅ Optimize Inventory Management – Keep track of stock levels, turnover rates, and stockouts to ensure efficient inventory management and avoid excess inventory.
✅ Measure Brand Success – Monitor brand awareness, market share, and social media performance to evaluate your brand’s positioning and effectiveness of marketing campaigns.
✅ Customizable and Interactive – This Power BI dashboard is fully customizable, allowing you to adapt it to your specific luxury goods business needs.
What’s Inside the Luxury Goods KPI Dashboard in Power BI:
- Sales and Revenue Monitoring: Track total sales, revenue, and product category performance to evaluate which luxury goods are performing best.
- Profitability Analysis: Monitor the profitability of products, brands, and sales channels to ensure the most lucrative areas are prioritized.
- Customer Demographics and Behavior: Understand customer buying behavior, preferences, and purchasing frequency to tailor your marketing and product strategies.
- Inventory Tracking: Track stock levels, turnover rates, and product availability to manage inventory efficiently and avoid stockouts or overstocking.
- Brand Awareness and Market Share: Track brand mentions, social media engagement, and market share to measure the effectiveness of your marketing efforts and brand positioning.
- Custom Reports: Generate tailored reports summarizing sales performance, customer behavior, and inventory metrics for management or stakeholders.
How to Use the Luxury Goods KPI Dashboard in Power BI:
1️⃣ Download the Template – Instantly access your Power BI file upon purchase.
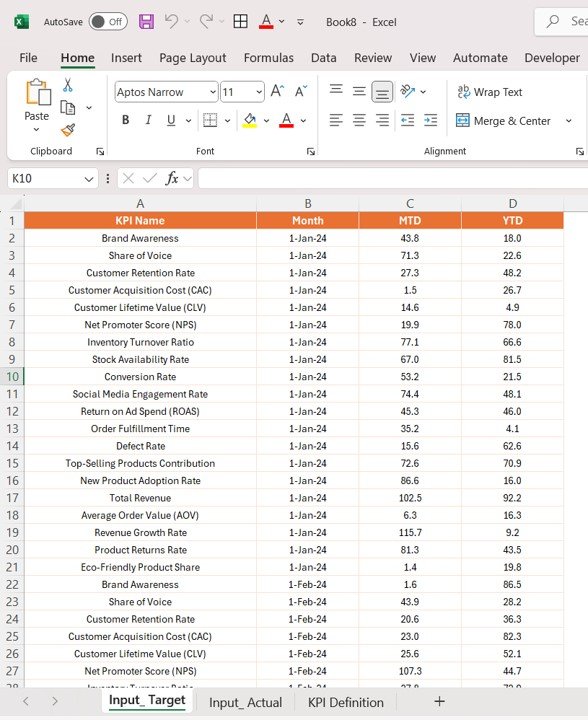
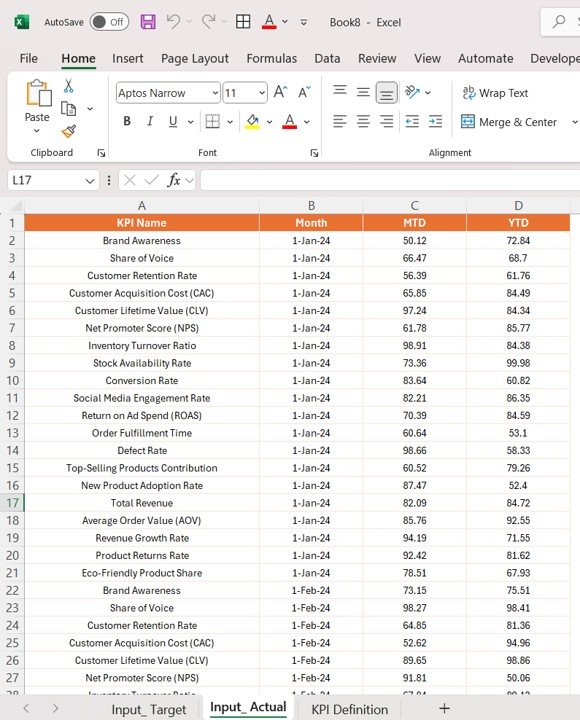
2️⃣ Input Data – Add sales, customer, inventory, and marketing data into the dashboard to begin tracking KPIs.
3️⃣ Monitor Key Metrics – Use the dashboard to track KPIs like sales trends, profitability, inventory levels, and customer behavior in real-time.
4️⃣ Analyze Trends and Insights – Use interactive charts and graphs to analyze sales performance, market trends, and customer engagement.
5️⃣ Generate Custom Reports – Create personalized reports for stakeholders, investors, or management to showcase the performance of your luxury goods brand.
Who Can Benefit from the Luxury Goods KPI Dashboard in Power BI:
- Luxury Brand Managers
- Business Owners in the Luxury Goods Industry
- Marketing Managers in Luxury Goods
- Retail Managers
- Sales Analysts
- E-commerce Managers for Luxury Brands
- Inventory and Supply Chain Managers
- Data Analysts
The Luxury Goods KPI Dashboard in Power BI is an essential tool for anyone managing or analyzing the performance of luxury goods brands. By tracking critical KPIs such as sales, customer behavior, inventory levels, and brand awareness, this dashboard provides all the insights you need to optimize your business performance.
Click here to read the Detailed blog post
https://www.pk-anexcelexpert.com/luxury-goods-kpi-dashboard-in-power-bi/
Visit our YouTube channel to learn step-by-step video tutorials
Youtube.com/@PKAnExcelExpert


Reviews
There are no reviews yet.