Luxury Goods Dashboard operate in a market where exclusivity, precision, and performance define success. While brand image and aesthetics attract customers, data-driven decisions protect margins and fuel growth. However, many luxury businesses still rely on scattered spreadsheets, static reports, and delayed analysis. As a result, leaders struggle to control discounts, understand regional demand, and measure true profitability.
That is exactly where the Luxury Goods Dashboard in Excel becomes an essential business tool 💎📊.
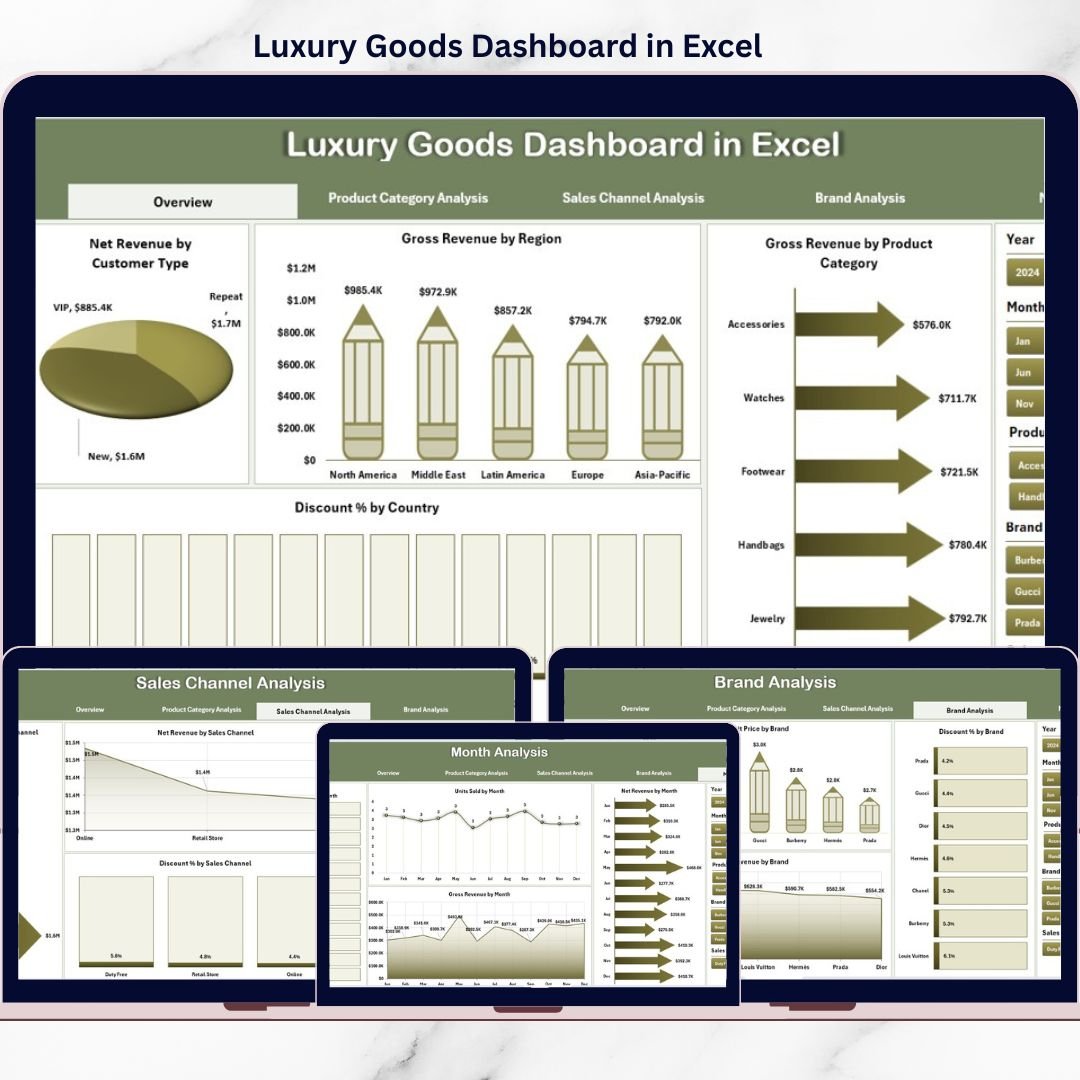
This ready-to-use Excel dashboard converts raw luxury sales data into clear KPIs, interactive visuals, and actionable insights. Instead of digging through endless rows of numbers, decision-makers gain instant visibility into revenue, discounts, units sold, pricing trends, and brand performance—all in one professional dashboard.
Built entirely in Excel, this dashboard combines simplicity, flexibility, and executive-level analytics, making it ideal for luxury brands that demand clarity without complexity.
## Key Features of Luxury Goods Dashboard in Excel 🚀
This dashboard is designed to support smarter, faster, and more profitable luxury decisions.
📊 Centralized Luxury Performance Tracking
Analyze revenue, discounts, pricing, and volume across brands, categories, channels, and regions.
🎛️ Interactive Right-Side Slicers
Filter data instantly by brand, product category, sales channel, region, customer type, or month.
📈 Executive KPI Cards
Get instant visibility into key performance metrics at a glance.
📉 Discount Control Analysis
Track discount percentages by country, brand, category, and channel to protect brand value.
📦 Product & Brand-Level Insights
Understand which brands and categories drive profitability—and which need attention.
📅 Monthly & Seasonal Trend Analysis
Monitor performance patterns over time to support forecasting and planning.
💡 100% Excel-Based Solution
No BI tools, no complex setup—works seamlessly in Excel.
## What’s Inside the Luxury Goods Dashboard in Excel 📂
This dashboard includes multiple well-structured analysis pages, each designed for a specific business question.
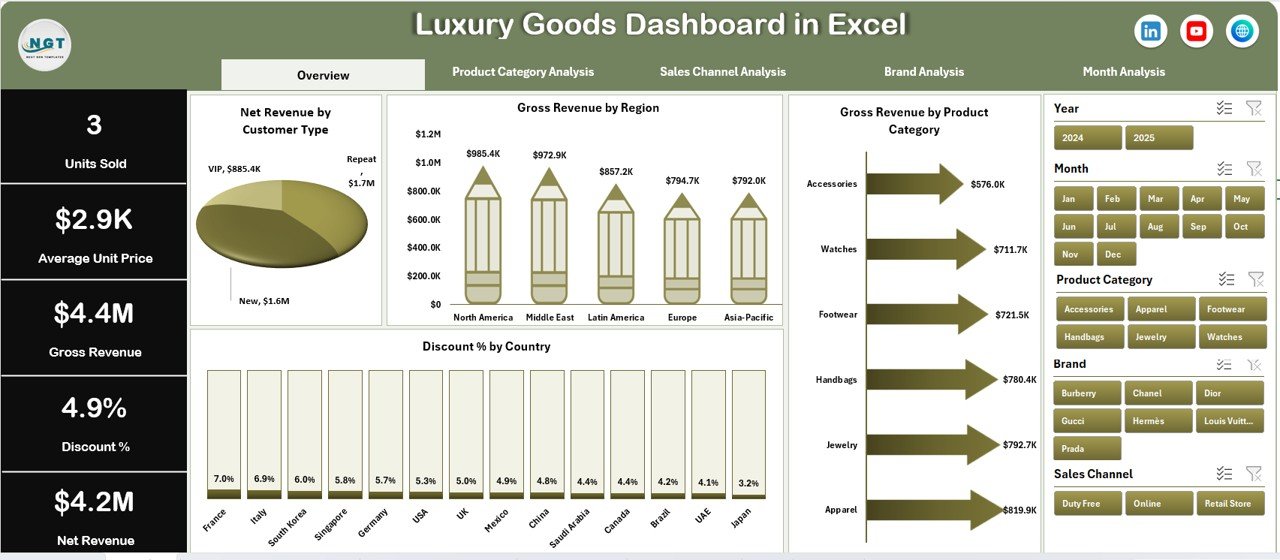
🟦 Overview Page
Acts as the command center with KPI cards and high-level charts showing revenue, discounts, and category performance.
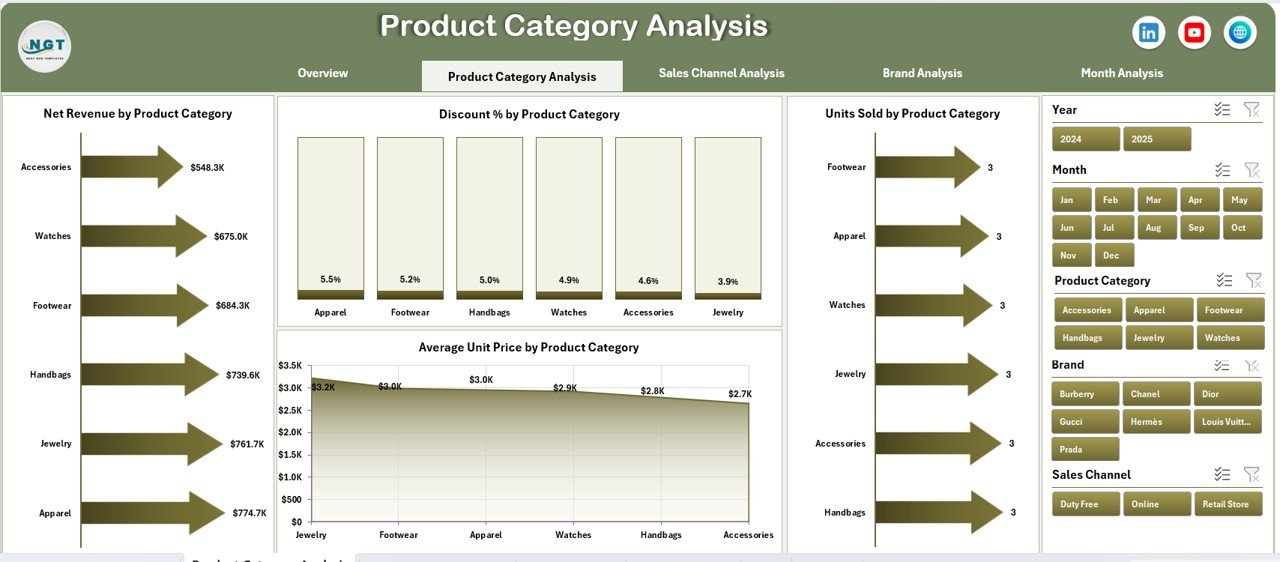
🟦 Product Category Analysis Page
Compares net revenue, discount %, units sold, and average unit price across product categories.
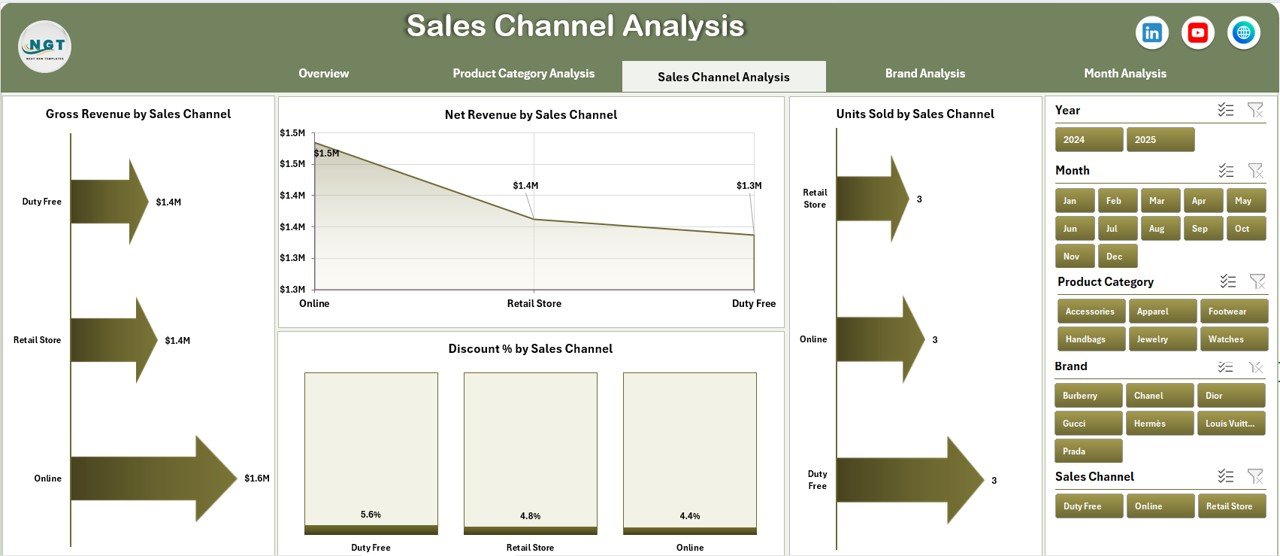
🟦 Sales Channel Analysis Page
Analyzes channel-wise performance, helping brands optimize boutiques, online stores, and partner channels.
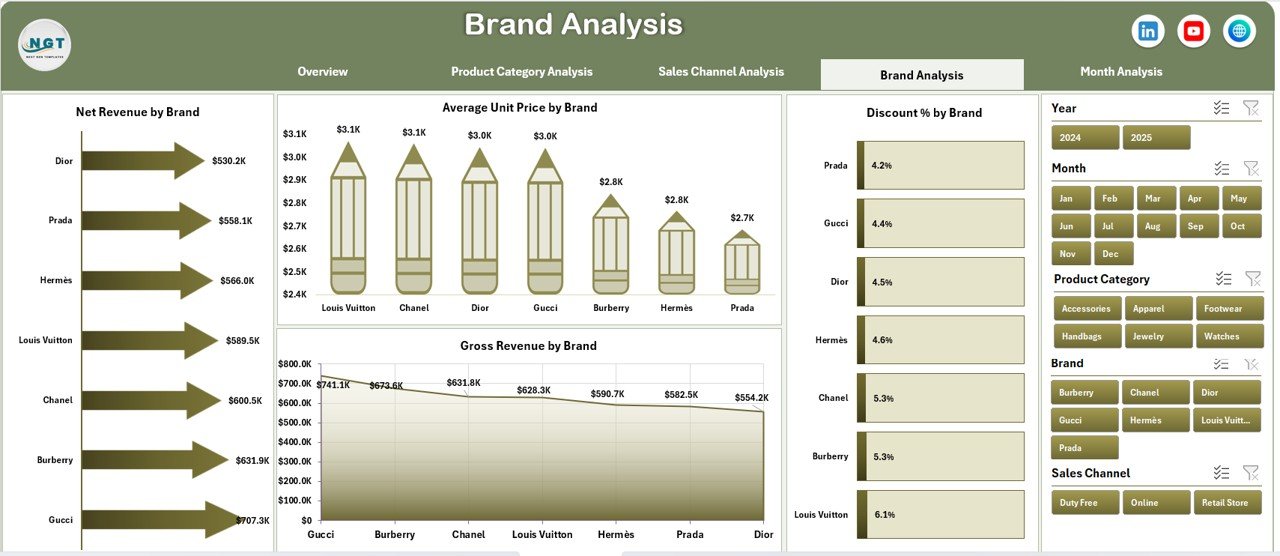
🟦 Brand Analysis Page
Provides brand-level comparison for revenue, pricing strength, and discount exposure.
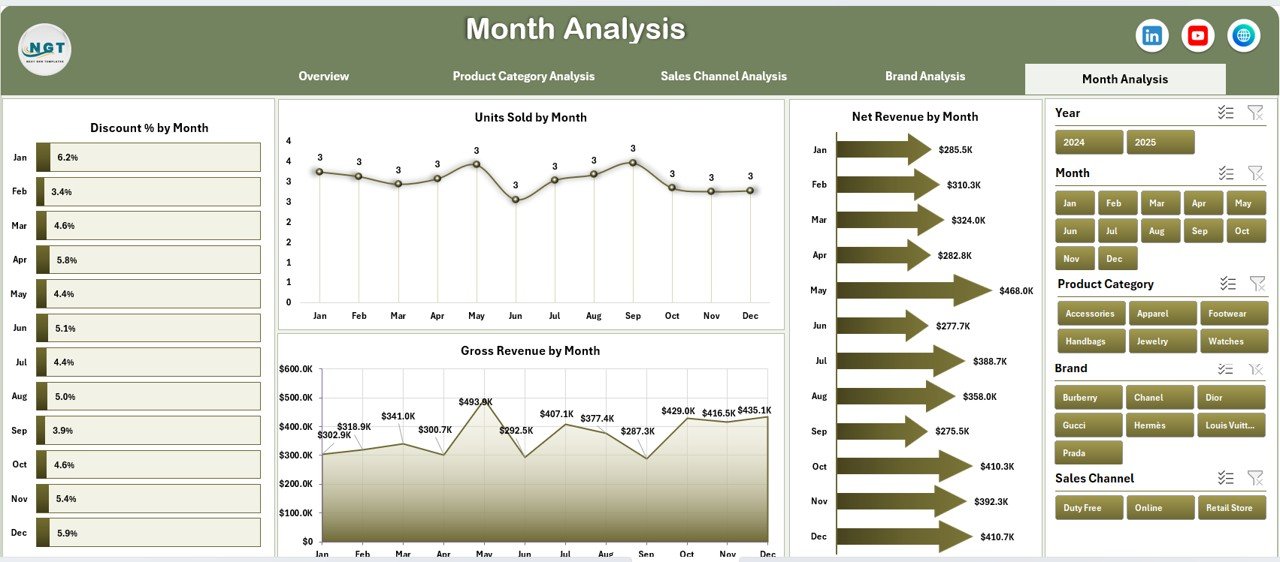
🟦 Month Analysis Page
Tracks monthly trends for revenue, units sold, and discounts to identify seasonality and demand shifts.
🟦 Data Sheet
Stores raw transactional data such as brand, category, channel, region, units sold, gross revenue, discount %, and net revenue.
🟦 Support Sheet
Handles calculations and mappings to keep the dashboard clean and scalable.
Together, these sheets create a complete luxury analytics ecosystem.
## How to Use the Luxury Goods Dashboard in Excel 🧩
Using the dashboard is simple and intuitive:
1️⃣ Update the Data Sheet with your sales data
2️⃣ Refresh Pivot Tables if required
3️⃣ Use slicers to filter insights dynamically
4️⃣ Analyze charts and KPIs instantly
5️⃣ Use insights for pricing, discount, and strategy decisions
Excel automatically updates all visuals, allowing teams to focus on strategy—not reporting.
## Who Can Benefit from This Luxury Goods Dashboard in Excel 👥
This dashboard is ideal for:
✔️ Luxury Brand Owners & Founders
✔️ Retail & Sales Strategy Teams
✔️ Marketing & Pricing Managers
✔️ Finance & Revenue Controllers
✔️ Business Analysts
✔️ Consultants Serving Luxury Clients
Whether managing a single brand or a multi-brand portfolio, this dashboard adapts easily.
### Click here to read the Detailed blog post
Visit our YouTube channel to learn step-by-step video tutorials
👉 YouTube.com/@PKAnExcelExpert


Reviews
There are no reviews yet.