
Loan recovery operations demand accuracy, speed, and accountability. Recovery managers must continuously monitor collection efficiency, recovery targets, portfolio performance, and historical trends. Loan Recovery Services KPI Dashboard in Power BI However, when recovery data remains scattered across spreadsheets and manual reports, teams struggle to identify bottlenecks and improve outcomes.
The Loan Recovery Services KPI Dashboard in Power BI is built to solve this exact problem.
This ready-to-use Power BI dashboard converts structured Excel data into clear, interactive, and decision-ready visuals. It helps banks, NBFCs, and recovery agencies track MTD and YTD recovery performance, compare targets vs actuals, analyze previous year trends, and instantly identify underperforming recovery KPIs. Loan Recovery Services KPI Dashboard in Power BI With visual indicators, trend charts, and drill-through definitions, this dashboard transforms raw recovery numbers into confident, data-driven actions 🚀.
Whether you manage a small recovery team or a large institutional portfolio, this dashboard becomes your central command center for loan recovery performance.
Key Features of the Loan Recovery Services KPI Dashboard in Power BI 🔑
This dashboard is designed for clarity, control, and speed:
📊 Centralized Recovery KPI Monitoring – All recovery KPIs in one view
🎯 MTD & YTD Performance Tracking – Monitor short-term and long-term results
📉 Target vs Actual Analysis – Instantly spot recovery gaps
📈 CY vs PY Comparison – Measure real improvement year over year
🚦 Performance Icons (▲▼) – Identify risks and wins at a glance
🔍 Interactive Slicers – Filter by Month and KPI Group
📌 Drill-Through KPI Definitions – Full transparency, zero confusion
⚡ Excel-Driven Data Model – Easy to maintain, powerful to analyze
This dashboard is not just a report—it is a loan recovery performance management system.
What’s Inside the Loan Recovery Services KPI Dashboard in Power BI 📂
The Power BI file includes three structured analytical pages, each serving a clear purpose.
📌 1. Summary Page – Recovery Performance Overview
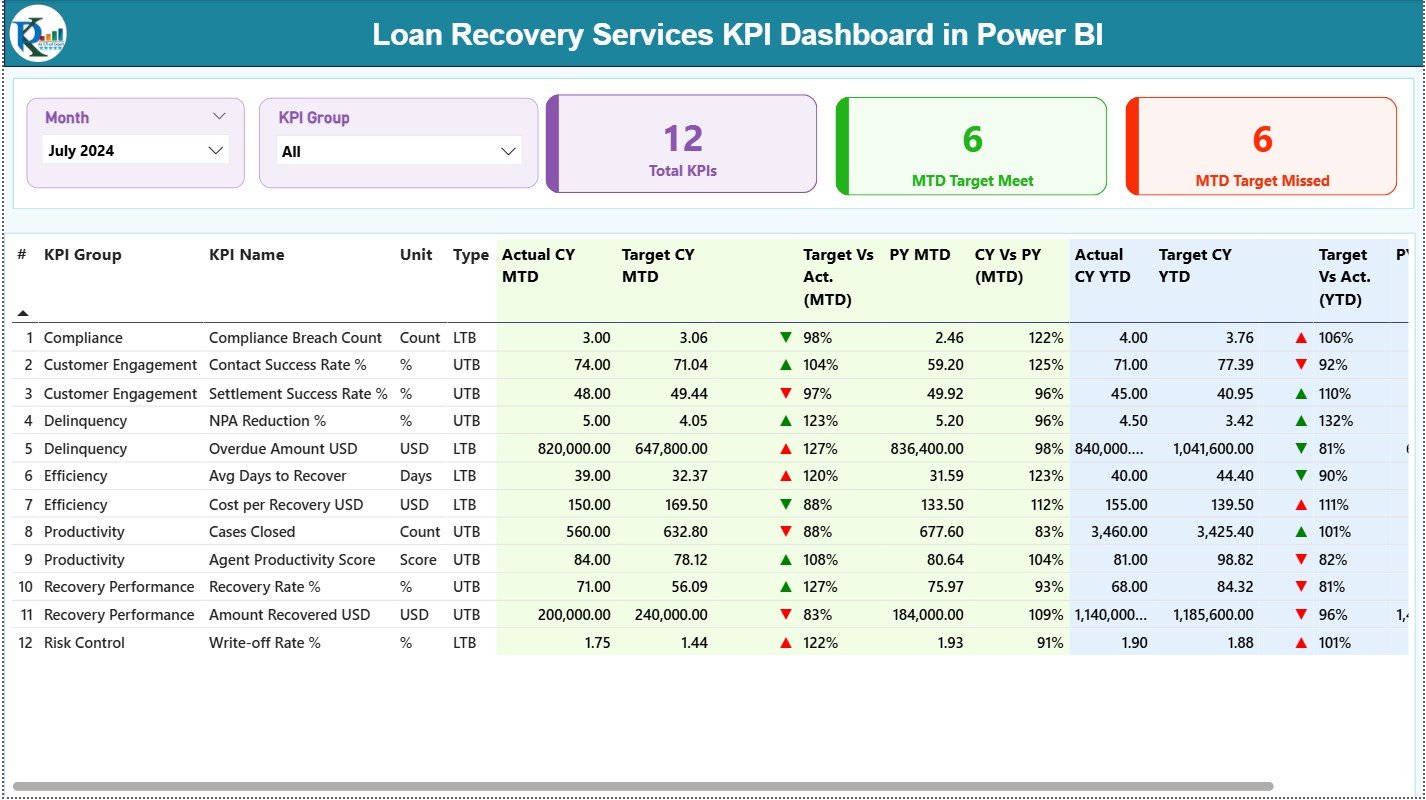
This is the main control page for recovery monitoring.
It includes:
🔹 Month slicer and KPI Group slicer
🔹 KPI Cards showing:
-
Total KPIs Count
-
MTD Target Met Count
-
MTD Target Missed Count
🔹 A detailed KPI table with:
-
KPI Number, Group, Name, Unit, Type (UTB / LTB)
-
Actual CY MTD & Target CY MTD
-
Target vs Actual % (MTD)
-
Previous Year MTD & CY vs PY (MTD)
-
Actual CY YTD & Target CY YTD
-
Target vs Actual % (YTD)
-
Previous Year YTD & CY vs PY (YTD)
-
Visual up/down performance indicators
This page allows leadership to instantly see which recovery areas need attention.
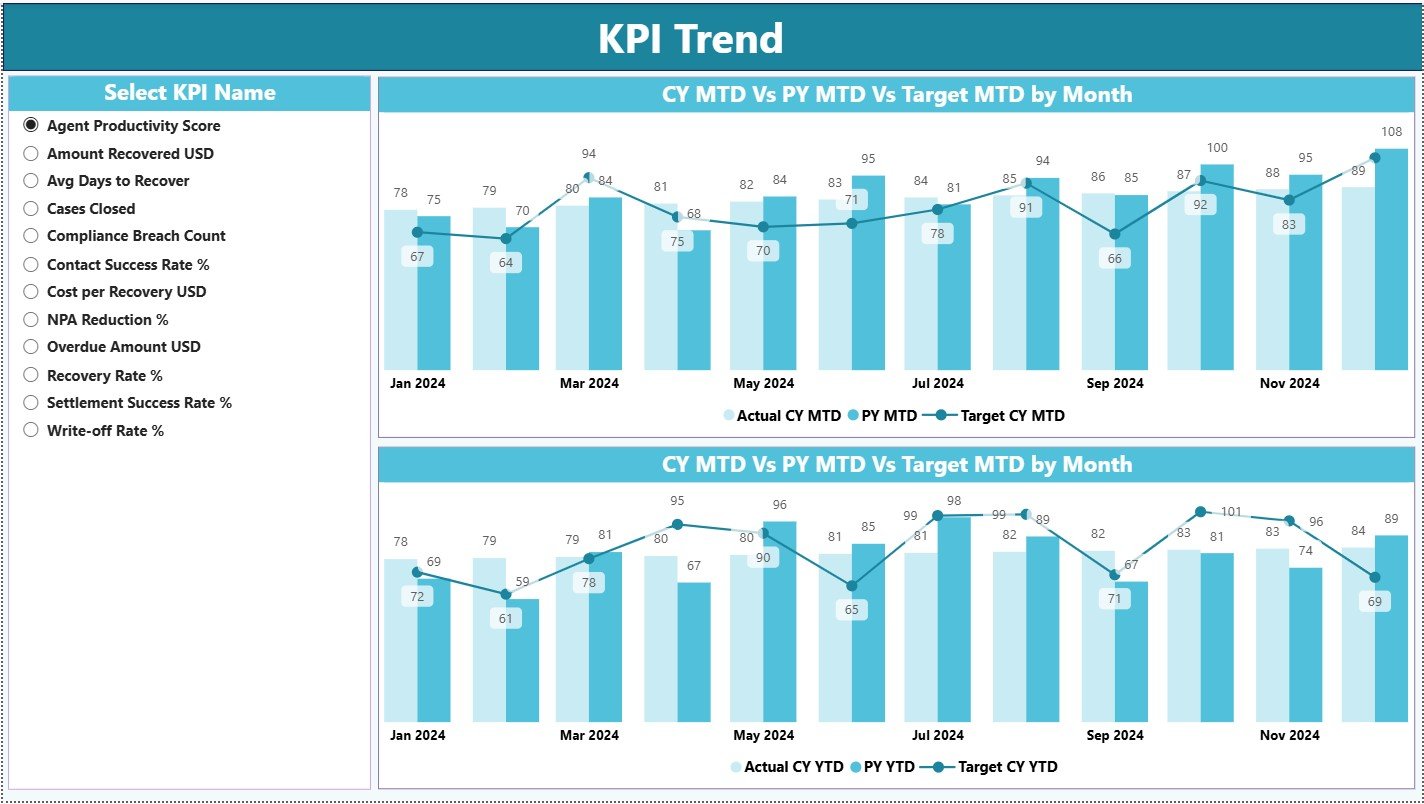
📌 2. KPI Trend Page – Recovery Trends Over Time
This page focuses on trend-based insights, which are critical for recovery planning.
It includes:
📈 MTD Trend Combo Chart – Actual CY vs PY vs Target
📉 YTD Trend Combo Chart – Actual CY vs PY vs Target
🎯 KPI Name slicer for focused KPI analysis
Trend analysis helps teams:
✔ Detect early recovery issues
✔ Understand consistency and seasonality
✔ Improve recovery forecasting
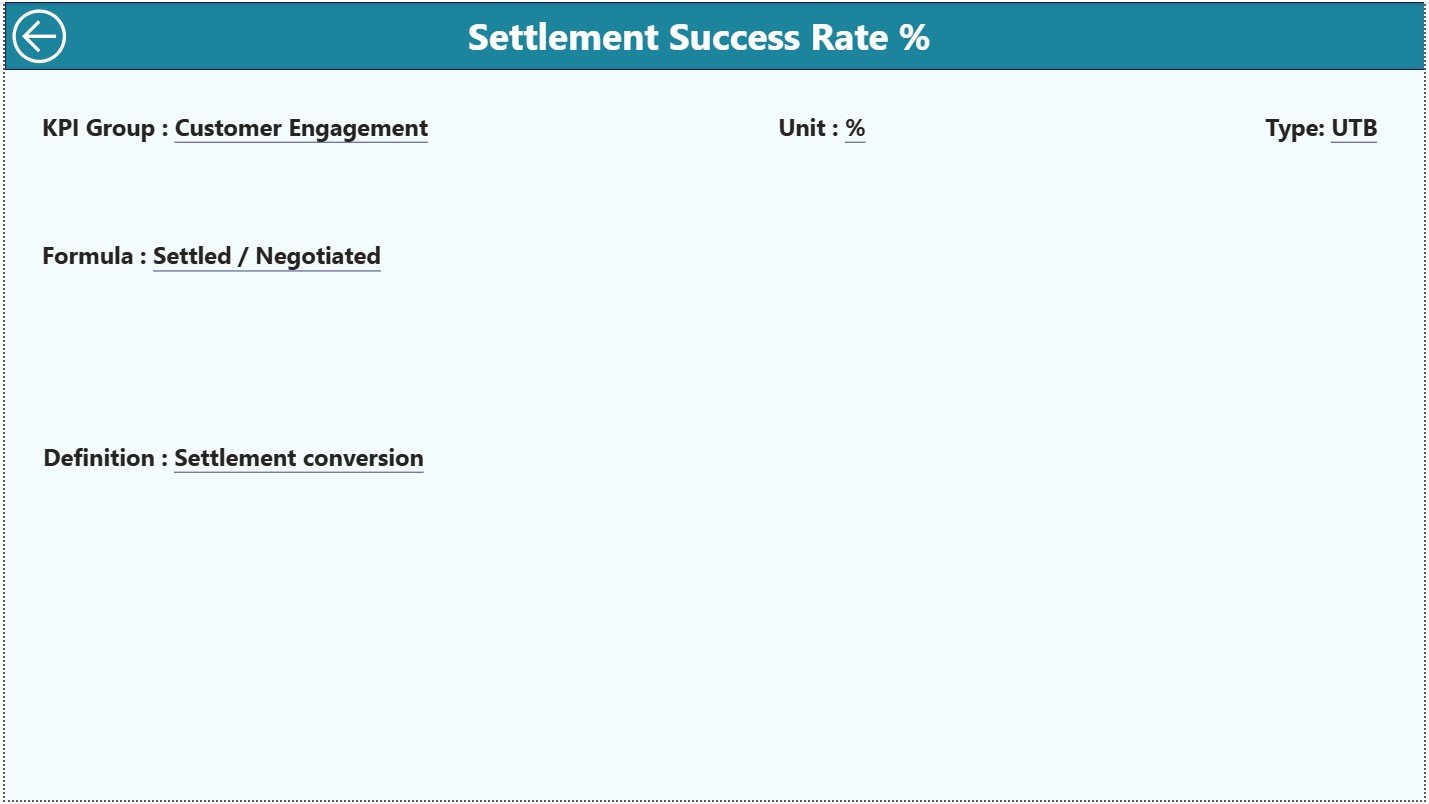
📌 3. KPI Definition Page – Complete KPI Clarity
This hidden drill-through page ensures standard interpretation across teams.
It displays:
📘 KPI Formula
📘 KPI Definition
📘 KPI Unit
📘 KPI Type (LTB / UTB)
A back button allows easy navigation to the Summary Page.
How to Use the Loan Recovery Services KPI Dashboard in Power BI 🛠️
Using the dashboard is straightforward:
1️⃣ Enter actual recovery values in the Input_Actual Excel sheet
2️⃣ Enter target values in the Input_Target Excel sheet
3️⃣ Maintain KPI logic in the KPI Definition sheet
4️⃣ Refresh Power BI
5️⃣ Use slicers to analyze MTD, YTD, and trends
6️⃣ Drill through KPIs for deeper understanding
No advanced Power BI skills required 💡.
Who Can Benefit from This Loan Recovery Dashboard? 👥
This dashboard is ideal for:
💳 Loan Recovery Managers
📊 Collection Team Leaders
⚖️ Risk & Compliance Teams
💰 Finance Departments
📈 Senior Management
📉 Business & Recovery Analysts
Any organization focused on improving recovery efficiency will benefit.


Reviews
There are no reviews yet.