Legal Advisory KPI Dashboard teams operate at the intersection of risk, compliance, strategy, and accountability. They manage contracts, litigation, regulatory filings, internal advisory requests, and high-impact decisions every day. However, despite their critical role, legal performance often remains difficult to measure. Many teams still rely on emails, manual trackers, or static spreadsheets. As a result, leadership lacks visibility, and legal teams struggle to demonstrate value.
That is exactly where the Legal Advisory KPI Dashboard in Excel delivers real impact ⚖️📊.
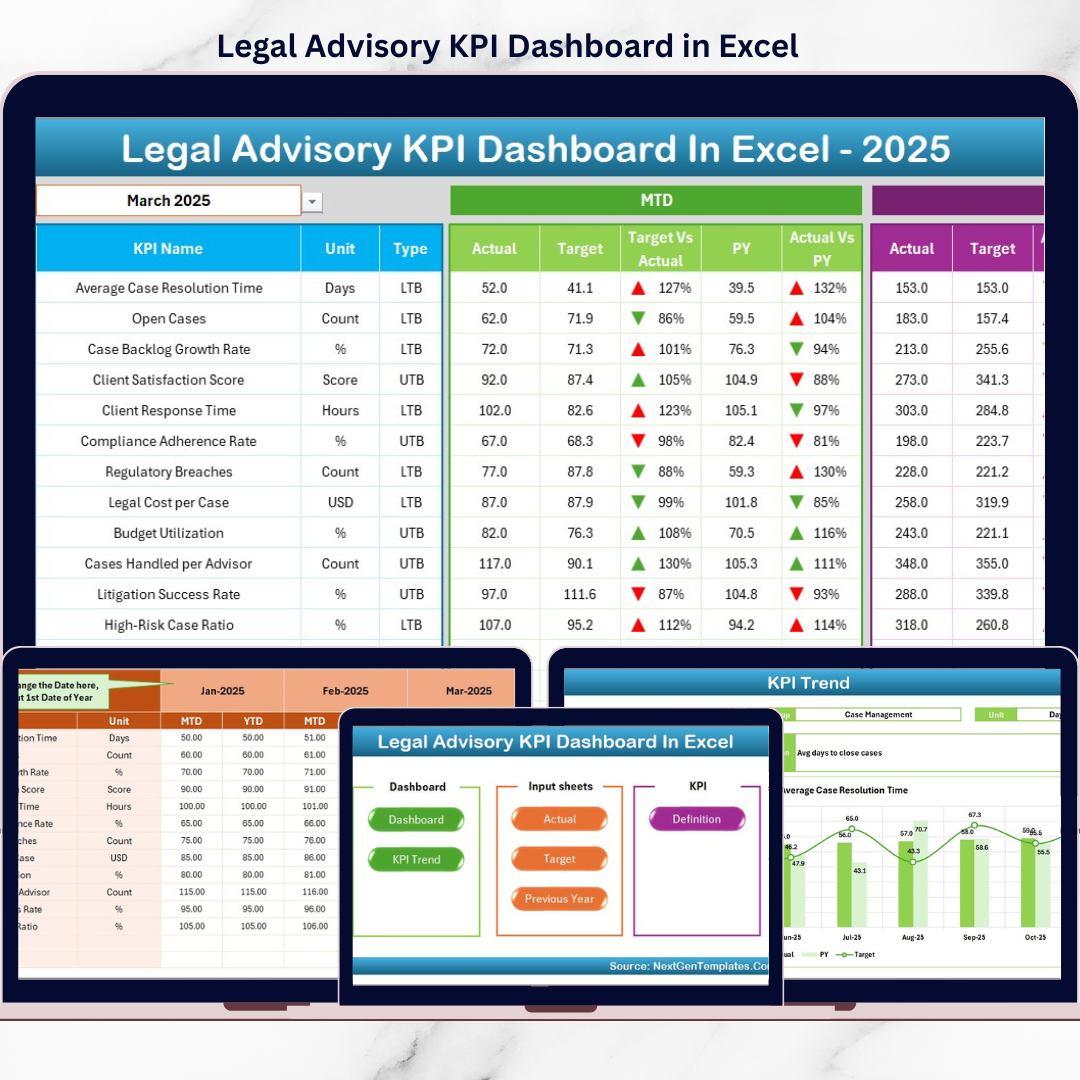
This ready-to-use Excel dashboard transforms complex legal operations into clear KPIs, automated comparisons, and actionable insights. Instead of reactive reporting, legal teams gain a centralized, structured, and visual performance management system—built entirely in Excel.
Designed for clarity, control, and credibility, this dashboard helps legal teams move from intuition-based management to data-driven legal governance.
## Key Features of Legal Advisory KPI Dashboard in Excel 🚀
This dashboard is purpose-built to measure and manage legal performance effectively.
📊 Centralized Legal KPI Tracking
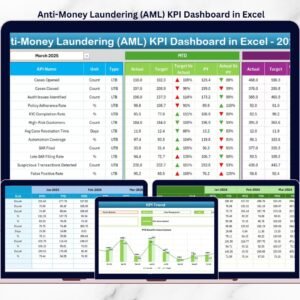
Monitor contracts, litigation, compliance, turnaround time, and advisory performance in one place.
📅 Dynamic Month Selection
Change the reporting month using a drop-down, and the entire dashboard updates automatically.
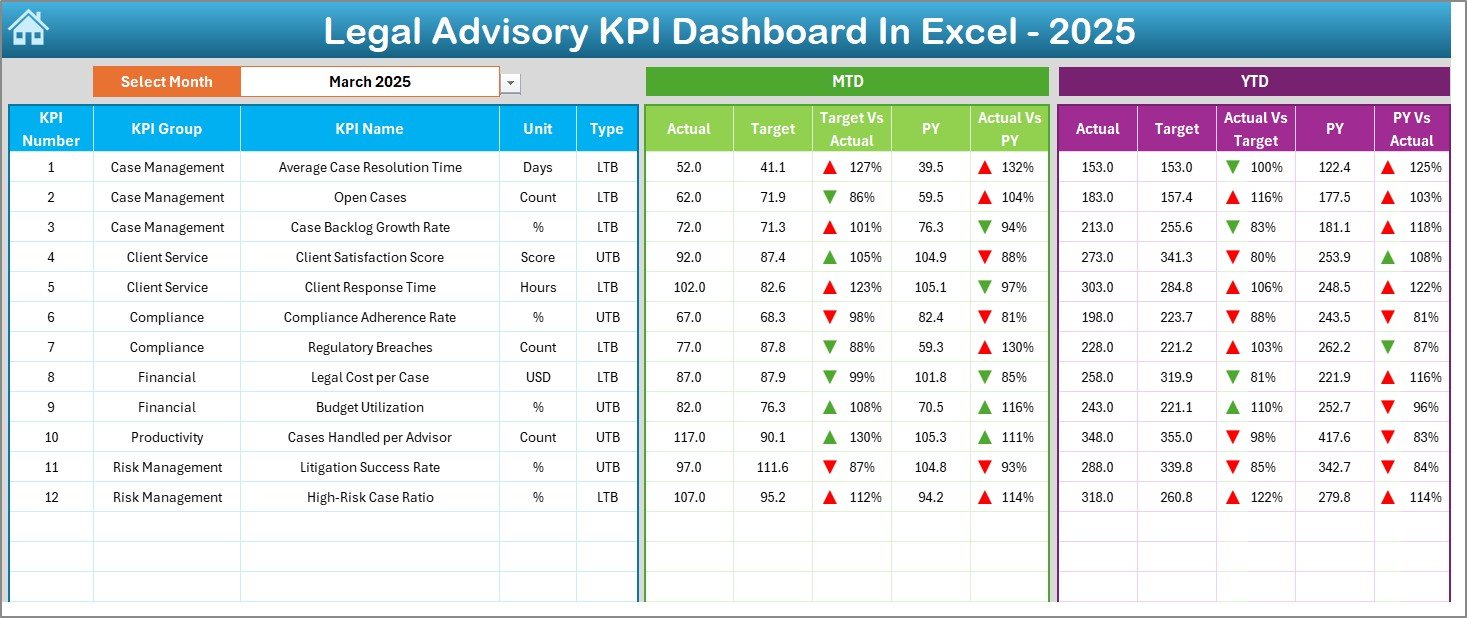
📈 MTD & YTD Performance Analysis
Track Month-to-Date and Year-to-Date actuals against targets and previous-year benchmarks.
🚦 Visual Performance Indicators
Up and down arrows instantly highlight improvements, delays, or risks.
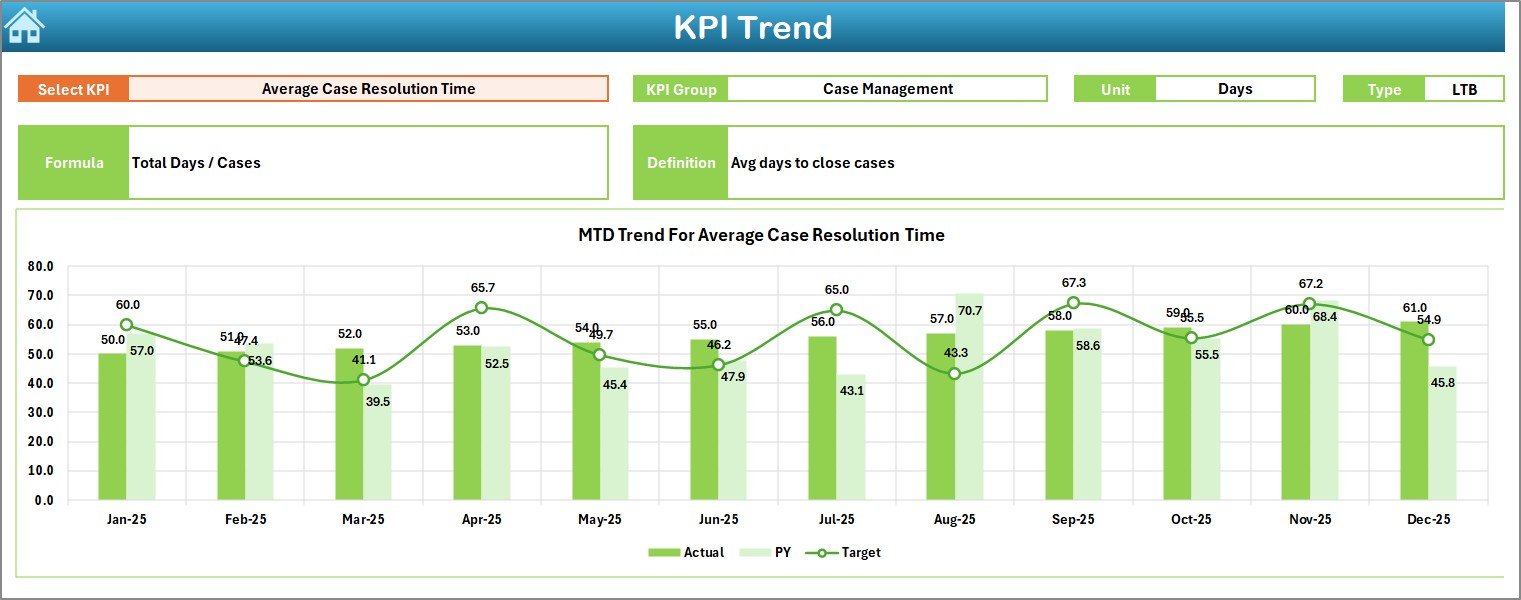
📉 KPI Trend Analysis
Analyze KPI behavior over time using MTD and YTD trend charts.
🧭 Executive-Friendly Navigation
One-click buttons allow users to jump between sheets effortlessly.
💡 100% Excel-Native Solution
No BI tools required—easy to adopt, customize, and maintain.
## What’s Inside the Legal Advisory KPI Dashboard in Excel 📂
This dashboard includes 7 professionally designed worksheets, each supporting a specific legal management function.
🟦 Home Sheet
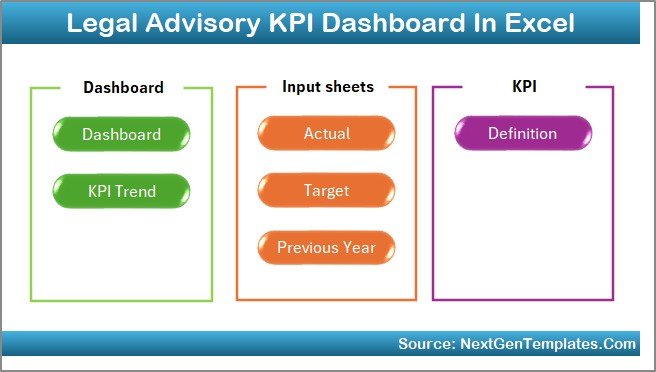
Acts as the index page with 6 navigation buttons for quick access to all sections.
🟦 Dashboard Sheet
The main performance view showing MTD and YTD Actual vs Target and Actual vs Previous Year with visual indicators.
🟦 KPI Trend Sheet
Allows deep-dive analysis for a selected KPI, including KPI group, unit, type (LTB/UTB), formula, definition, and trend charts.
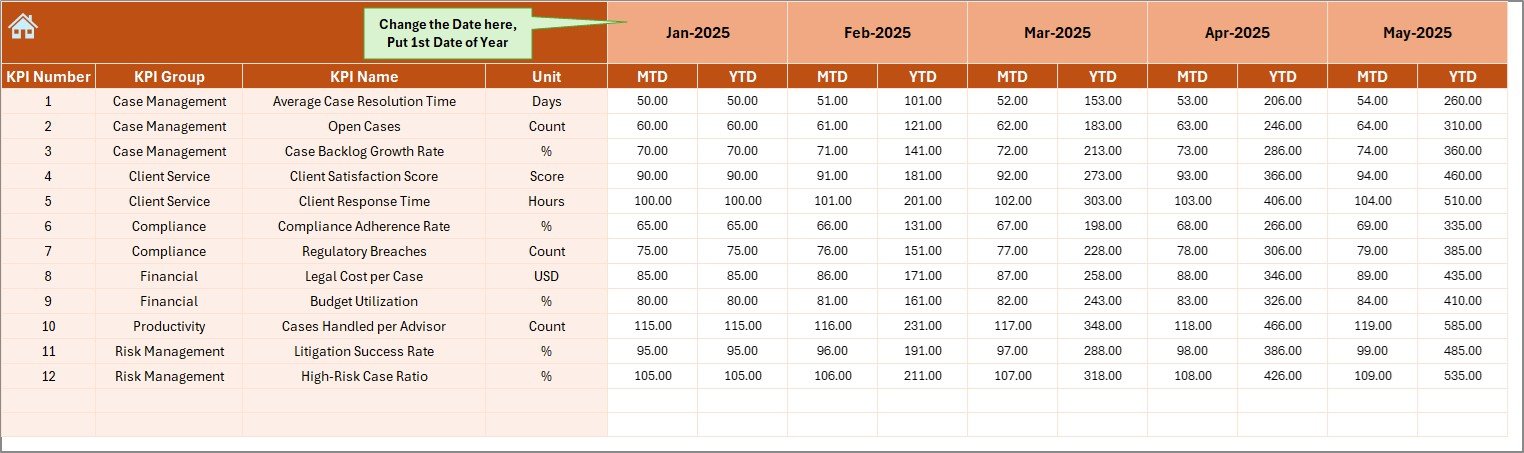
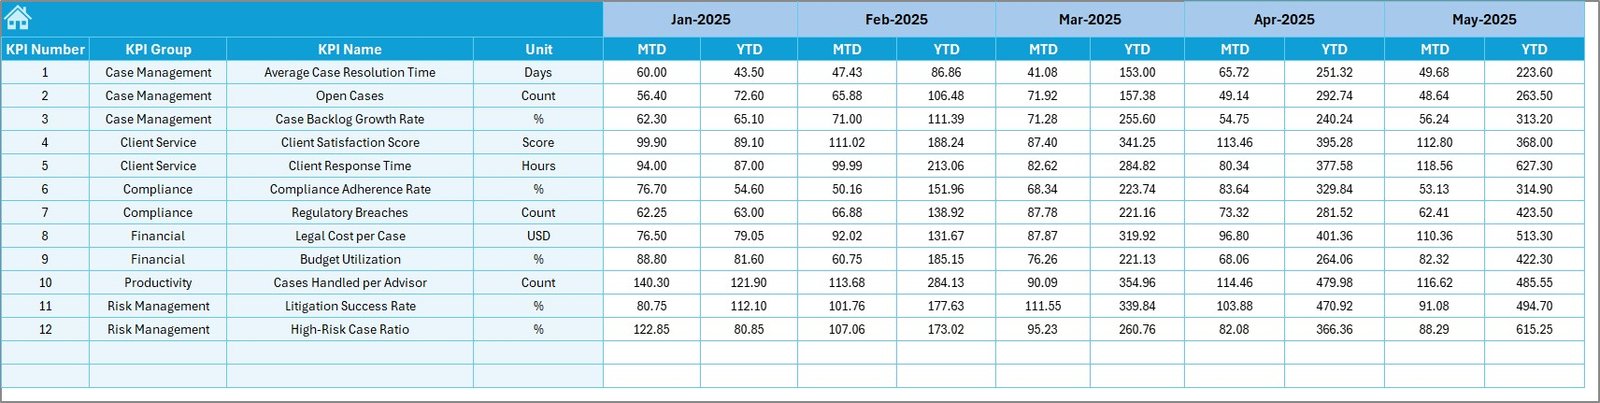
🟦 Actual Numbers Input Sheet
Captures MTD and YTD actual performance values with smart month control to reduce data entry effort.
🟦 Target Sheet
Stores monthly and cumulative legal KPI targets for structured goal tracking.
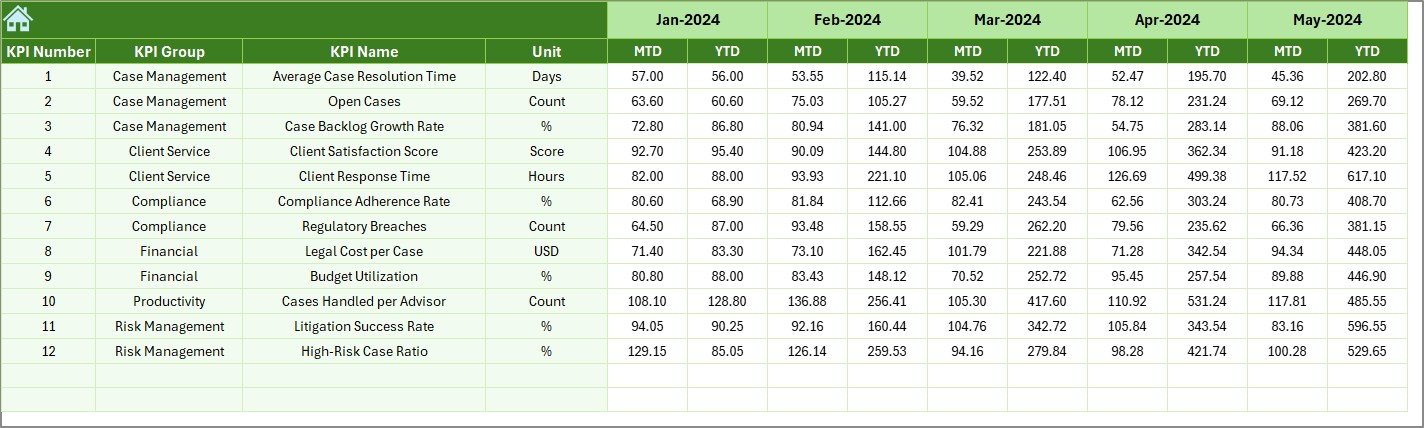
🟦 Previous Year Numbers Sheet
Enables year-over-year comparison to measure progress and recurring issues.
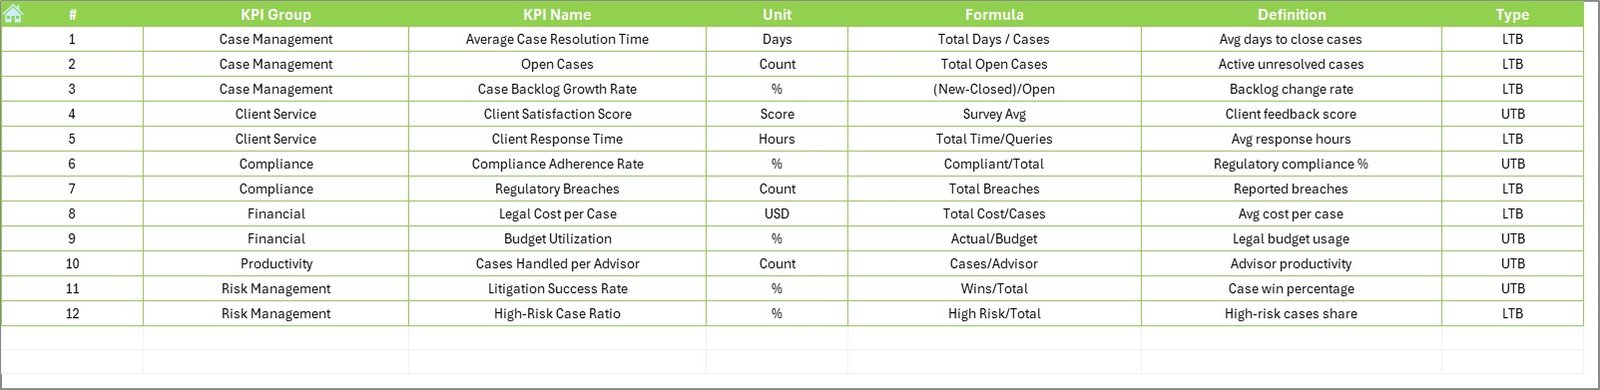
🟦 KPI Definition Sheet
Maintains KPI name, group, unit, formula, definition, and type to ensure clarity and consistency.
Together, these sheets create a complete legal performance management framework.
## How to Use the Legal Advisory KPI Dashboard in Excel 🧩
Using the dashboard is simple and intuitive:
1️⃣ Define KPIs in the KPI Definition Sheet
2️⃣ Enter actual MTD and YTD values in the Actual Numbers sheet
3️⃣ Set targets in the Target Sheet
4️⃣ Add previous-year data for comparison
5️⃣ Select the reporting month and review dashboards instantly
Excel automatically handles calculations, comparisons, and visuals—so teams focus on legal strategy, not reporting.
## Who Can Benefit from This Legal Advisory KPI Dashboard in Excel 👥
This dashboard is ideal for:
✔️ Legal Advisory Teams
✔️ Corporate Legal Departments
✔️ Law Firms
✔️ Compliance & Risk Officers
✔️ Legal Operations Managers
✔️ General Counsels & Leadership Teams
Because it is Excel-based, both technical and non-technical users can adopt it quickly.
### Click here to read the Detailed blog post
Visit our YouTube channel to learn step-by-step video tutorials
👉 YouTube.com/@PKAnExcelExpert


Reviews
There are no reviews yet.