


Organizations today invest heavily in employee training, professional development, and skill enhancement programs. Because businesses operate in highly competitive environments, they must continuously improve employee knowledge and capabilities. Learning and Development (L&D) initiatives help organizations strengthen workforce skills, increase productivity, and support long-term growth.Learning & Development KPI Dashboard in Google Sheets
However, simply running training programs is not enough. Companies must measure the effectiveness of their learning initiatives. Without proper monitoring, HR teams cannot determine whether training investments actually improve employee performance.
Many organizations still rely on scattered spreadsheets and manual reports to track training activities. As a result, it becomes difficult to analyze training performance, compare results with targets, or evaluate learning improvements over time.
That is where the Learning & Development KPI Dashboard in Google Sheets becomes extremely valuable.
This ready-to-use template helps HR professionals and training managers track employee development performance using structured key performance indicators (KPIs). The dashboard compares Actual results, Target values, and Previous Year performance, allowing organizations to evaluate training effectiveness clearly.
Because the template includes automated KPI calculations, performance comparison indicators, and historical trend analysis, HR teams can easily monitor learning performance and make better workforce development decisions.
If you want a structured and efficient way to measure employee training results, this Google Sheets KPI dashboard offers the perfect solution.
📊 Key Feature of Learning & Development KPI Dashboard in Google Sheets
This powerful dashboard includes several features designed to simplify training performance monitoring.
📅 Dynamic Monthly Analysis – Select any month from the dropdown to update the entire dashboard automatically.
📊 MTD & YTD Performance Tracking – Monitor both monthly training performance and cumulative yearly results.
📈 Target vs Actual Comparison – Evaluate whether training KPIs meet organizational goals.
📉 Previous Year Comparison – Compare current learning results with historical performance.
🔺 Conditional Formatting Indicators – Up and down arrows highlight performance improvements or declines.
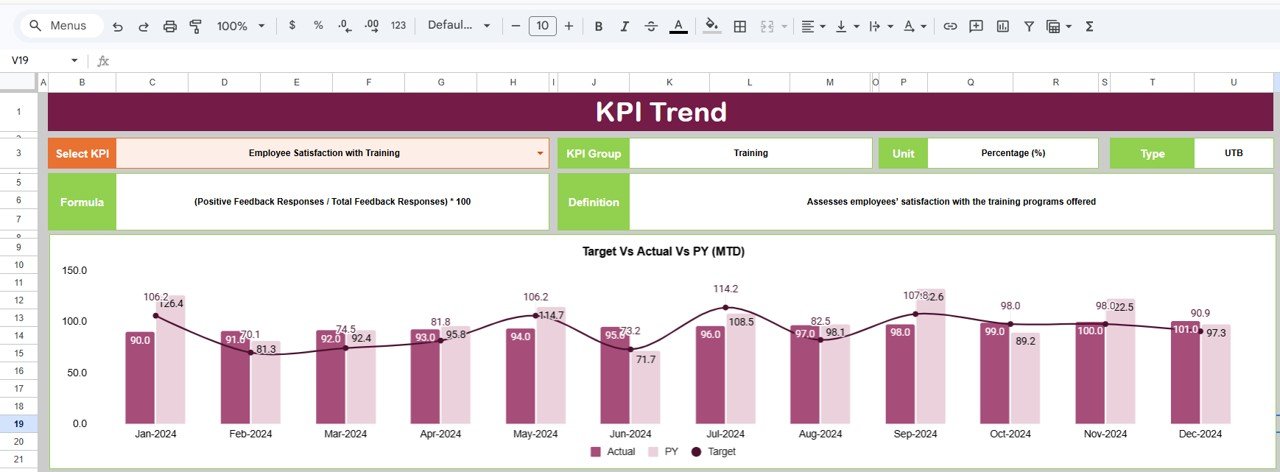
📊 KPI Trend Analysis Charts – Visual charts display training KPI performance over time.
🧾 Detailed KPI Documentation – Each KPI includes unit, formula, definition, and performance direction.
📥 Simple Data Input Structure – Enter training data easily using organized input sheets.
📂 Structured KPI Management System – Manage KPI definitions, targets, and historical values efficiently.
Because of these features, HR teams can monitor training performance quickly and identify improvement opportunities.
📦 What’s Inside the Learning & Development KPI Dashboard in Google Sheets
This dashboard includes six structured worksheets that organize training data, KPI definitions, and performance analysis.
Inside the template you will find:
✅ Dashboard Sheet – Main KPI monitoring dashboard
✅ KPI Trend Sheet – Historical KPI trend analysis
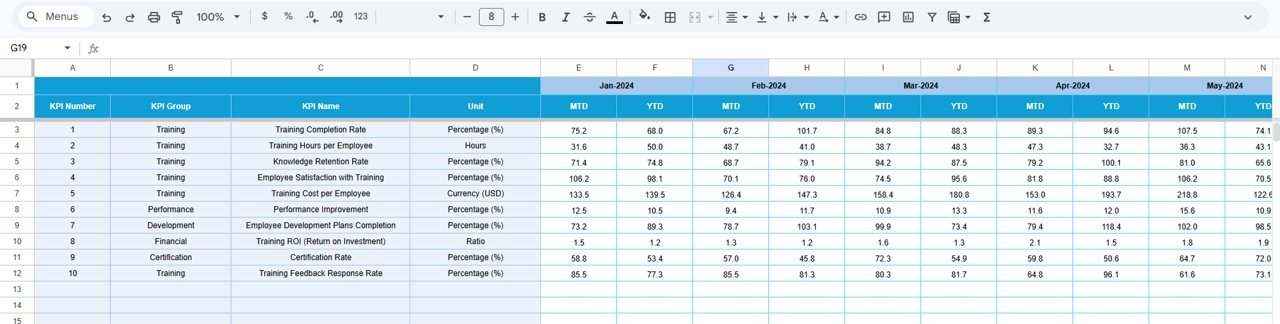
✅ Actual Number Sheet – Enter current training performance data
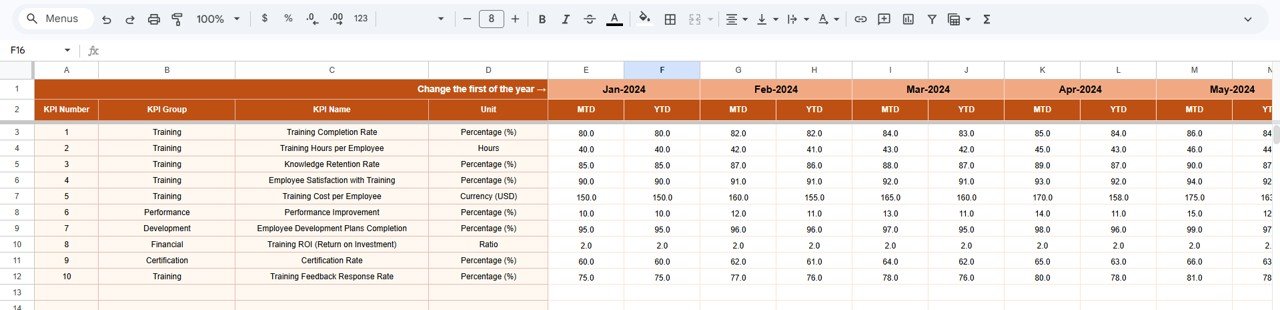
✅ Target Sheet – Define monthly and yearly KPI targets
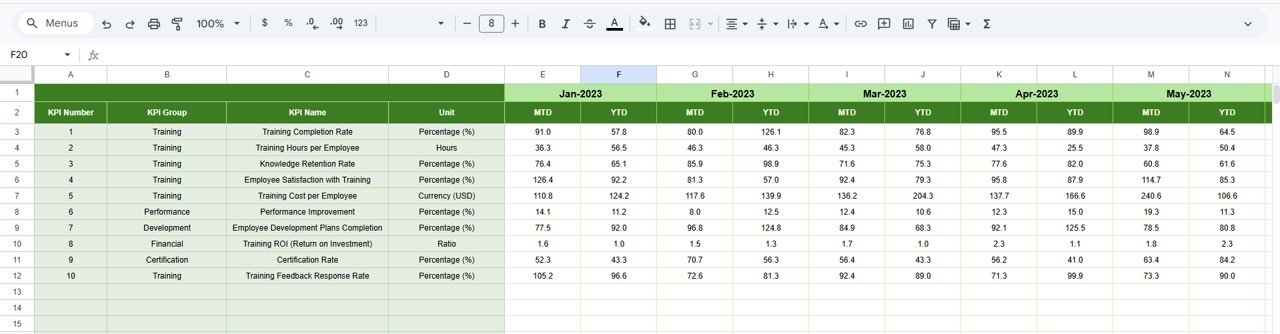
✅ Previous Year Number Sheet – Store historical KPI values
✅ KPI Definition Sheet – Document KPI formulas and definitions
The dashboard can track multiple Learning & Development metrics such as:
Training Completion Rate
Training Hours per Employee
Employee Certification Rate
Training Effectiveness Score
Training Cost per Employee
Employee Skill Improvement Rate
Learning Participation Rate
Training Program Success Rate
Because the dashboard automatically compares KPI results with targets and historical data, organizations can clearly evaluate the impact of their training programs.
⚙️ How to Use the Learning & Development KPI Dashboard in Google Sheets
Using this KPI dashboard is simple and efficient.
1️⃣ Enter training performance data in the Actual Number Sheet.
2️⃣ Define performance goals in the Target Sheet.
3️⃣ Input previous year KPI values in the Previous Year Number Sheet.
4️⃣ Select the desired month from the Dashboard dropdown (cell D3).
5️⃣ Analyze KPI results, comparisons, and visual indicators on the dashboard.
6️⃣ Use the KPI Trend Sheet to monitor performance trends over time.
Within seconds, HR managers can evaluate training performance and identify development opportunities.
Because the template uses automated formulas and visual indicators, analyzing training results becomes faster and easier.
👥 Who Can Benefit from This Learning & Development KPI Dashboard
This dashboard is designed for professionals responsible for workforce development and training analytics.
It is especially useful for:
👩💼 HR Managers
🎓 Learning & Development Teams
📊 HR Analysts
🏢 Corporate Training Managers
📈 Organizational Development Professionals
👨💼 Business Leaders
Because Google Sheets supports cloud collaboration, multiple team members can access and update the dashboard simultaneously.
💡 Why Organizations Use This Learning & Development KPI Dashboard
✔ Centralized employee training performance monitoring
✔ Clear comparison between targets, actual results, and historical performance
✔ Faster identification of training effectiveness and improvement areas
✔ Better HR decision-making using structured analytics
✔ Improved workforce development planning
✔ Easy collaboration through Google Sheets
✔ Automated KPI calculations and performance indicators
✔ Scalable system for long-term training analytics
Instead of relying on scattered training reports, organizations gain a structured KPI monitoring system that helps improve workforce skills and training effectiveness.
This dashboard converts training data into actionable insights that support smarter HR and learning decisions.
### Click here to read the Detailed blog post
Watch the step-by-step video tutorial:
Visit our YouTube channel to learn step-by-step video tutorials
Youtube.com/@NeotechNavigators


