
Managing landscaping operations effectively means keeping a close eye on performance, productivity, and profitability. 🌿 Whether you run a local landscaping company or oversee large-scale maintenance contracts, data-driven insights can help you make smarter decisions every day. That’s why we created the Landscaping Services KPI Dashboard in Excel — a professional, ready-to-use solution for tracking all your key metrics in one place.
This interactive Excel dashboard helps managers, supervisors, and business owners visualize performance across projects, people, and costs — enabling faster decisions, smoother operations, and improved customer satisfaction. 💼
✨ Key Features of Landscaping Services KPI Dashboard in Excel
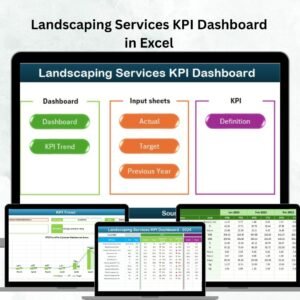
✔ 7 Pre-Built Sheets – Includes Home, Dashboard, KPI Trend, Actual Numbers Input, Target, Previous Year Numbers, and KPI Definition tabs for a complete analytics setup.
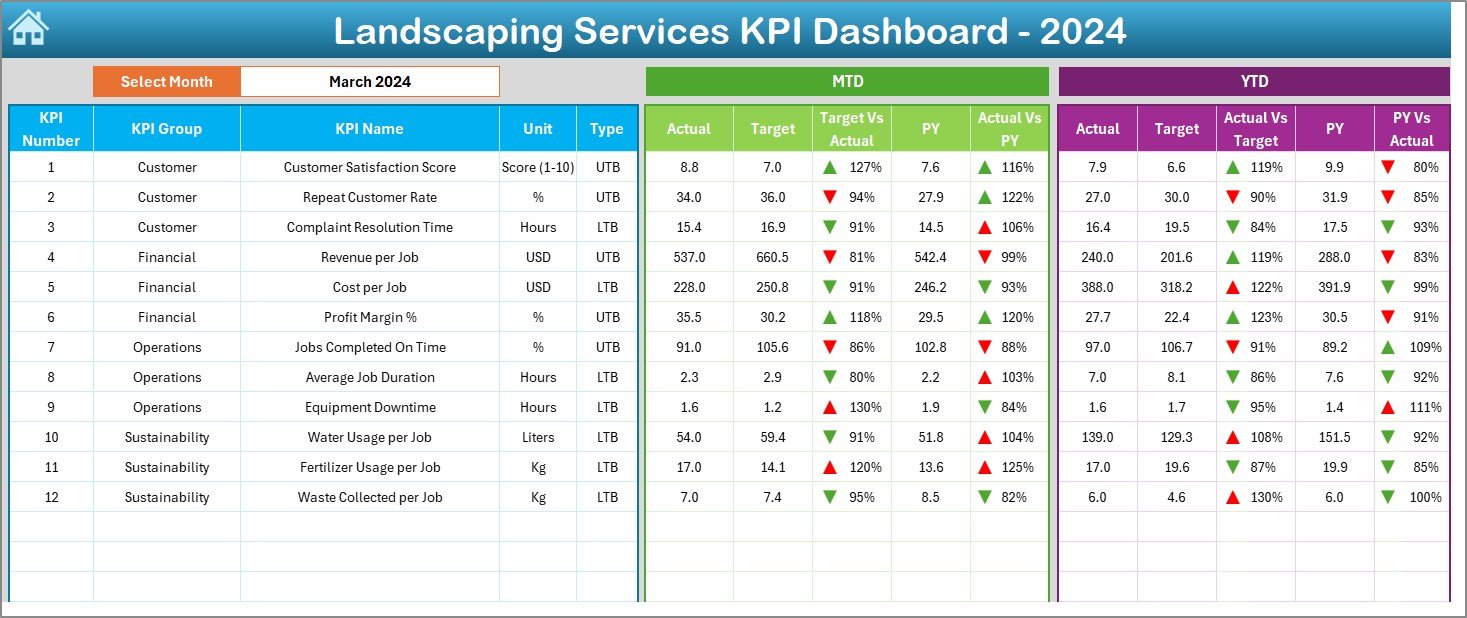
✔ Dynamic Dashboard View – Month selector (cell D3) instantly updates MTD and YTD performance across all KPIs.
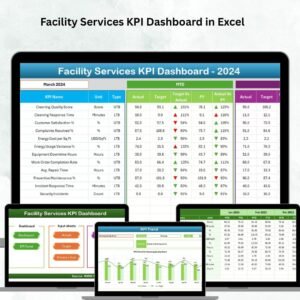
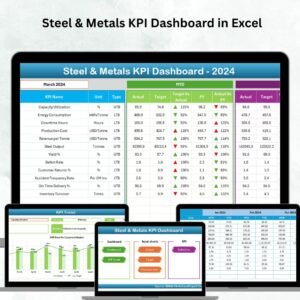
✔ Visual Indicators – Built-in conditional formatting arrows highlight performance changes — green for improvement, red for decline.
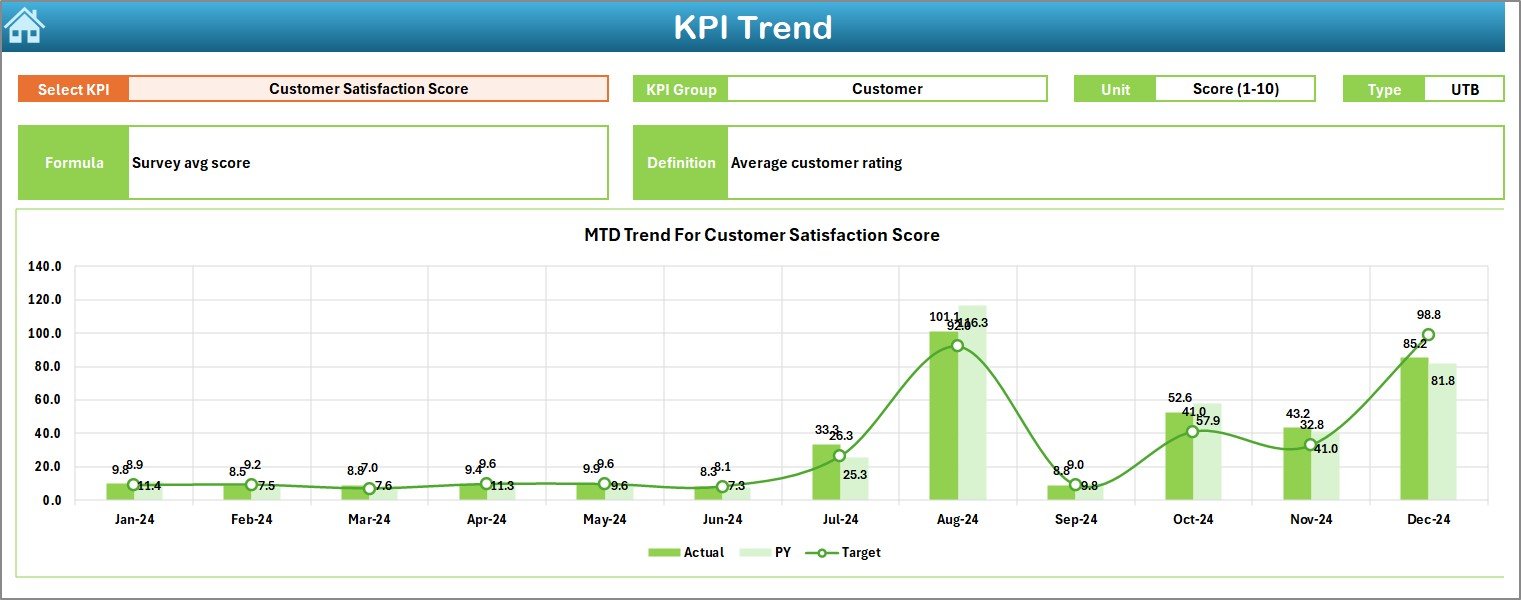
✔ Trend Analysis Page – Drill down into any KPI to view detailed month-over-month and year-over-year trends.
✔ Comprehensive Data Management – Input sheets for Actual, Target, and Previous Year data ensure clarity and transparency.
✔ Consistent KPI Definitions – Centralized KPI Definition sheet keeps metrics standardized across departments.
✔ Interactive & User-Friendly Interface – Easy navigation buttons, dropdowns, and clean visuals make it simple to use for all users.
✔ Customizable Design – Modify KPIs, visuals, and formats to match your business goals.
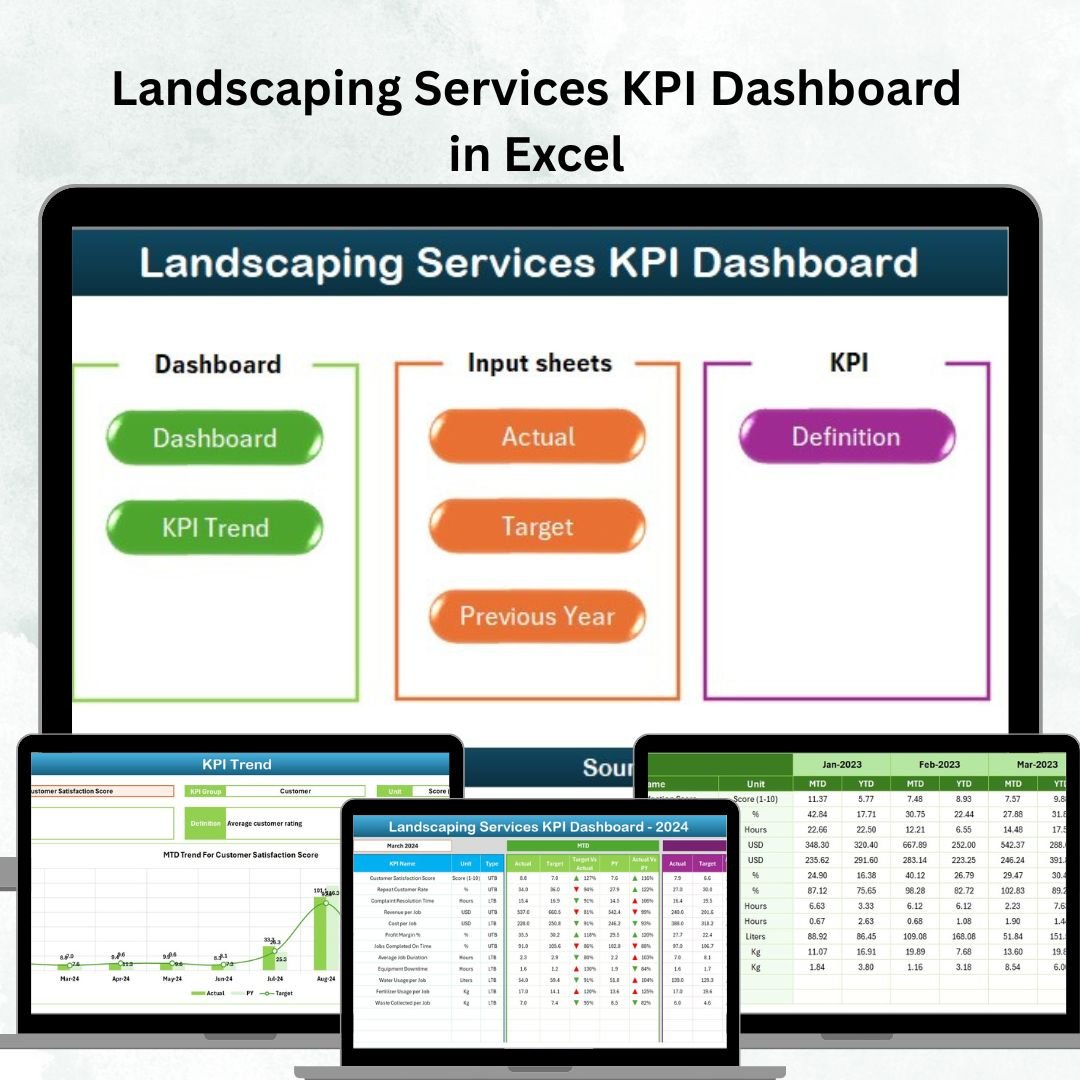
📂 What’s Inside the Landscaping Services KPI Dashboard
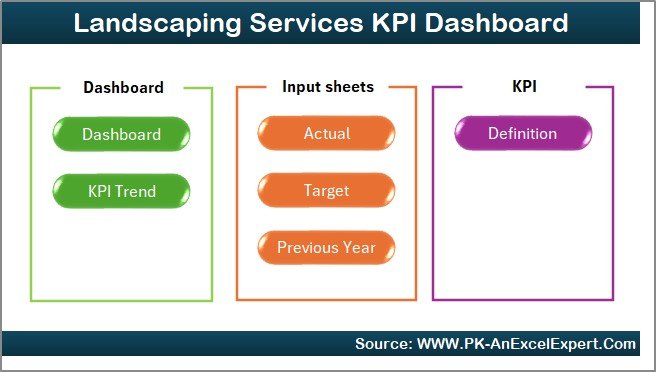
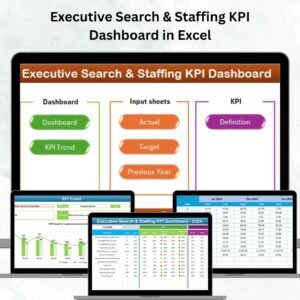
🔹 Home Sheet – A sleek navigation hub with one-click buttons to move between pages.
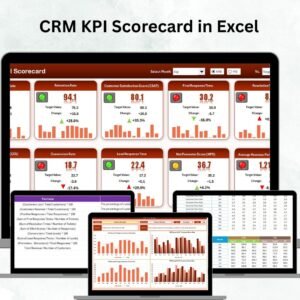
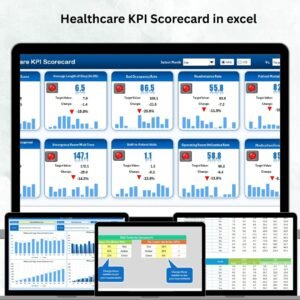
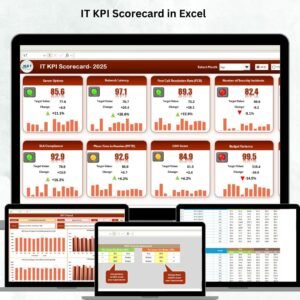
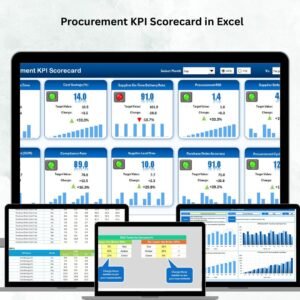
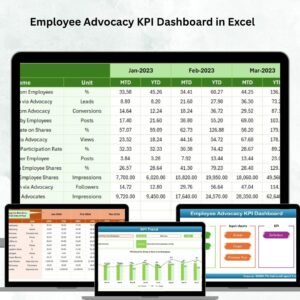
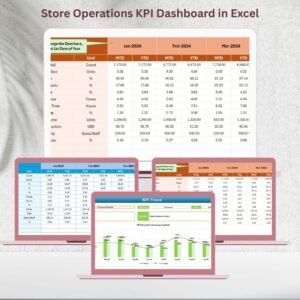
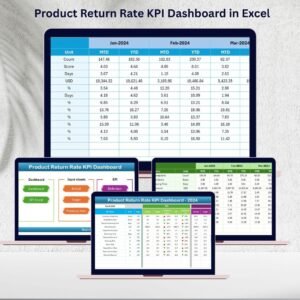
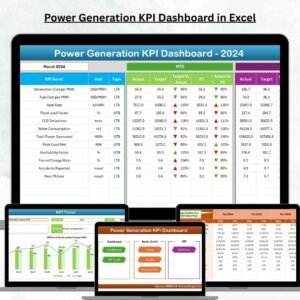
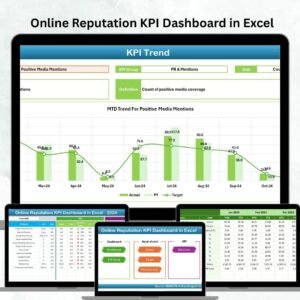
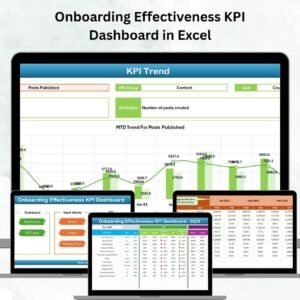
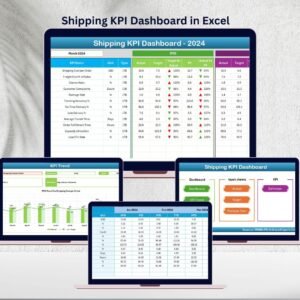
🔹 Dashboard Sheet – Your main visualization center showing KPI cards, charts, and performance summaries.
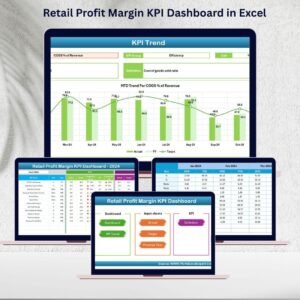
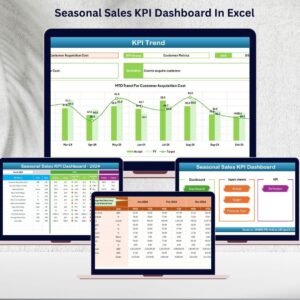
🔹 KPI Trend Sheet – A deep dive into month-wise and year-wise performance for any KPI.
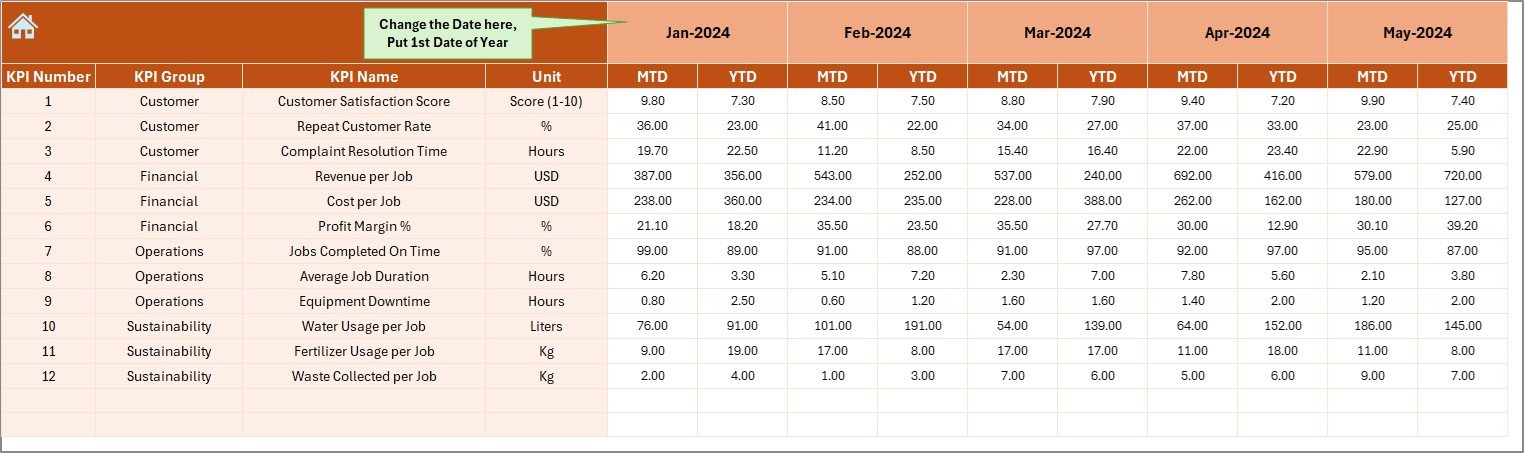
🔹 Actual Numbers Input Sheet – Record monthly data dynamically with the starting month selection (cell E1).
🔹 Target Sheet – Store and update your monthly and yearly targets.
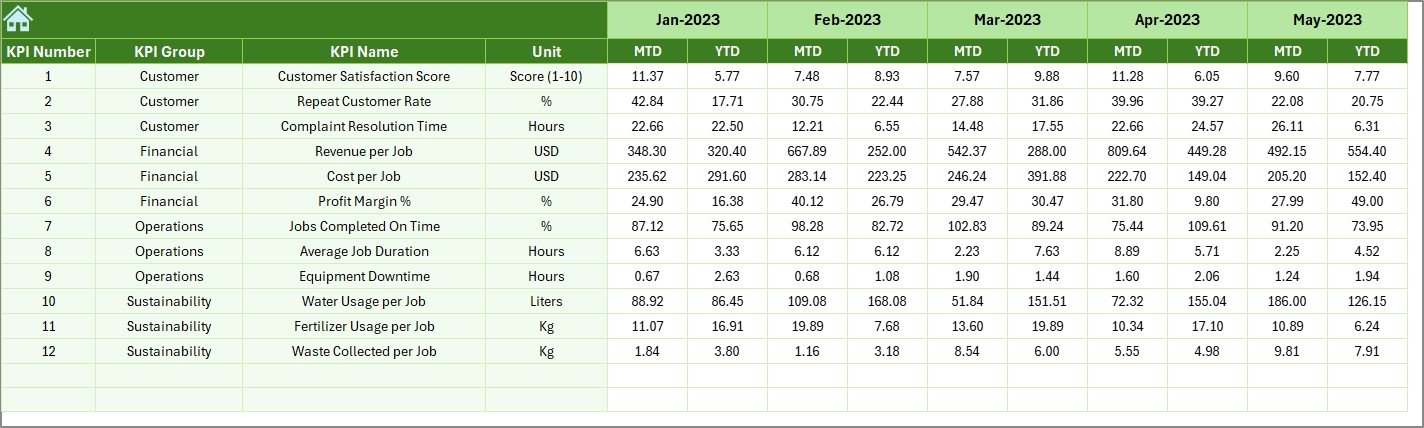
🔹 Previous Year Numbers Sheet – Compare performance with last year’s figures for growth insights.
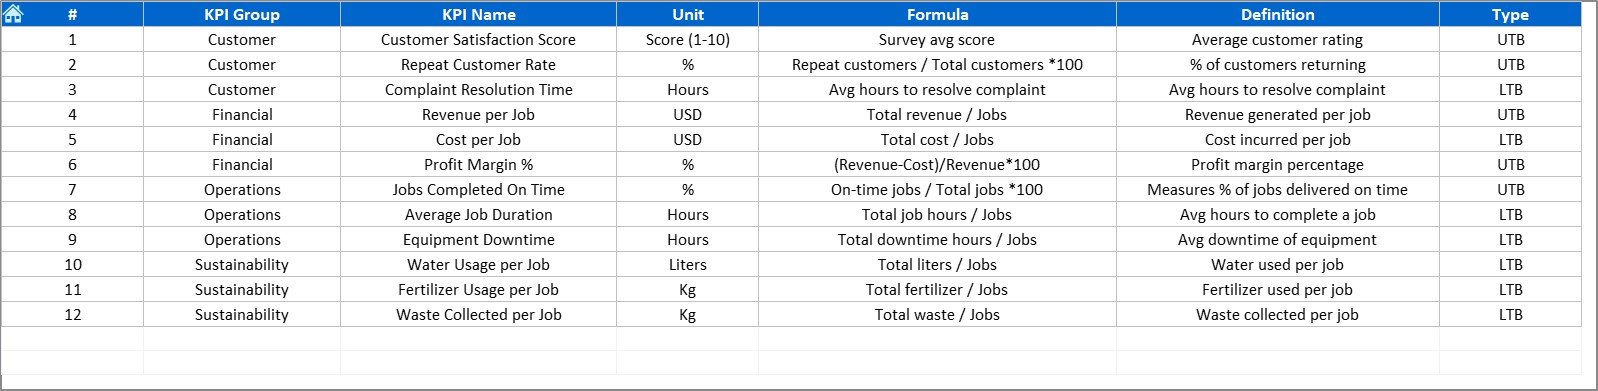
🔹 KPI Definition Sheet – Document KPI names, formulas, groups, and units for organization-wide alignment.
🛠️ How to Use the Landscaping Services KPI Dashboard
-
Open the Template – Works directly in Excel with no extra setup.
-
Add KPI Definitions – Customize your metrics in the KPI Definition Sheet.
-
Enter Actual Data – Update monthly performance figures in the Actual Numbers Input Sheet.
-
Set Targets – Define benchmarks in the Target Sheet.
-
Add Historical Data – Input last year’s numbers for year-over-year comparisons.
-
Analyze Performance – Use the Dashboard and KPI Trend pages to monitor results.
-
Share Insights – Present visual summaries to stakeholders or clients.
👥 Who Can Benefit from This Dashboard?
✅ Landscaping Business Owners – Track profitability, service quality, and operational performance.
✅ Facility Managers – Monitor maintenance costs and contract efficiency.
✅ Operations Supervisors – Measure workforce utilization and equipment reliability.
✅ Municipal Departments – Evaluate sustainability and public area maintenance.
✅ Hotel & Resort Managers – Ensure top-tier landscape presentation and client satisfaction.
✅ Corporate Facility Teams – Manage outsourced landscape services and vendor accountability.
By using the Landscaping Services KPI Dashboard in Excel, organizations can:
💡 Eliminate manual reporting with automated visuals.
💡 Monitor Actual vs. Target and Previous Year metrics in real-time.
💡 Identify bottlenecks in maintenance, labor, or cost efficiency.
💡 Enhance accountability and data transparency.
💡 Save time, improve quality, and boost profitability.
It’s more than a dashboard — it’s your operational command center for landscaping performance management. 🌳


Reviews
There are no reviews yet.