Running a jewellery or watches business requires fast decision-making and crystal-clear insights. Sales vary by city, gemstones, style, and collection—and without a proper dashboard, businesses end up wasting time in manual reports, scattered spreadsheets, and guesswork. The Jewellery & Watches Dashboard in Excel is a powerful, ready-to-use analytics template designed to solve these challenges. It brings all your business data together and converts it into interactive visuals that help you understand performance instantly.
Whether you manage small boutique stores, multi-brand outlets, or an online jewellery brand, this dashboard gives you a complete 360° view of sales, collections, gemstones, store types, and month-wise trends. It is built entirely in Excel, making it easy for anyone to use—no complex software or technical skills required. Simply update the Data Sheet and the dashboard updates automatically.
This template is designed to help retailers improve sales, increase profitability, manage inventory smarter, and analyze performance with a single click. With its clean visuals, powerful slicers, and automated charts, the dashboard becomes your most essential business analysis tool.
⭐ Key Features of Jewellery & Watches Dashboard in Excel
✨ Easy Page Navigation – Jump between Overview, Collection Analysis, Gemstone Analysis, Store Analysis, and Month Analysis with a single click.
📊 Smart KPI Cards – Instantly check total sales, gross profit, cost, pending orders %, and total stores.
📍 Powerful Slicers – Filter data by Year, City, Brand, Store, Collection, Style, and more.
💎 Gemstone-Level Insights – Track cost, sales, and profit by each gemstone.
🛒 Collection Analysis – Identify high-performing and low-performing jewellery collections.
🏬 Store Comparison – Compare store types and cities to discover profitable locations.
📈 Monthly Trend Analysis – Understand seasonal patterns and peak sales months.
📥 Fully Automated Template – Update the Data Sheet and watch visuals refresh instantly.
⚡ Beginner-Friendly Interface – No coding, no formulas—just load your data and analyze.
These features make the dashboard a complete business intelligence tool for jewellery retailers and watch stores.
📦 What’s Inside the Jewellery & Watches Dashboard in Excel
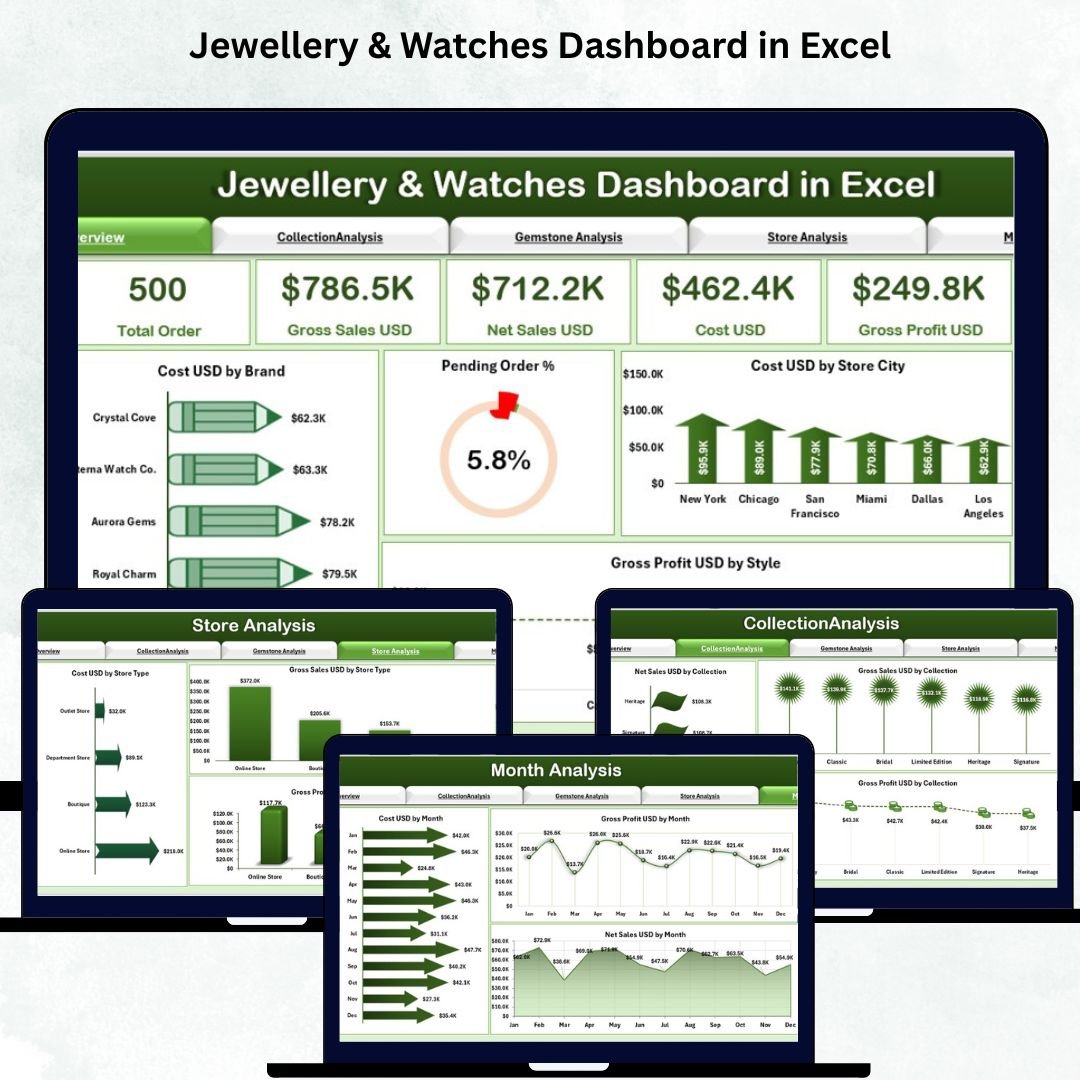
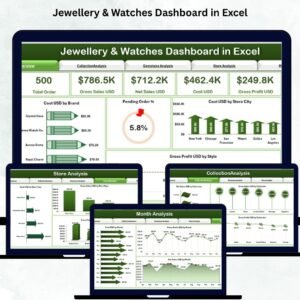
🟦 1. Overview Page – Complete Performance Snapshot
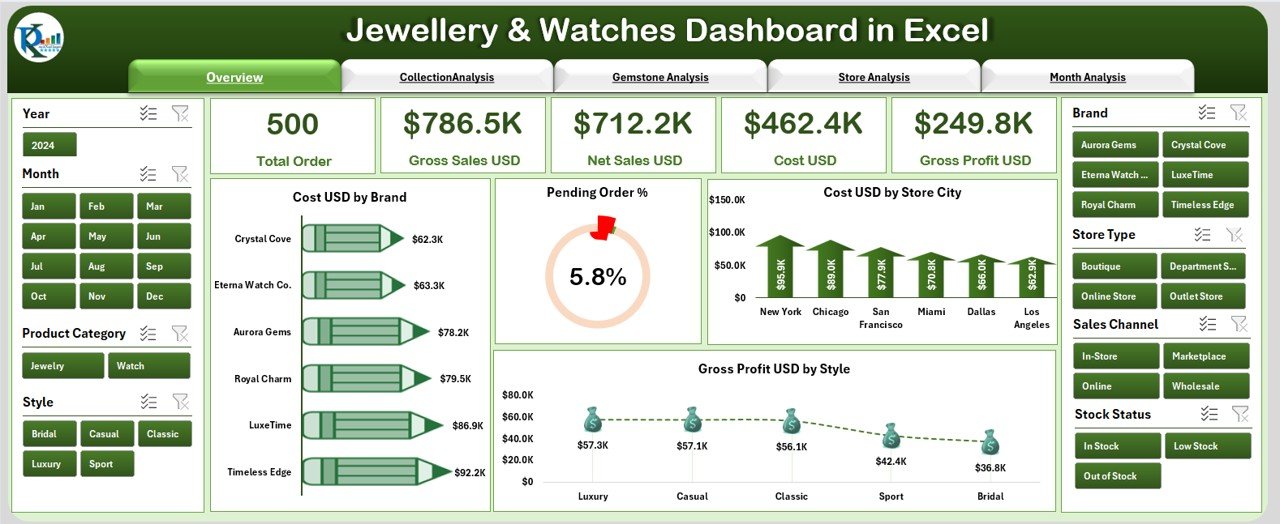
This is your main summary page showing:
-
Right-side slicers (Year, City, Brand, Store, Collection, Style)
-
5 KPI cards for Cost, Gross Profit, Pending Orders %, Total Stores & Total Sales
-
4 powerful charts, including:
✔ Cost USD by Brand
✔ Pending Order %
✔ Cost USD by Store City
✔ Gross Profit USD by Style
With one glance, you understand your business performance across stores, brands, and styles.
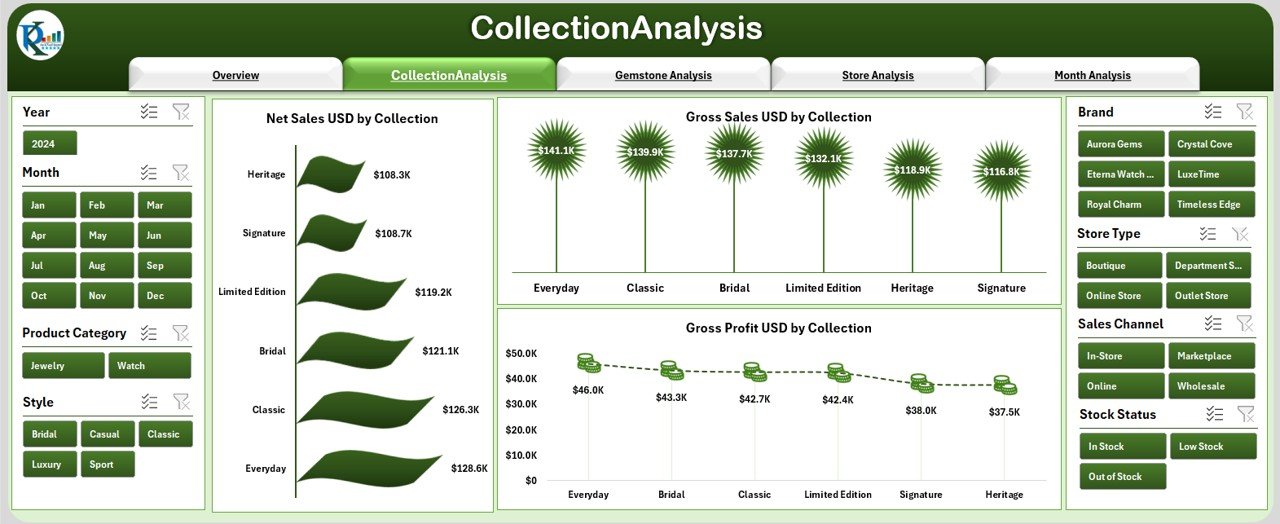
🟧 2. Collection Analysis Page – Track Collection-Wise Performance
Using slicers (Brand, Category, Store, City), this page reveals:
-
Net Sales USD by Collection
-
Gross Sales USD by Collection
-
Gross Profit USD by Collection
It helps you identify best-selling collections, high-margin products, and collections that need more marketing efforts.
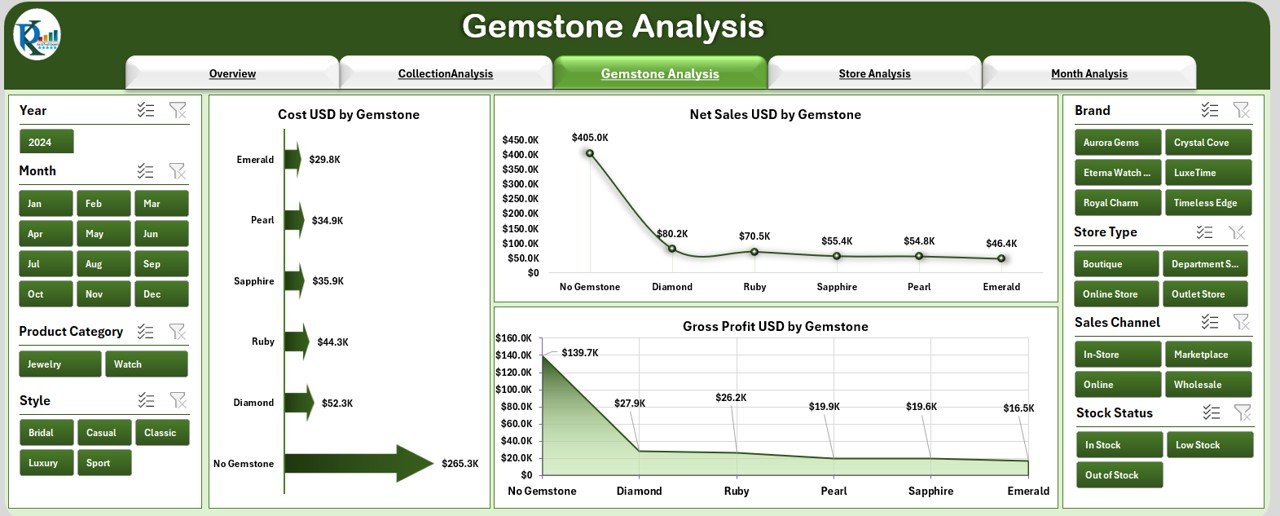
🟩 3. Gemstone Analysis Page – Deep Dive into Gemstone Contribution
This page includes slicers for Gemstone, Brand, City & Store and displays:
-
Cost USD by Gemstone
-
Net Sales USD by Gemstone
-
Gross Profit USD by Gemstone
Identify which gemstones perform the best, which need better pricing, and where to focus your inventory.
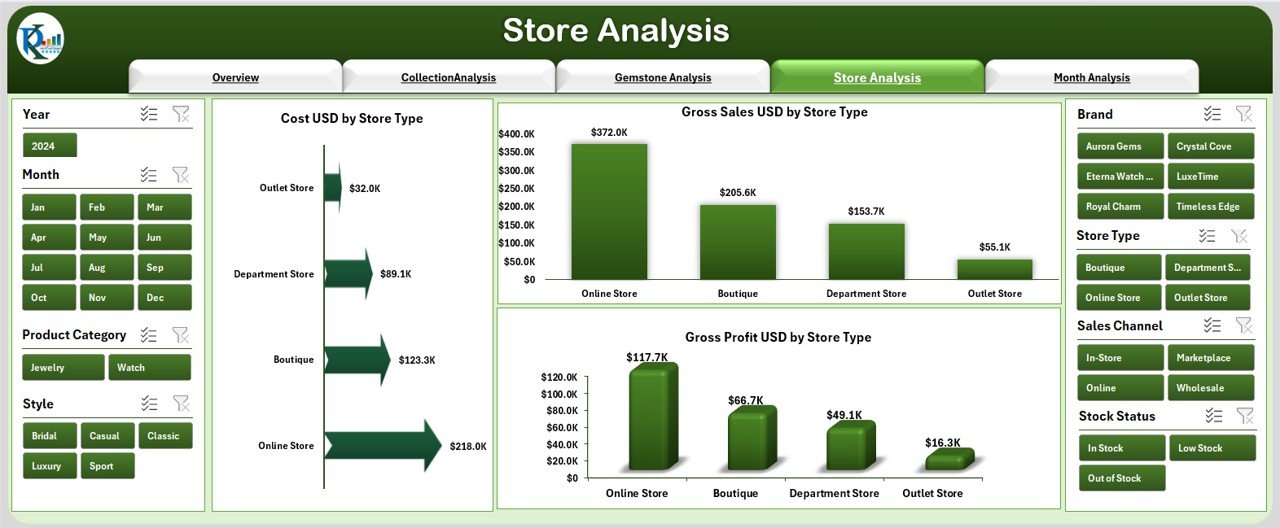
🟨 4. Store Analysis Page – Compare Store Types & Cities
This page includes slicers for Store Type, Store City, Brand, & Category.
Charts include:
-
Cost USD by Store Type
-
Gross Sales USD by Store Type
-
Gross Profit USD by Store Type
Understand which store formats and cities generate the most revenue and profit.
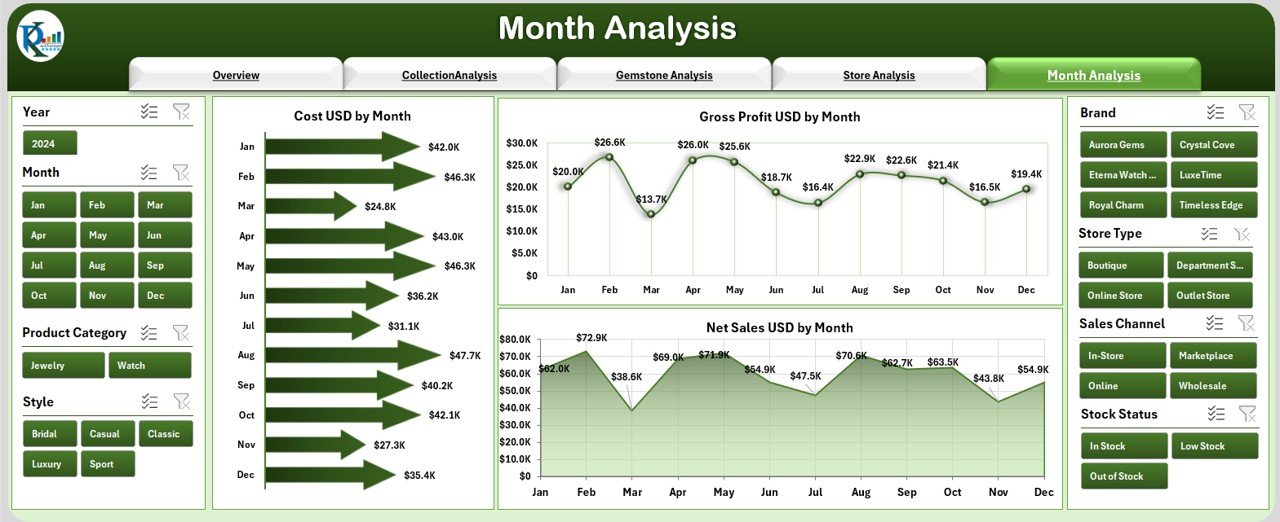
🟪 5. Month Analysis Page – Track Month-by-Month Trends
Use slicers like Month, Year, Store, Brand & Collection to view:
-
Cost USD by Month
-
Gross Profit USD by Month
-
Net Sales USD by Month
Plan stock, pricing, and marketing for peak seasons confidently.
🧠 How to Use the Jewellery & Watches Dashboard in Excel
Using the dashboard is simple:
1️⃣ Open the Excel file.
2️⃣ Go to the Data Sheet and paste your fresh transactional data.
3️⃣ All charts, KPIs, and visuals update automatically.
4️⃣ Use slicers to filter insights by city, brand, gemstone, or month.
5️⃣ Explore all five pages to understand your business from every angle.
In less than a minute, your entire jewellery business becomes data-driven.
👥 Who Can Benefit from This Jewellery & Watches Dashboard in Excel?
💎 Jewellery Retailers – Analyze sales, profit, gemstones & collections.
⌚ Watch Stores & Boutiques – Track store performance & monthly trends.
🛍 E-commerce Jewellery Brands – Compare collections & product categories.
🏬 Multi-Brand Retail Chains – Compare stores, locations & formats.
📊 Business Owners & Managers – Get a quick, clear view of business health.
🧮 Analysts & Excel Users – Learn professional dashboard design.
Anyone selling jewellery or watches can gain powerful insights from this dashboard.


Reviews
There are no reviews yet.