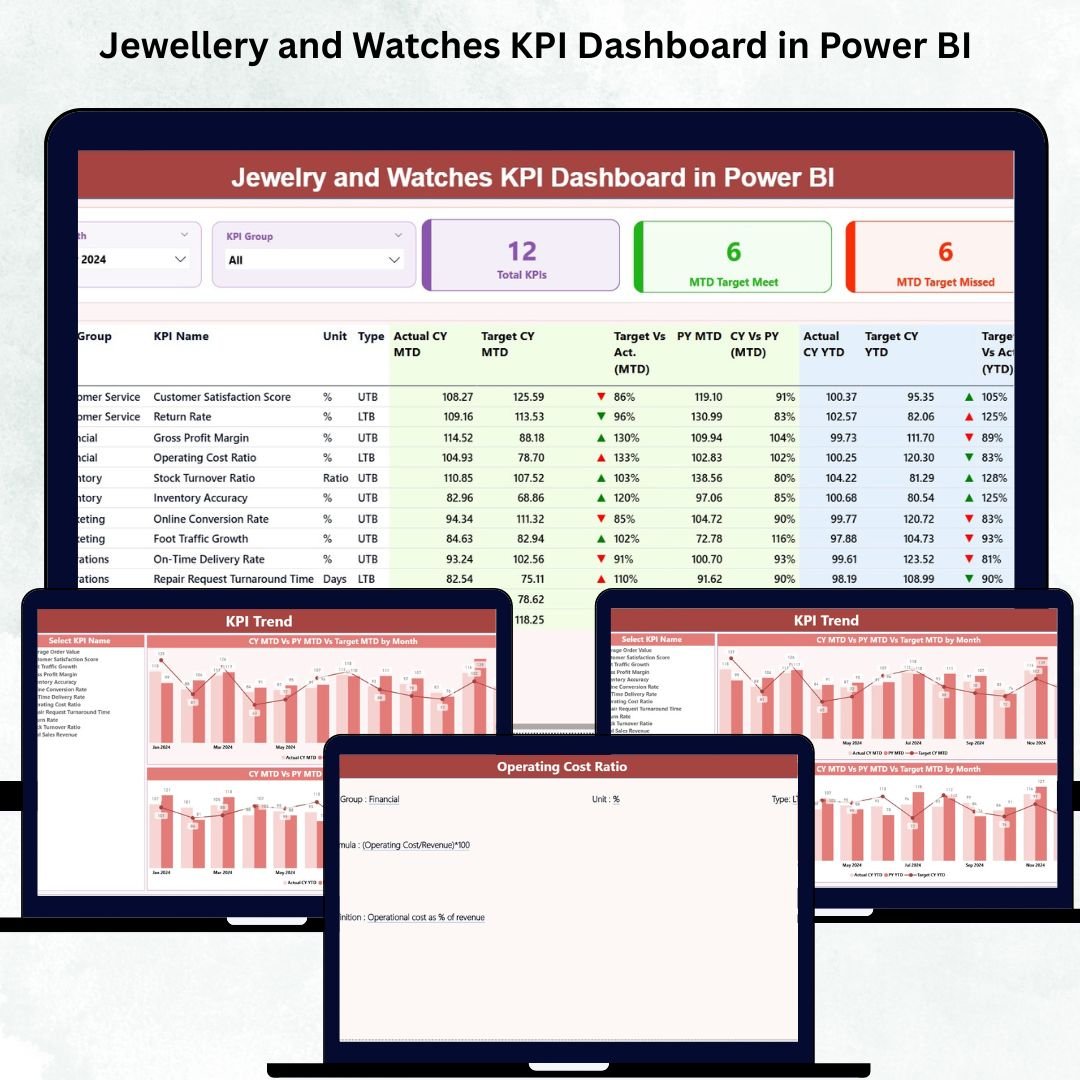
The jewellery and watches retail industry moves at lightning speed—premium customers expect flawless service, accurate information, and high-end product availability. Jewellery and Watches KPI Dashboard in Power BI In such a competitive environment, businesses need crystal-clear performance tracking, not scattered spreadsheets or outdated reports. That’s where the ✨ Jewellery and Watches KPI Dashboard in Power BI ✨ becomes your most powerful decision-making tool.
This ready-to-use dashboard transforms raw retail data into interactive visuals that help store managers, executives, and retail owners understand performance within seconds. Whether you want to monitor sales, reduce returns, analyze store performance, track KPIs, or improve operational efficiency—this dashboard gives you complete clarity on every number that matters.
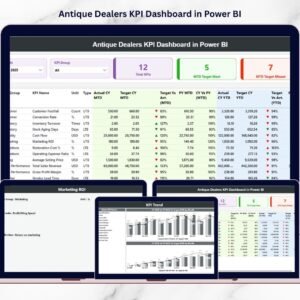
💡 Key Features of the Jewellery & Watches KPI Dashboard in Power BI
This dashboard is designed for fast-paced luxury retail environments where every KPI counts. With interactive slicers, dynamic visuals, real-time insights, and automated calculations, the dashboard becomes your daily performance companion.
✨ 1. Interactive Slicers for Smart Filtering
Filter your KPIs instantly by:
-
Month
-
KPI Group
-
Category
-
Store
-
And more
You get focused insights with just one click.
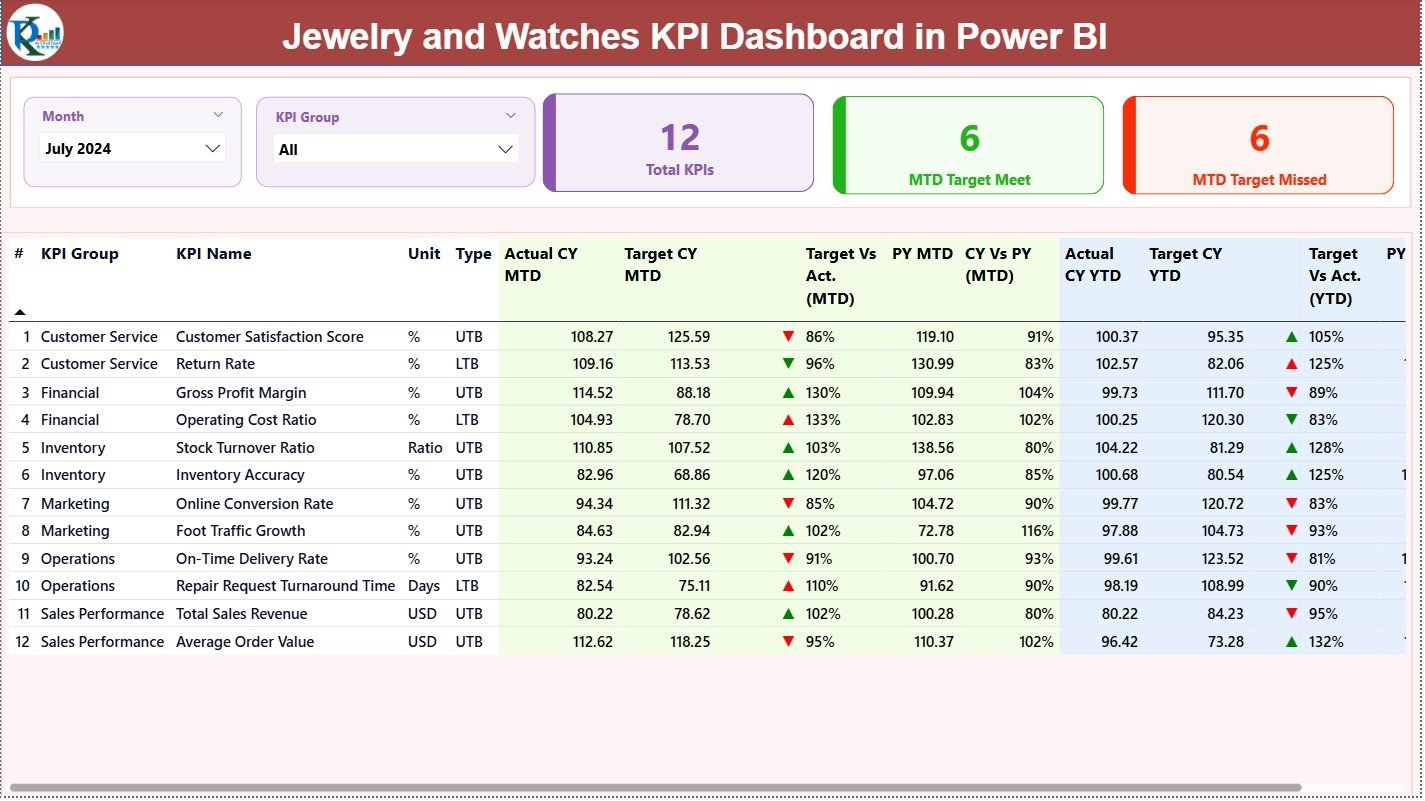
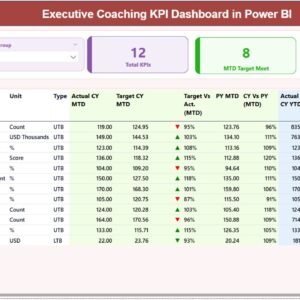
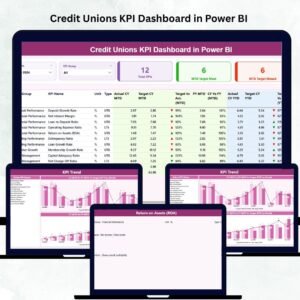
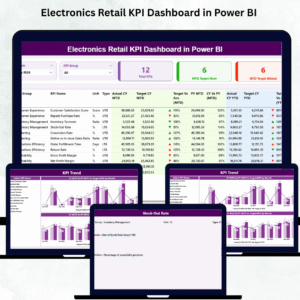
📊 2. Smart KPI Cards
Track the most important business indicators instantly:
-
⭐ Total KPIs Count
-
📈 MTD Target Met
-
⚠️ MTD Target Missed
These cards give a clear visual pulse of the business.
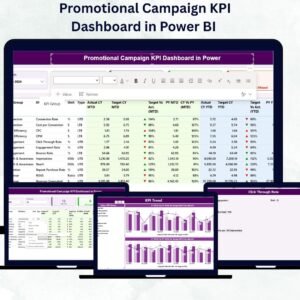
📋 3. Complete KPI Summary Table
See everything in one view:
-
KPI Number
-
KPI Group
-
KPI Name
-
Unit
-
KPI Type (LTB/UTB)
-
Actual MTD & YTD
-
Target MTD & YTD
-
Trend Indicators (▲ / ▼)
-
Target vs Actual %
-
CY vs PY Comparison
No more manual calculations—every insight is automated.
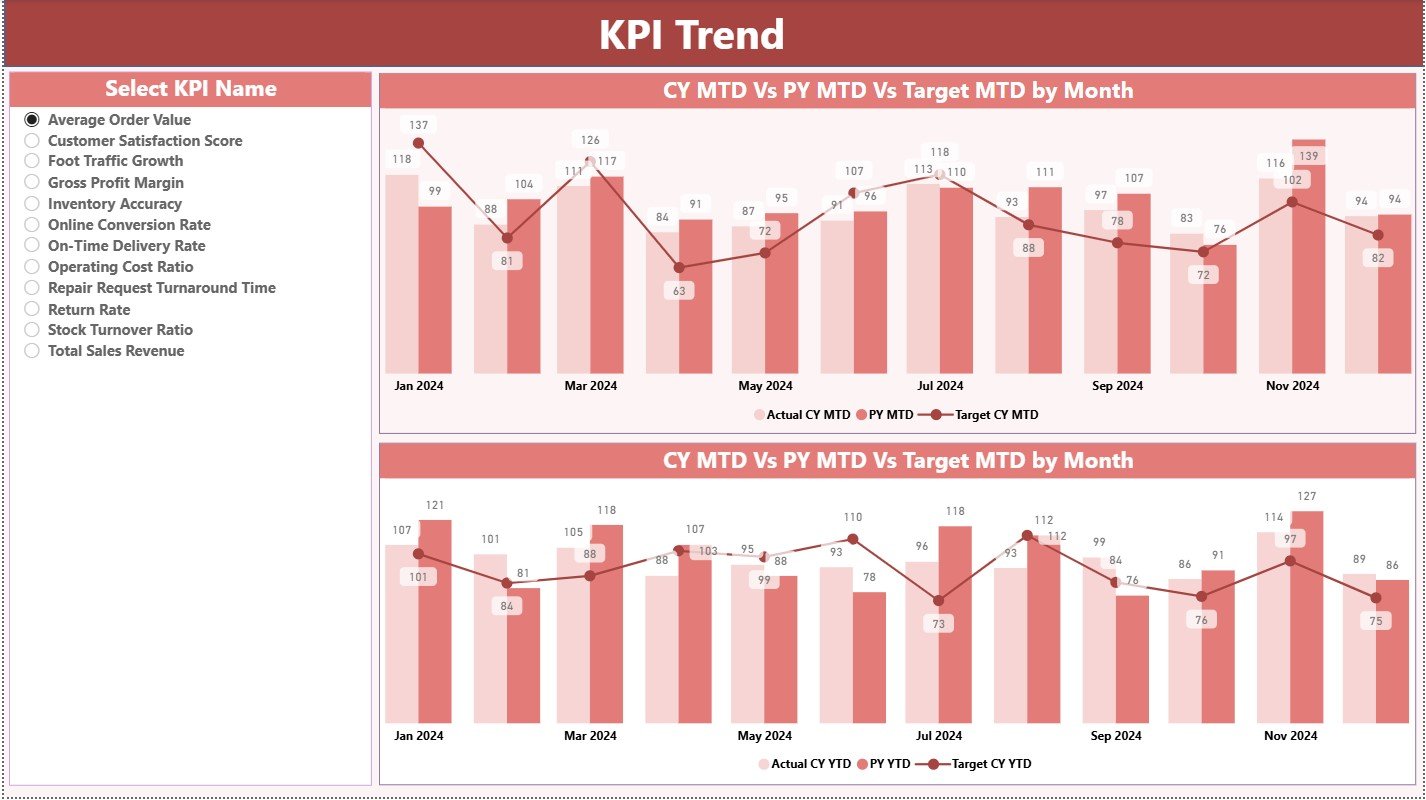
📈 4. KPI Trend Insights
Understand how performance evolves month-by-month with:
-
MTD Trend Chart
-
YTD Trend Chart
-
Current Year vs Previous Year
-
Actual vs Target Overlay
Perfect for forecasting, planning, and strategic analysis.
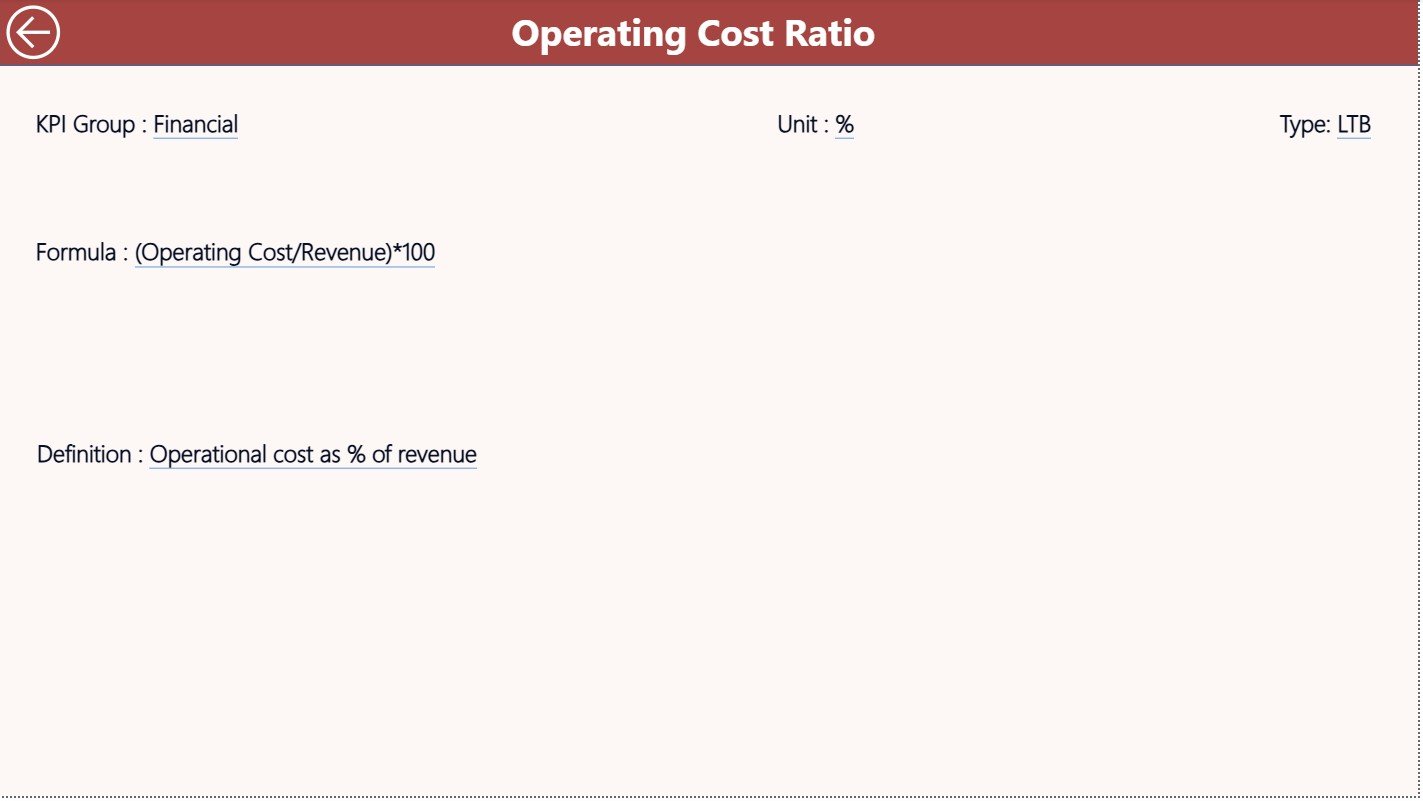
📘 5. KPI Definition Drill-Through Page
A hidden but powerful page that shows:
-
KPI Meaning
-
Calculation Formula
-
KPI Unit
-
KPI Type
-
KPI Definition
Every KPI is documented for clarity and transparency.
📦 What’s Inside the Dashboard
This ready-to-use solution includes:
-
✔️ Summary Page
-
✔️ KPI Trend Page
-
✔️ KPI Definition Page
-
✔️ Excel Source File (Actual, Target, KPI Definition sheets)
-
✔️ Automated visuals powered by Power BI
-
✔️ Interactive filters & icons
-
✔️ Clean, modern, and intuitive layout
Everything is built to make your performance review process faster and smarter.
📝 How to Use the Jewellery & Watches KPI Dashboard
Using this dashboard is extremely simple—even for beginners.
Step 1: Update Excel Source File
Fill in:
-
Actual MTD / YTD
-
Target MTD / YTD
-
KPI definitions and formulas
Step 2: Refresh Power BI
Click Refresh and the entire dashboard updates instantly.
Step 3: Analyze Performance
Use slicers, cards, charts, and comparison tables to understand:
-
Store performance
-
Category insights
-
Trend movement
-
Target vs actual
-
CY vs PY behavior
Step 4: Drill Through for Clarity
Right-click on any KPI → View detailed definition page.
Step 5: Take Action
Use insights to:
-
Improve sales
-
Reduce returns
-
Optimize inventory
-
Enhance customer satisfaction
👥 Who Can Benefit from This Dashboard?
This dashboard is perfect for:
-
🛍️ Jewellery Store Owners
-
⌚ Watch Retail Chains
-
📊 Retail Analysts
-
🧑💼 Store Managers
-
📝 Performance Management Teams
-
💼 Retail Consultants
-
🏢 Multi-Store Business Leaders
If your goal is to improve accuracy, efficiency, and decision-making—this dashboard is for you.


Reviews
There are no reviews yet.