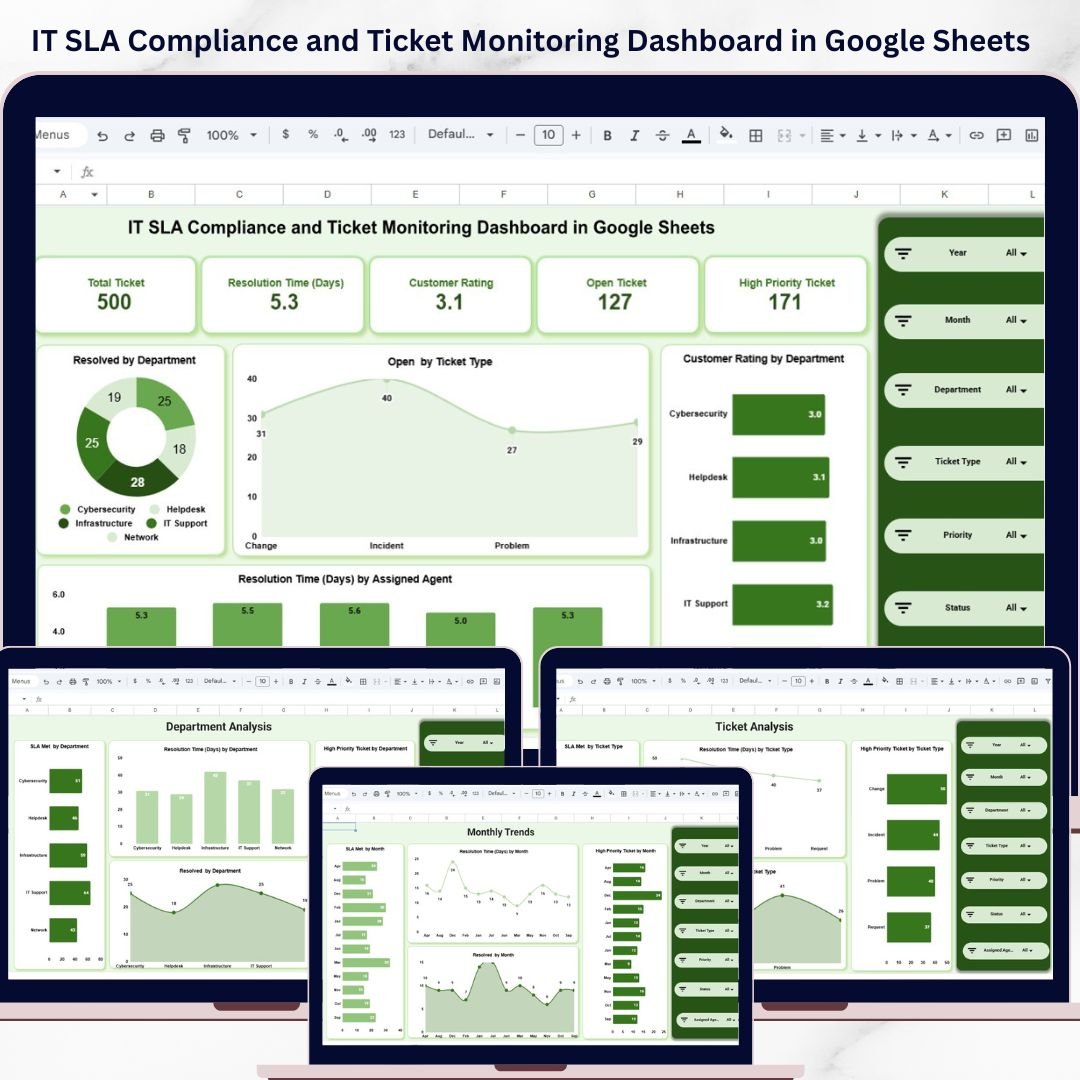


IT SLA Compliance and Ticket Monitoring Dashboard in Google Sheets is a powerful, ready-to-use analytics template built for IT service managers, help desk supervisors, IT operations leads, and managed service providers who need to track SLA compliance rates, monitor ticket volumes, analyze resolution times, and evaluate agent performance from a single collaborative Google Sheets dashboard. This template includes 5 interactive dashboard pages and a structured Data Sheet — giving you complete visibility into your IT ticketing operations and SLA performance at a glance.
If you are managing IT support tickets using scattered spreadsheets or manual reports, this IT SLA Compliance and Ticket Monitoring Dashboard in Google Sheets transforms your workflow by delivering real-time visual insights through Google Sheets’ built-in charting and formula engine. The dashboard tracks 5 key metrics including Total Ticket, Resolution Time (Days), Customer Rating, Open Ticket, and High Priority Ticket — making it the most complete Google Sheets Dashboard for IT SLA monitoring and ticket management available today.
🔑 Key Features of IT SLA Compliance and Ticket Monitoring Dashboard in Google Sheets
📊 5 Interactive Dashboard Pages + Data Sheet — Overview, Department Analysis, Ticket Analysis, Assigned Agent Analysis, and Monthly Trends pages deliver 360-degree visibility into your IT service desk operations, SLA compliance trends, and team productivity.
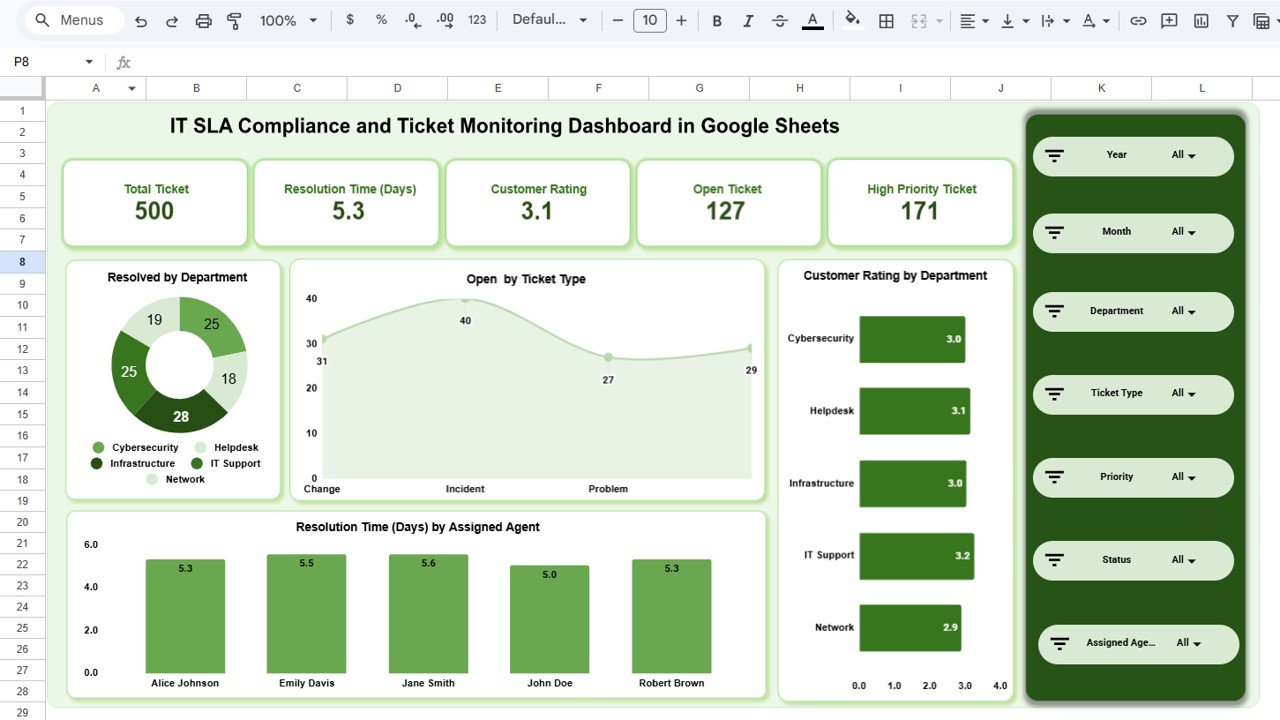
📈 5 High-Level KPI Cards on Overview Page — Total Ticket, Resolution Time (Days), Customer Rating, Open Ticket, and High Priority Ticket provide an executive-level summary of your IT service health instantly.
🎛 Multiple Slicers for Quick Filtering — Apply dynamic filters across the entire dashboard to quickly drill down into specific departments, ticket types, agents, or time periods and see filtered results instantly.
🔍 SLA Compliance Analysis by Every Dimension — Track SLA Met rates across departments, ticket types, assigned agents, and monthly trends. Instantly spot which areas are meeting SLA targets and which are falling behind.
👨💻 Assigned Agent Performance Analytics — Track individual agent SLA compliance, resolution times, high priority ticket counts, and resolved ticket volumes for workforce optimization and performance reviews.
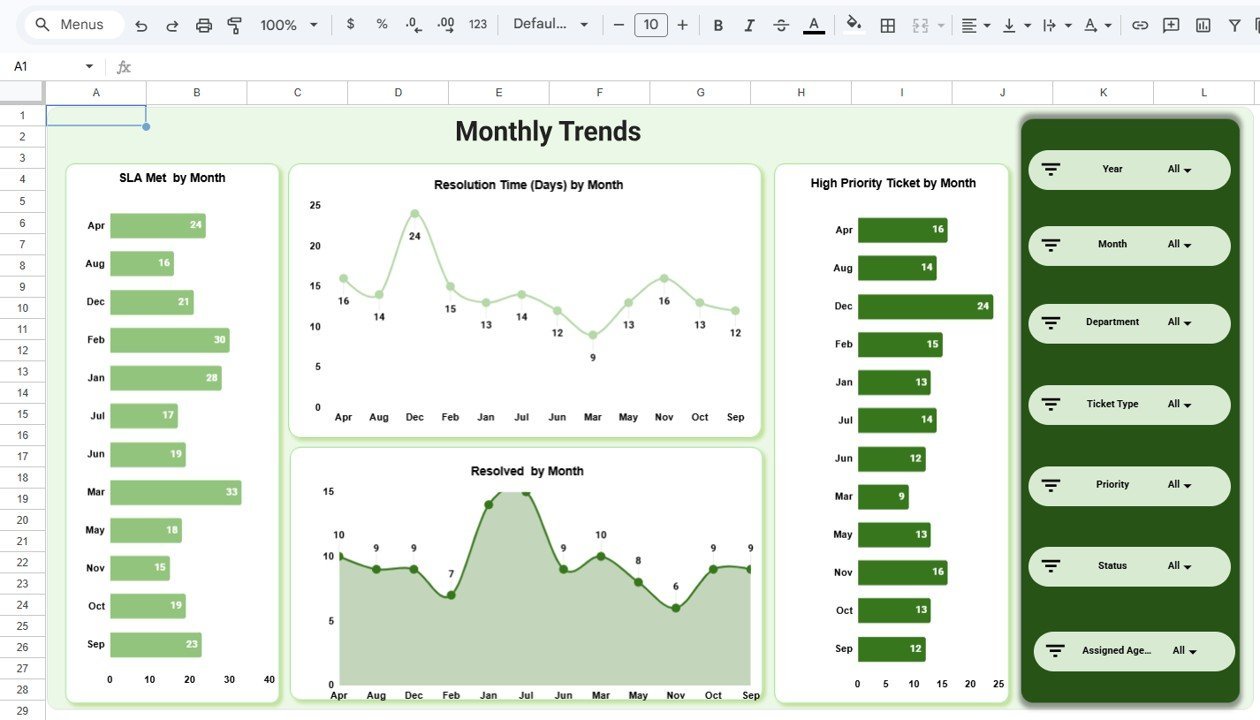
📅 Monthly Trend Analysis — Visualize SLA Met by Month, Resolution Time trends, High Priority Ticket patterns, and Resolved ticket counts over time for data-driven capacity planning.
🔄 Dynamic Charts Powered by Google Sheets Formulas — Every chart auto-updates when you replace the sample data with your own records. No macros, no scripts — pure Google Sheets formula-driven analytics.
☁️ Collaborative Google Sheets Platform — Share with your entire IT team in real-time. Multiple users can view and analyze the dashboard simultaneously from any device with Google Drive access.
📦 What’s Inside the IT SLA Compliance and Ticket Monitoring Dashboard in Google Sheets
This Google Sheets dashboard template includes 6 sheet tabs designed for comprehensive IT SLA tracking and ticket monitoring:
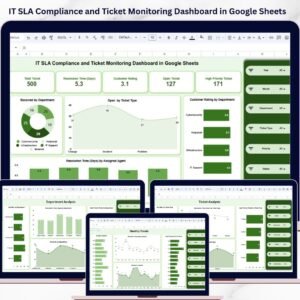
📊 Overview Page — Displays 5 KPI cards (Total Ticket, Resolution Time (Days), Customer Rating, Open Ticket, High Priority Ticket) along with charts showing Resolved by Department, Open by Ticket Type, Customer Rating by Department, and Resolution Time (Days) by Assigned Agent. Multiple slicers allow instant filtering across all dimensions for quick drill-down analysis.
 IT SLA Compliance and Ticket Monitoring Dashboard in Google Sheets
🏢 Department Analysis Page — Deep-dive into department-level performance with charts showing SLA Met by Department, Resolution Time (Days) by Department, High Priority Ticket by Department, and Resolved by Department. Identify which departments consistently meet SLA targets and which need process improvements.
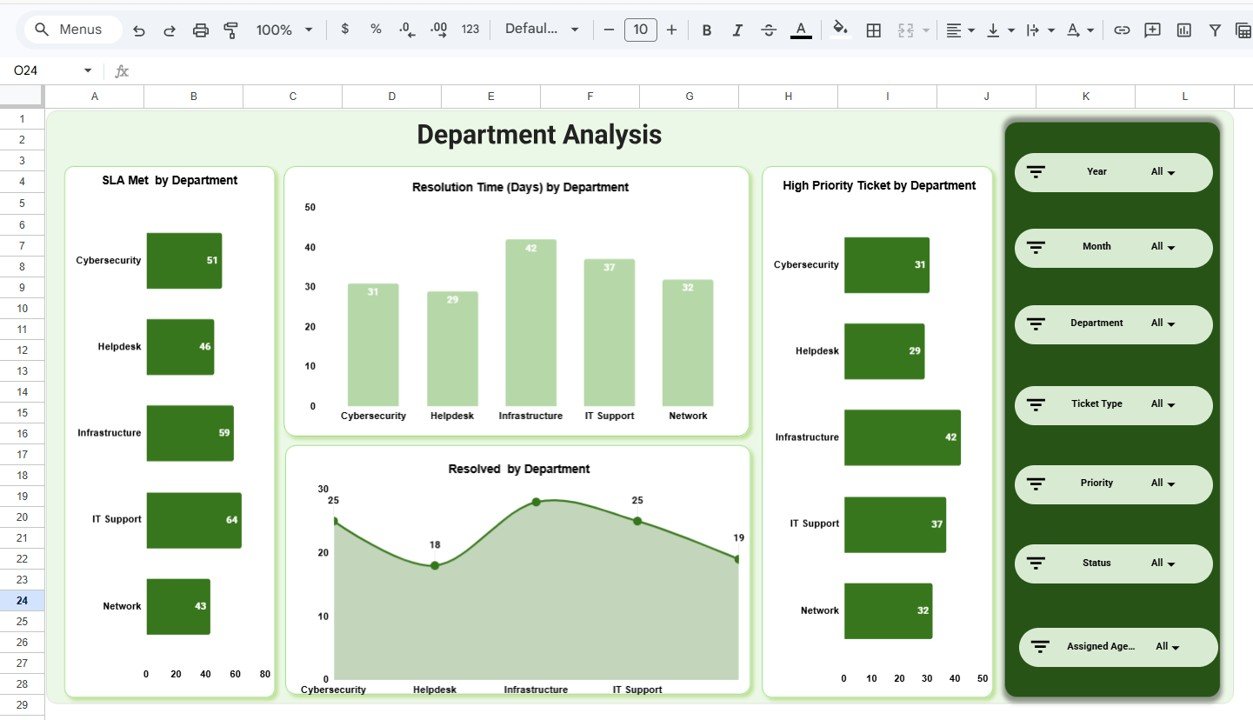 Department Analysis
🎫 Ticket Analysis Page — Analyze ticket performance by type with charts showing SLA Met by Ticket Type, Resolution Time (Days) by Ticket Type, High Priority Ticket by Ticket Type, and Resolved by Ticket Type. Understand which ticket categories take the longest to resolve and where SLA breaches are most frequent.
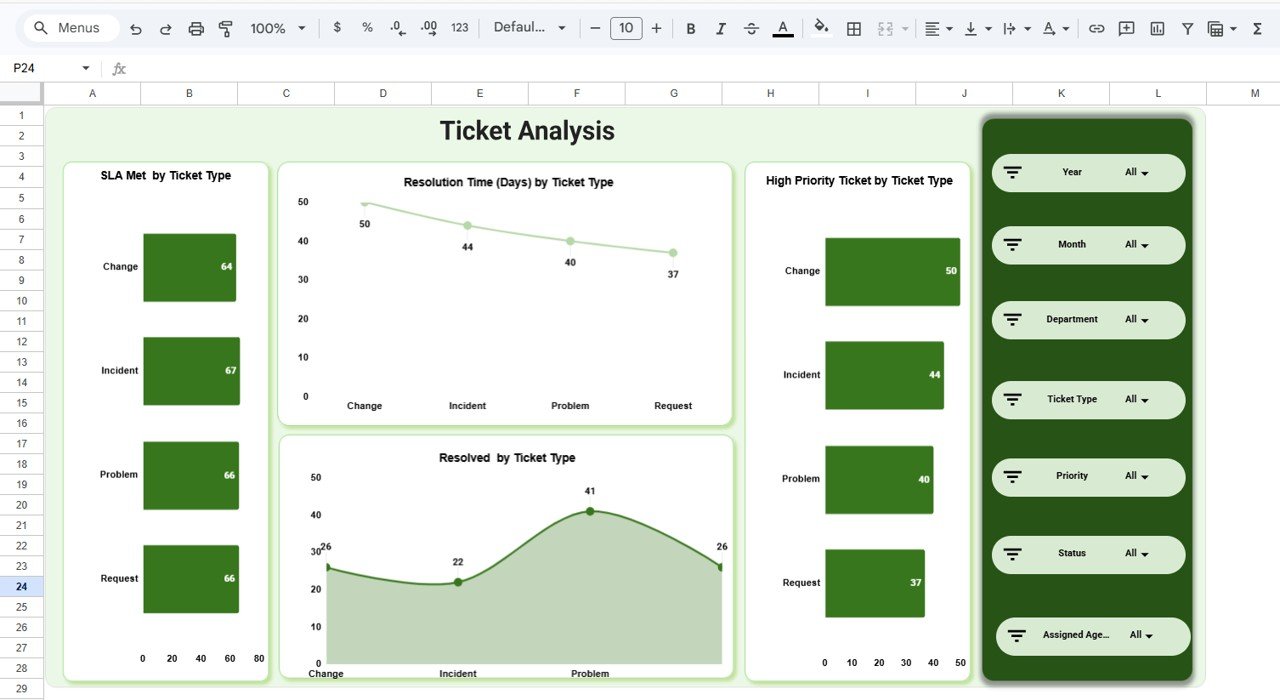 Ticket Analysis
👤 Assigned Agent Analysis Page — Evaluate individual agent productivity with charts showing SLA Met by Assigned Agent, Resolution Time (Days) by Assigned Agent, High Priority Ticket by Assigned Agent, and Resolved by Assigned Agent. Perfect for performance reviews and identifying top-performing team members.
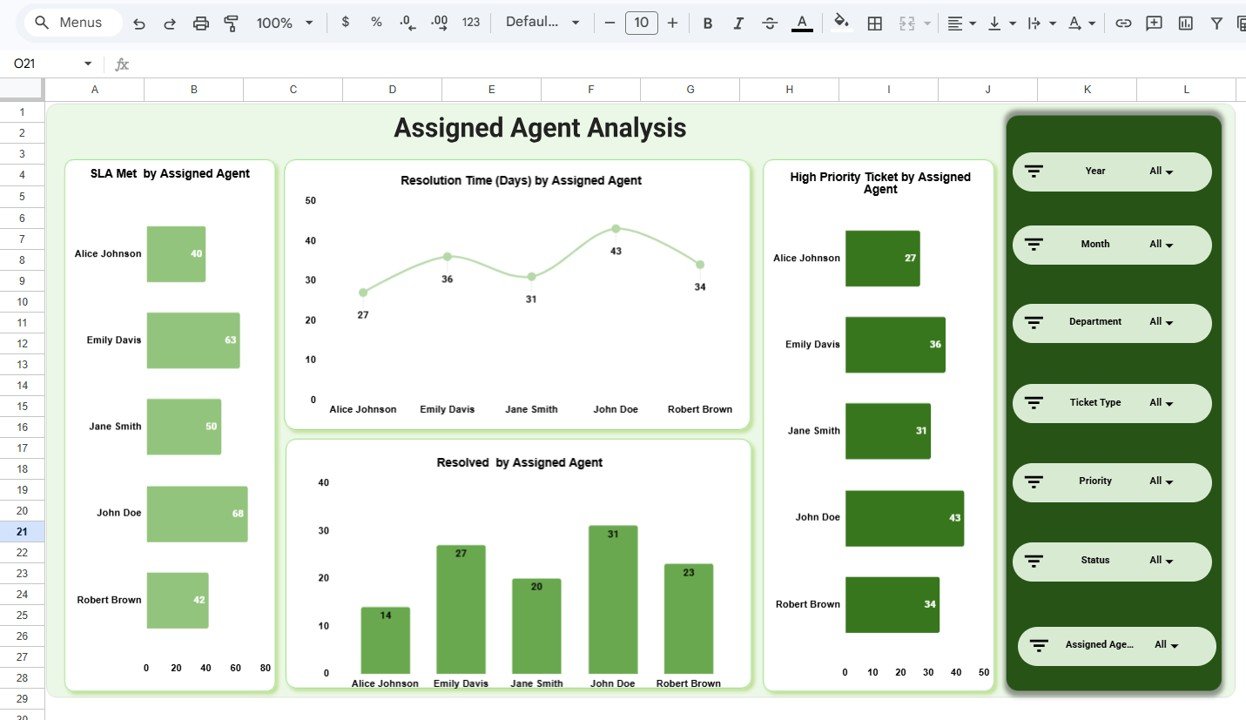 Assigned Agent Analysis
📅 Monthly Trends Page — Track temporal patterns with charts showing SLA Met by Month, Resolution Time (Days) by Month, High Priority Ticket by Month, and Resolved by Month. Spot seasonal patterns, workload spikes, and long-term improvement trends across your IT service operations.
 Monthly Trends
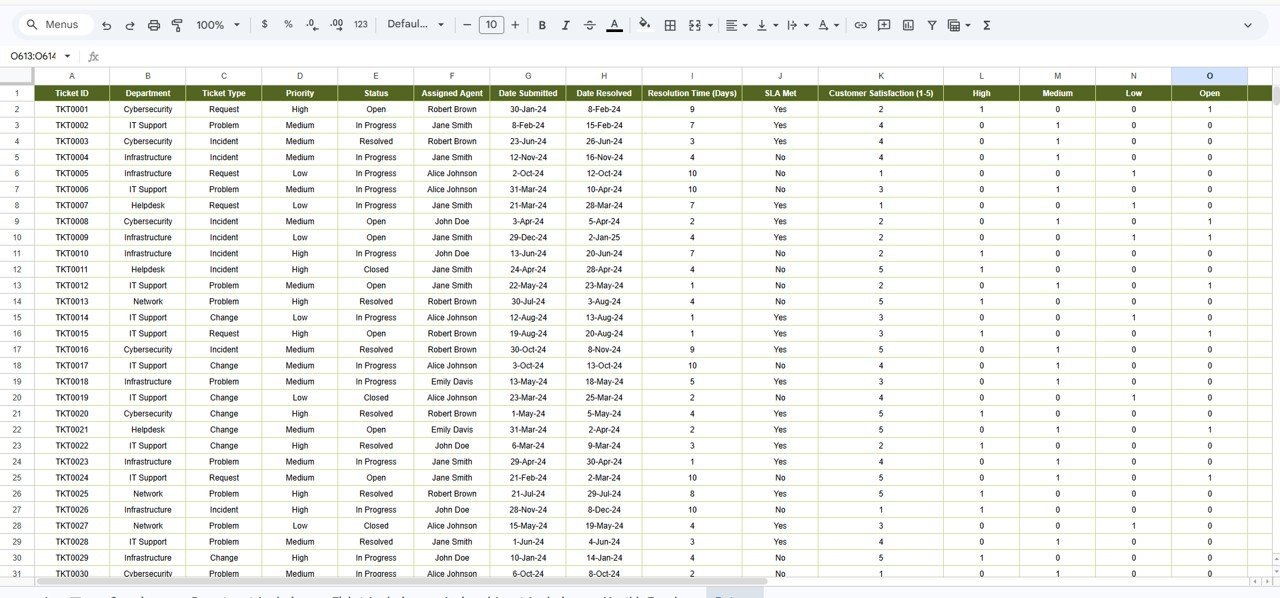
📋 Data Sheet Tab — The structured data input sheet containing all ticket records. Replace the sample data with your own IT ticket records in the same column format and all dashboard pages update automatically.
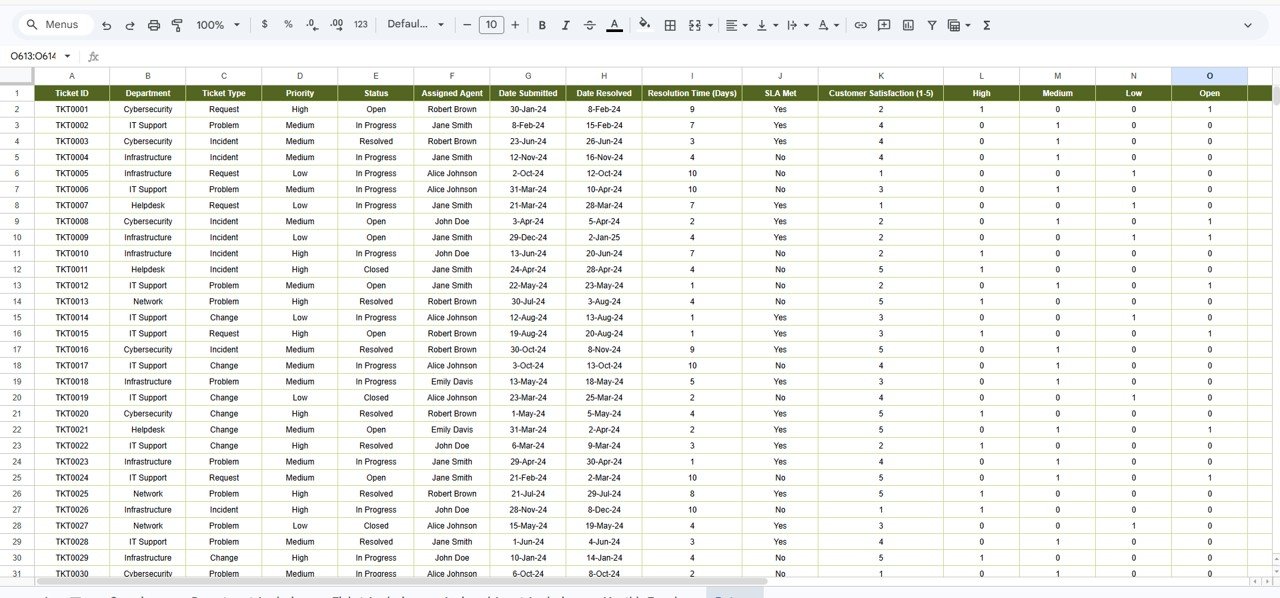 Data Sheet Tab
⚙️ How to Use the IT SLA Compliance and Ticket Monitoring Dashboard in Google Sheets
1️⃣ Get Your Copy — After purchase, open the PDF guide and click the Google Sheets copy link to create your own editable version in Google Drive.
2️⃣ Navigate to the Data Sheet — Review the sample data structure and column headers to understand the required format.
3️⃣ Replace Sample Data — Clear the sample rows and paste your own IT ticket records in the same column format.
4️⃣ Explore Dashboard Pages — Navigate through Overview, Department Analysis, Ticket Analysis, Assigned Agent Analysis, and Monthly Trends pages to analyze your data.
5️⃣ Apply Slicer Filters — Use the slicers on the Overview page to filter the dashboard by department, ticket type, priority, or any other dimension.
6️⃣ Share with Your Team — Share the Google Sheet with your IT team members for real-time collaborative analytics.
👥 Who Can Benefit from This IT SLA Compliance and Ticket Monitoring Dashboard
🖥 IT Service Managers — Monitor SLA compliance rates, ticket volumes, and resolution trends across the entire IT department.
📋 Help Desk Supervisors — Track agent performance, response times, and customer satisfaction scores for team optimization.
🏢 CIOs and IT Directors — Get executive-level insights into IT service delivery quality and SLA adherence.
🔧 Managed Service Providers (MSPs) — Present professional SLA compliance reports to clients using ready-made visualizations.
📊 Business Analysts — Generate actionable insights for IT process improvement and strategic planning.
Whether you manage internal IT support or external help desk operations, this IT Service Dashboard provides the visibility you need to deliver faster, more reliable IT support with guaranteed SLA compliance.
❓ Frequently Asked Questions
What KPIs does the IT SLA Compliance and Ticket Monitoring Dashboard in Google Sheets track?
The IT SLA Compliance and Ticket Monitoring Dashboard in Google Sheets tracks 5 key performance indicators including Total Ticket, Resolution Time (Days), Customer Rating, Open Ticket, and High Priority Ticket. It also analyzes SLA Met rates, resolution times, high priority tickets, and resolved counts across departments, ticket types, assigned agents, and monthly trends across 5 interactive dashboard pages.
Do I need advanced Google Sheets skills to use this dashboard?
No. Simply make a copy of the Google Sheet using the link provided in the PDF guide, replace the sample data with your own IT ticket records, and all charts and KPI cards update automatically. No scripts, macros, or advanced formulas to configure.
Can multiple team members access this dashboard simultaneously?
Yes. Since this dashboard runs on Google Sheets, you can share it with your entire IT team via Google Drive. Multiple users can view and analyze the dashboard simultaneously from any device with internet access.
What is the best Google Sheets template for tracking IT SLA compliance?
The IT SLA Compliance and Ticket Monitoring Dashboard in Google Sheets from NextGenTemplates is one of the best options available. It includes 5 interactive dashboard pages, 5 KPI cards, SLA compliance tracking by department, ticket type, agent, and month, plus a structured data sheet — all in a single collaborative Google Sheets workbook.
Can I customize the ticket categories and departments in this dashboard?
Yes. The data sheet allows you to define your own ticket types, department names, agent names, priority levels, and SLA targets. All charts across the dashboard adapt automatically to your custom data structure.
🔗 Explore Related Templates
📊 IT Services Dashboard in HTML — Track IT service requests, SLA compliance, team performance, and service trends with interactive browser-based analytics.
📊 Cloud Migration Services Dashboard in Excel — Monitor cloud migration budget, workloads, downtime, and costs with pivot-powered Excel charts.
📊 Cloud Migration Services Dashboard in Power BI — Track cloud migration projects across platforms and industries with interactive Power BI visuals.
Browse all Google Sheets Dashboard Templates on NextGenTemplates.
📖 Click here to read the Detailed Blog Post
Watch the step-by-step video tutorial:


Reviews
There are no reviews yet.