

IT Services Dashboard in HTML is a powerful, interactive, and ready-to-use analytics solution built for IT service managers, help desk supervisors, technical support teams, and IT consultants who want to monitor service requests, track SLA compliance, analyze team performance, and evaluate time-based trends from a single centralized web-based interface. This dashboard includes 5 interactive analytical pages and a comprehensive data view, making it the most complete HTML Dashboard for IT service operations available today.
If you are managing IT support tickets using scattered spreadsheets and manual reports, this IT Services Dashboard in HTML transforms your approach completely by delivering real-time visual insights through a modern browser-based interface. The dashboard tracks 6 key metrics including Total Requests, Avg Response Time, Avg Resolution Time, Avg Customer Rating, Closed Requests, and SLA Compliance — giving you complete visibility into your IT service operations at a glance.
🔑 Key Features of IT Services Dashboard in HTML
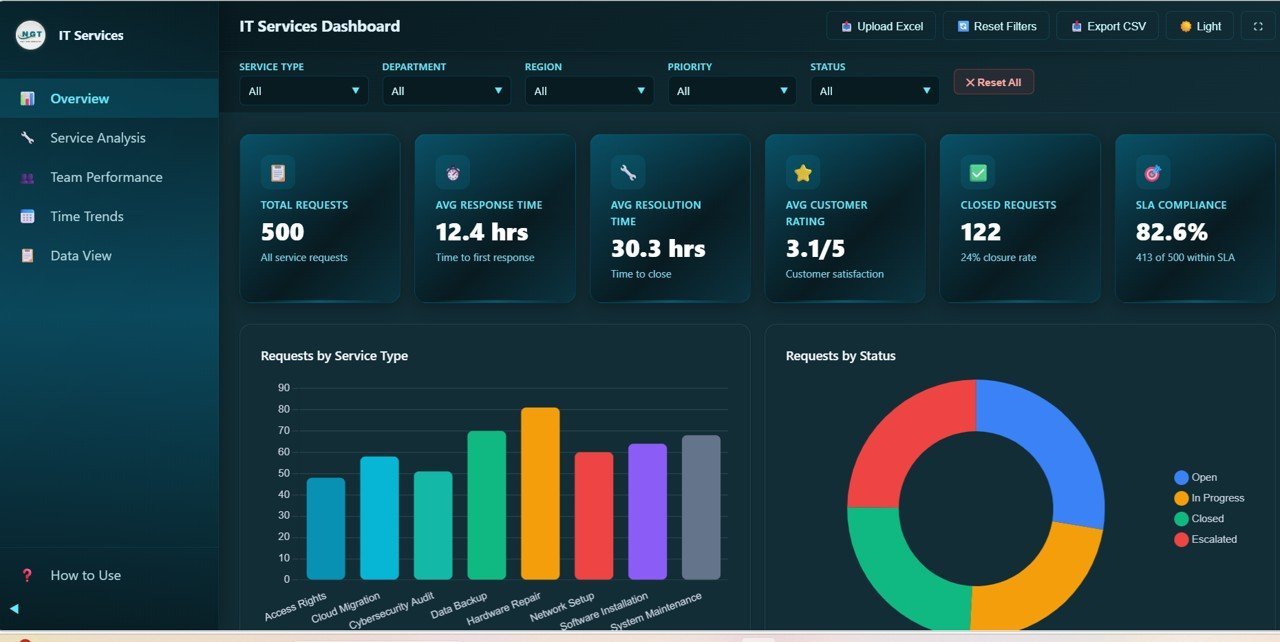
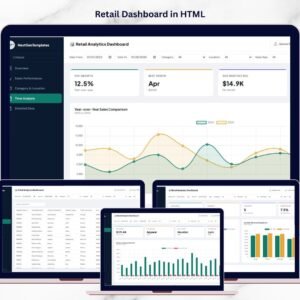
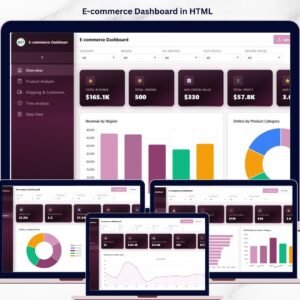
📊 Interactive Overview Dashboard — Get a complete snapshot of your IT service operations with high-level KPI cards including Total Requests, Avg Response Time, Avg Resolution Time, Avg Customer Rating, Closed Requests, and SLA Compliance all in one view.
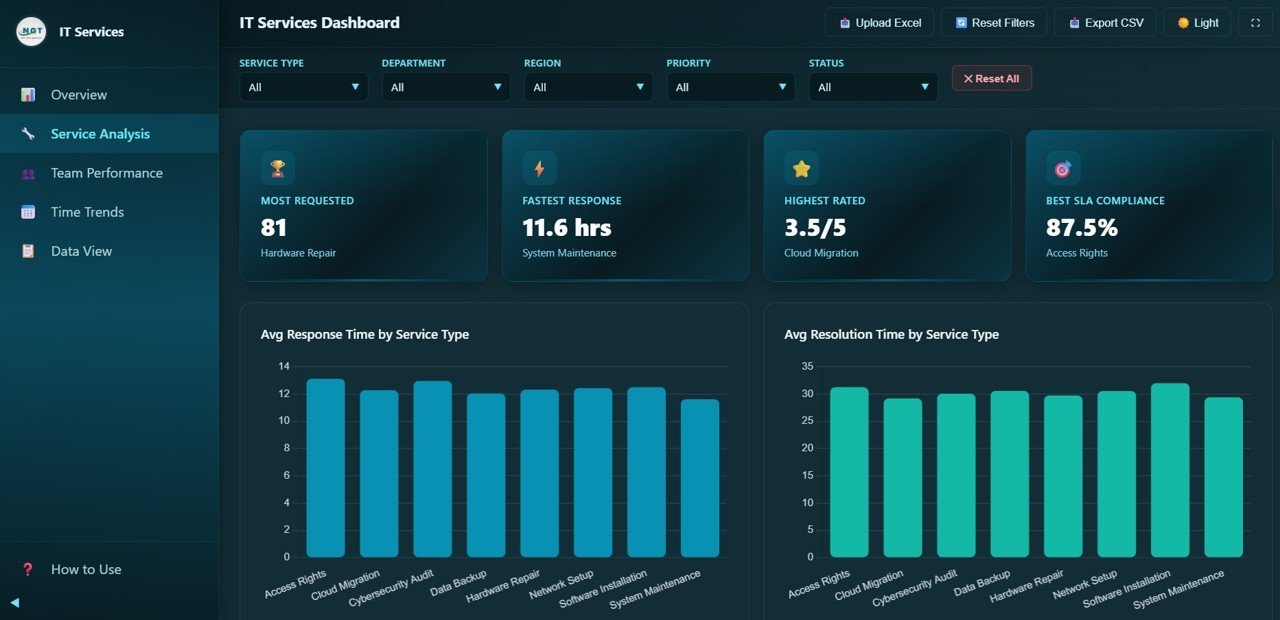
📈 Service Analysis Page — Analyze average response times, resolution times, customer satisfaction ratings, and SLA compliance rates across different IT service types using dynamic visual charts.
👨🔧 Team Performance Tracking — Monitor individual technician workload, customer ratings, resolution speed, and escalation rates to optimize IT team efficiency and identify top performers.
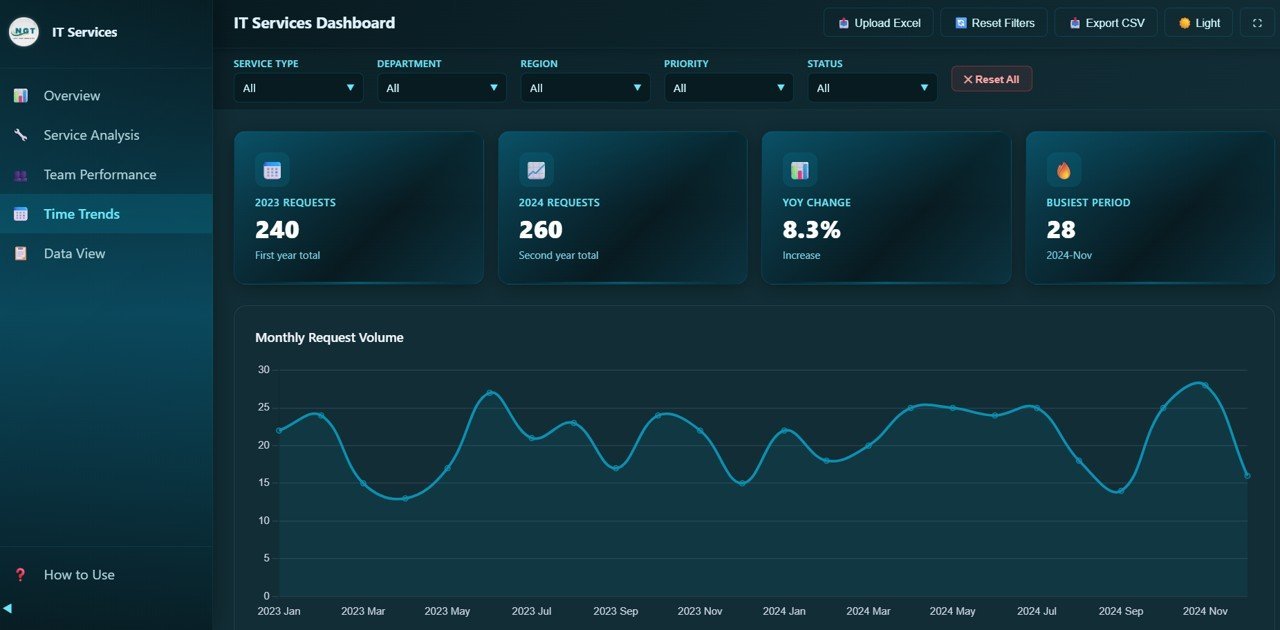
📅 Time Trend Analysis — Visualize monthly request volumes, response time trends, customer rating patterns, and status distribution over time to spot seasonal patterns and workload spikes.
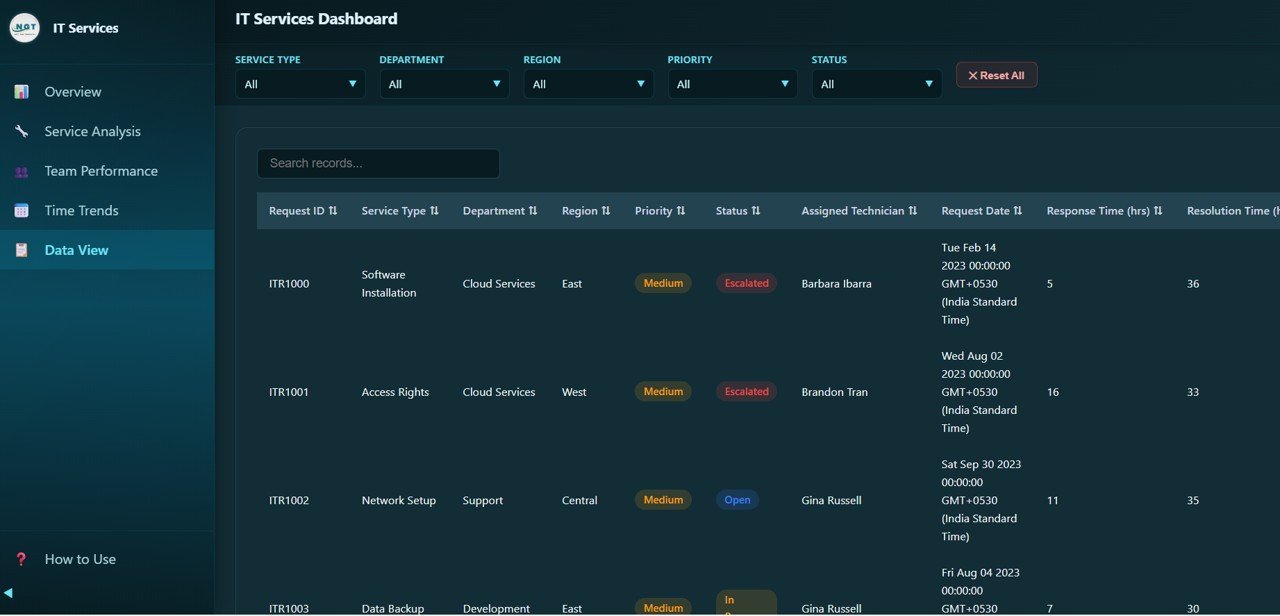
🔍 Data Explorer with Search and Export — Access a detailed data table with search functionality, sortable columns, pagination, and CSV export options for deeper analysis of all service records.
⚡ Real-Time Filters and Slicers — Apply multiple slicers to filter the entire dashboard quickly by service type, department, priority, status, and region for instant drill-down analysis.
🌐 Modern Responsive Design — Clean, professional, and mobile-friendly interface that works seamlessly in any modern web browser without any installation or setup required.
🔒 100% Client-Side Privacy — All data processing happens locally in your browser. No server, no tracking, no cloud dependency — your IT service data stays completely private and secure.
📦 What’s Inside the IT Services Dashboard in HTML
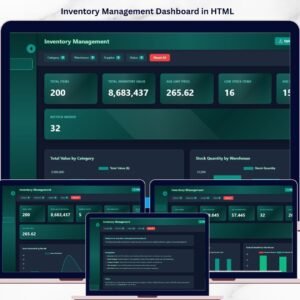
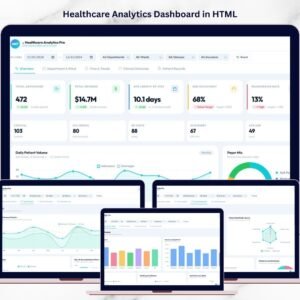
📁 Overview Page — High-level KPI cards showing Total Requests, Avg Response Time, Avg Resolution Time, Avg Customer Rating, Closed Requests, and SLA Compliance. Charts include Requests by Service Type, Requests by Status, Requests by Department, Requests by Priority, and Requests by Region for complete operational visibility across your IT service desk.

Service Analysis
📁 Service Analysis Page — Detailed analysis showing Avg Response Time by Service Type, Avg Resolution Time by Service Type, Avg Customer Rating by Service Type, and SLA Compliance by Service Type to help IT managers optimize service delivery and identify bottlenecks across different request categories.
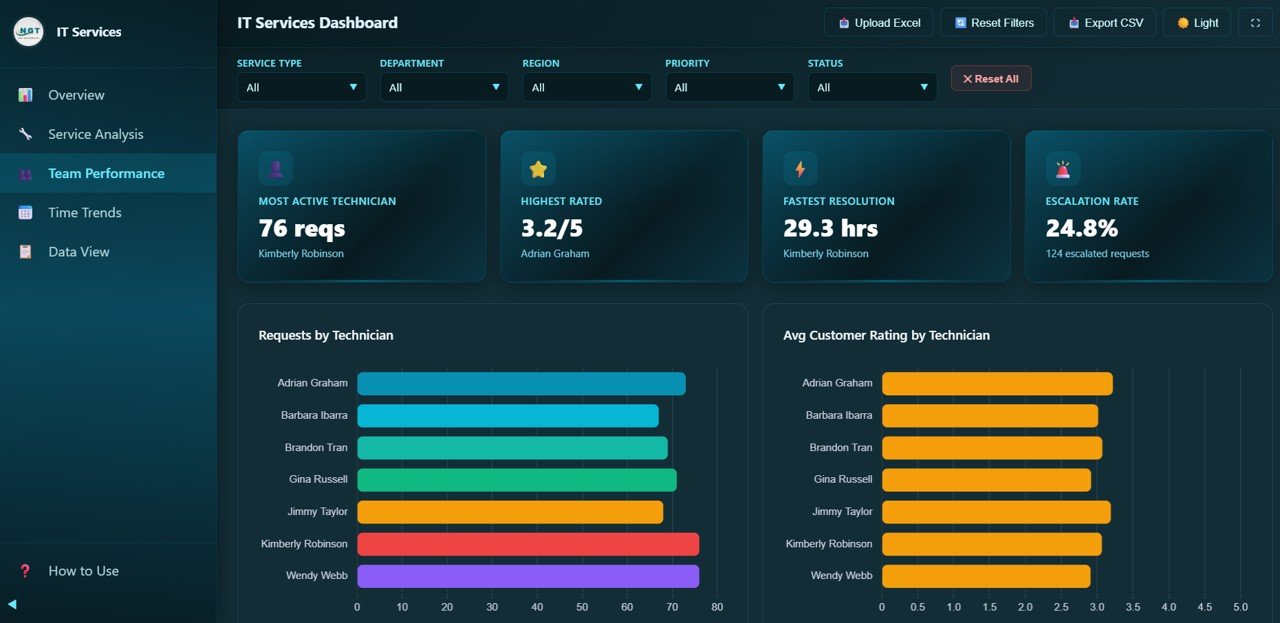
Team Performance
📁 Team Performance Page — Track Requests by Technician, Avg Customer Rating by Technician, Avg Resolution Time by Technician, and Escalation Rate by Technician for complete workforce evaluation and optimization of your IT support team.
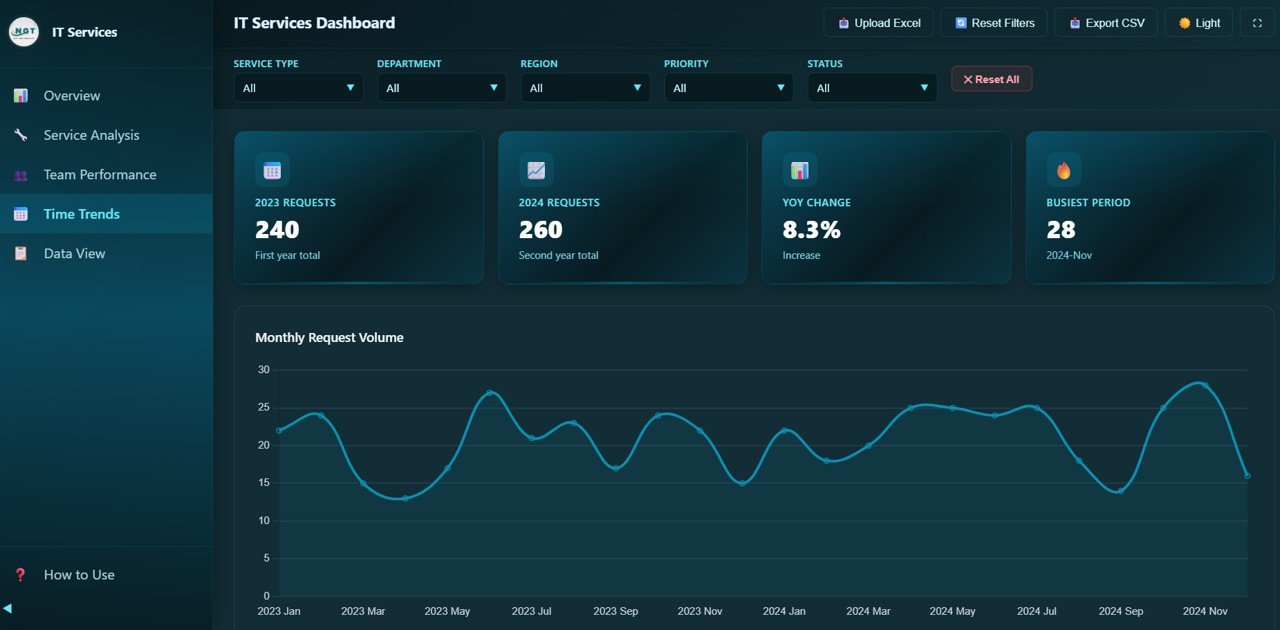
Time Trends
📁 Time Trends Page — Analyze Monthly Request Volume, Avg Response Time by Month, Avg Customer Rating by Month, and Monthly Status Distribution to understand long-term patterns and plan IT staffing accordingly.

Data View
📁 Data View Page — Searchable and sortable detailed data table with pagination and CSV export for record-level analysis of all IT service requests and tickets.
⚙️ How to Use the IT Services Dashboard in HTML
👉 Step 1: Unzip the downloaded file and locate the index.html file
👉 Step 2: Open the HTML dashboard file in any modern web browser (Chrome, Firefox, Edge)
👉 Step 3: Replace the sample data with your own IT service records in the data file
👉 Step 4: Use slicers to filter data by service type, department, priority, status, or region
👉 Step 5: Navigate through all five pages to analyze requests, services, technicians, trends, and detailed records
💡 No complex setup, no server, no database required — just open in your browser and start analyzing your IT service operations instantly!
👥 Who Can Benefit from This IT Services Dashboard in HTML
✔️ IT Service Managers — Monitor request volumes, resolution rates, SLA compliance, and escalation trends across the entire IT department
✔️ Help Desk Supervisors — Track technician performance, response times, and customer satisfaction scores
✔️ CIOs and IT Directors — Get executive-level insights into IT service delivery quality and efficiency
✔️ Technical Support Teams — Identify bottlenecks in service delivery and improve resolution workflows
✔️ IT Consultants — Present professional service analytics to clients with ready-made visualizations
✔️ Business Analysts — Generate actionable insights for IT process improvement and strategic planning
Whether you manage internal IT support, managed services, or enterprise help desk operations, this IT Services Dashboard provides the visibility you need to deliver faster, more reliable IT support.
❓ Frequently Asked Questions
What KPIs does the IT Services Dashboard in HTML track?
The IT Services Dashboard in HTML tracks 6 key performance indicators including Total Requests, Avg Response Time, Avg Resolution Time, Avg Customer Rating, Closed Requests, and SLA Compliance. These KPIs provide complete visibility into IT service desk performance.
Do I need any technical skills to use this HTML dashboard?
No. Simply unzip the file, open index.html in any modern web browser, and start analyzing. No coding, database, or server setup is required. Replace sample data with your own and all charts update automatically.
Can I filter the dashboard by department or service type?
Yes. The dashboard includes multiple interactive slicers that let you filter all pages simultaneously by Service Type, Department, Priority, Status, and Region for instant drill-down analysis.
Is my IT service data secure with this dashboard?
Absolutely. This dashboard runs 100% client-side in your browser. No data is sent to any server, cloud, or third party. Your IT service records remain completely private on your local machine.
What is the best HTML dashboard template for IT service management?
The IT Services Dashboard in HTML by NextGenTemplates is one of the best options available. It includes 5 interactive pages covering overview, service analysis, team performance, time trends, and detailed data view with search, sort, and CSV export capabilities.
Can I export data from this dashboard?
Yes. The Data View page includes a built-in CSV export feature that allows you to download filtered IT service records for further analysis in Excel, Google Sheets, or any other tool.
🔗 Explore Related Templates
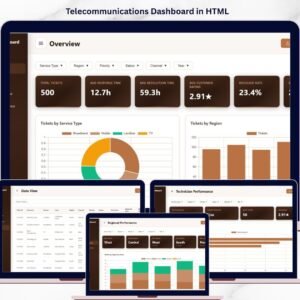
📊 Telecommunications Dashboard in HTML — Track telecom ticket performance, service quality, and technician productivity with interactive analytics.
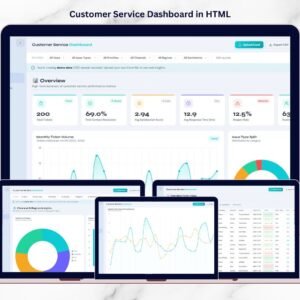
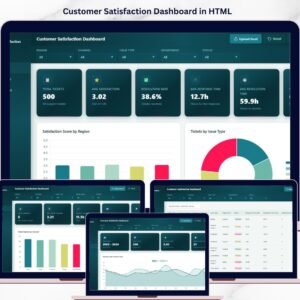
📊 Customer Service Dashboard in HTML — Analyze customer support tickets, satisfaction scores, and agent performance with browser-based charts.
📊 IT Dashboard in Google Sheets — A Google Sheets alternative for IT analytics with built-in pivot tables, charts, and data automation.
📖 Click here to read the Detailed Blog Post
🎥 Visit our YouTube channel to learn step-by-step video tutorials
👉 YouTube.com/@NextGenTemplates
Watch the step-by-step video tutorial:
YouTube


Reviews
There are no reviews yet.