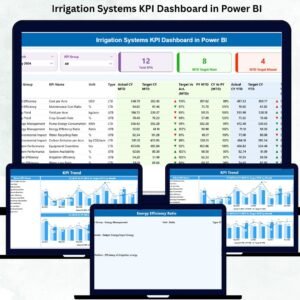
Irrigation Systems KPI Dashboard in Power BI Efficient irrigation is the backbone of modern agriculture 🌱. Monitoring water usage, pump efficiency, field coverage, and overall system performance is crucial to reducing costs, improving crop yield, and ensuring sustainability. The Irrigation Systems KPI Dashboard in Power BI is a ready-to-use solution that transforms your Excel data into actionable insights, helping farm managers, operators, and engineers make smarter decisions in real time.
Irrigation Systems KPI Dashboard in Power BI This dashboard collects, visualizes, and tracks key irrigation KPIs through a clean, intuitive interface. Irrigation Systems KPI Dashboard in Power BI With its comprehensive structure and automated updates, managing complex irrigation systems becomes simpler, faster, and more precise.
Key Features of Irrigation Systems KPI Dashboard in Power BI 💡
-
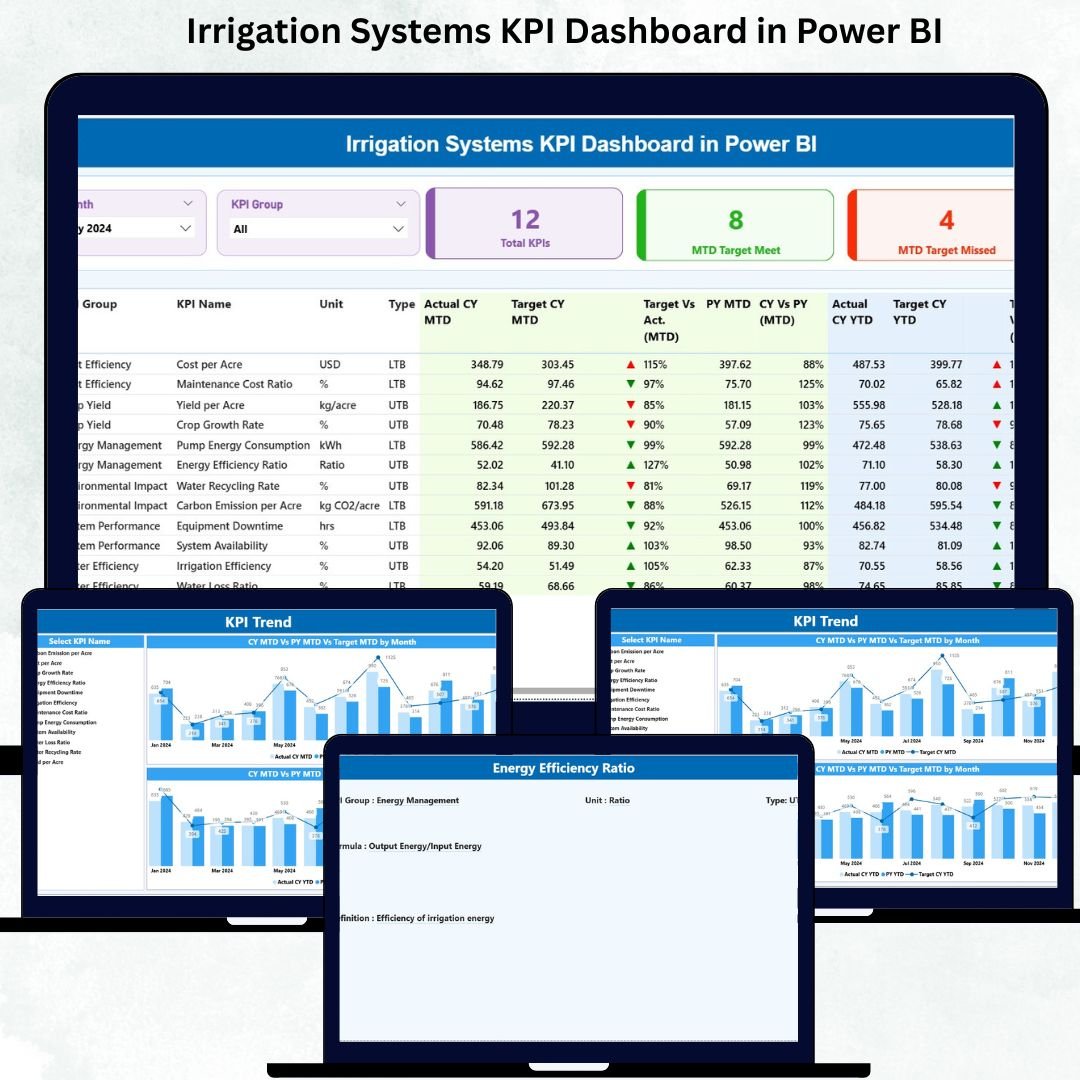
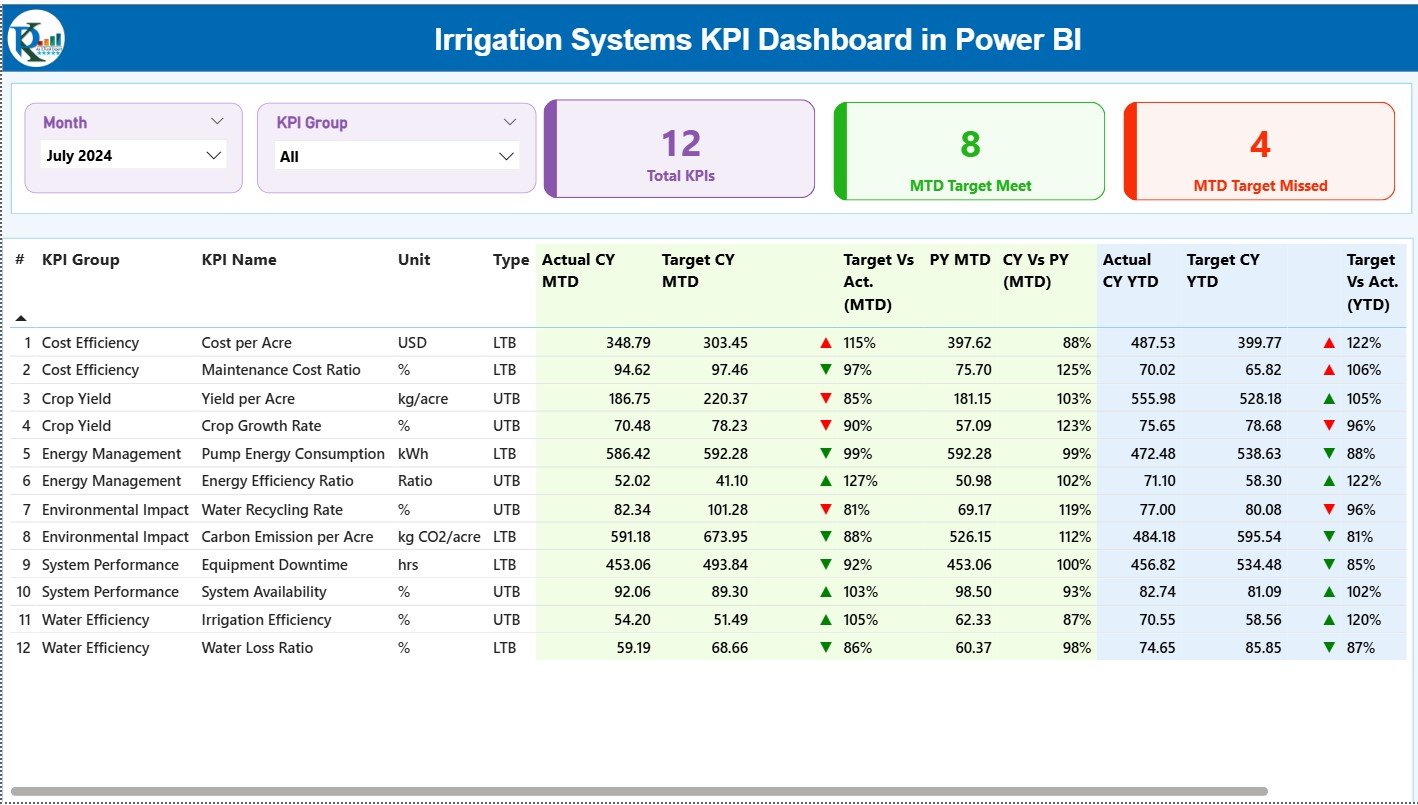
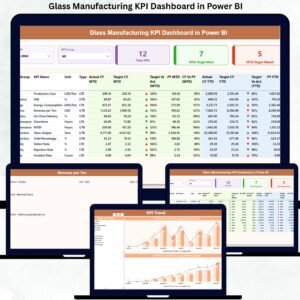
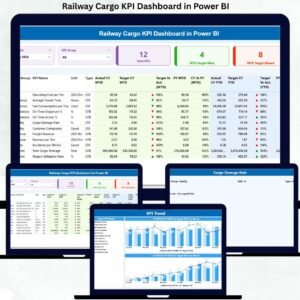
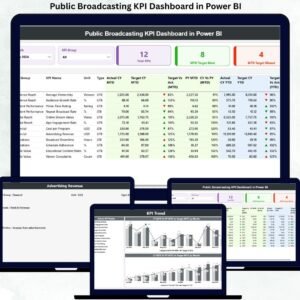
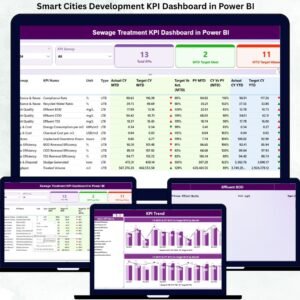
Summary Page – Central Performance Hub: View all essential KPIs at a glance. Track total KPIs, targets met, and targets missed. Filter by month or KPI group to quickly assess system health.
-
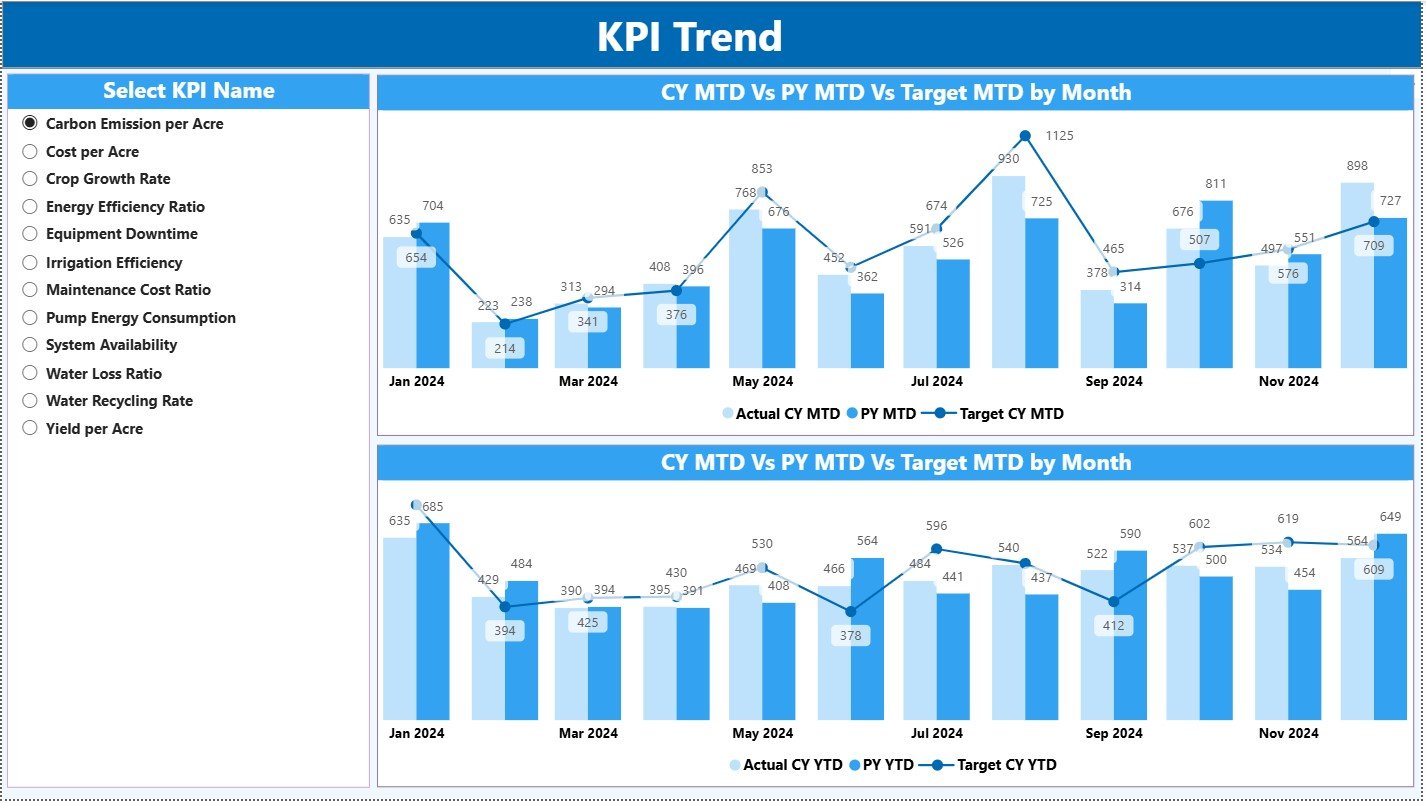
KPI Trend Page – Track Long-Term Performance 📊: Visualize trends for MTD and YTD values using combo charts. Monitor seasonal water usage, efficiency improvements, and system reliability over months or years.
-
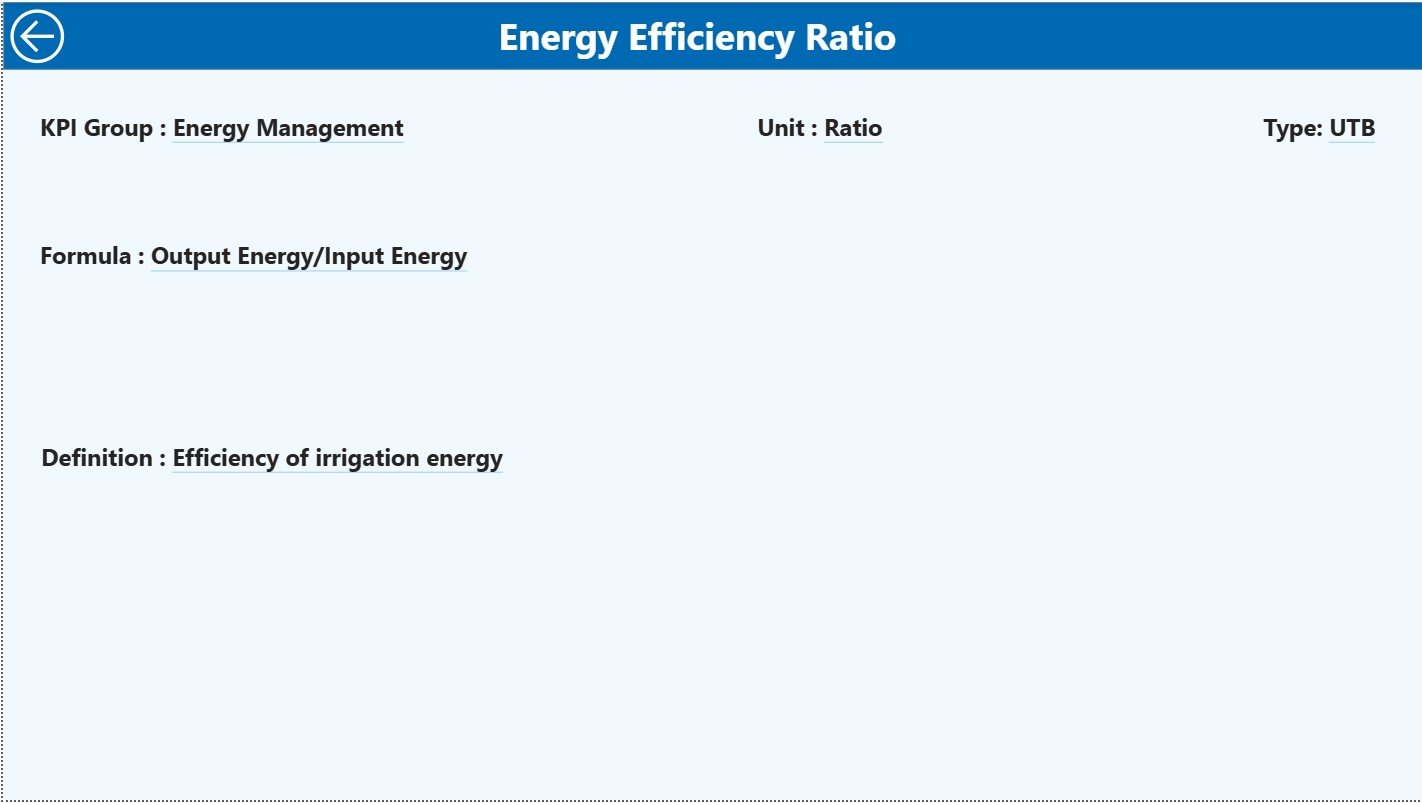
KPI Definition Page – Clear Understanding 🔍: Drill through to see each KPI’s formula, unit, and type (LTB or UTB). Remove confusion and ensure everyone on your team understands the metrics.
-
Real-Time Updates ⚡: As soon as data in Excel changes, Power BI updates visuals automatically, enabling immediate action.
-
Customizable KPIs 🛠️: Easily add or modify KPIs to match evolving operational goals and reporting requirements.
What’s Inside the Irrigation Systems KPI Dashboard 📦
-
Excel Data Source: Three worksheets — Input Actual, Input Target, and KPI Definition — for seamless data entry and dashboard updates.
-
Summary Page: Quick snapshot of KPIs with cards, detailed tables, and visual indicators (green ▲ for met, red ▼ for missed).
-
KPI Trend Page: Track performance trends across MTD and YTD metrics with clear visual charts.
-
KPI Definition Page: Provides complete KPI explanations to ensure accurate interpretation and reporting.
-
Best Practices Guide: Tips for maintaining data accuracy, updating KPIs, and maximizing dashboard efficiency.
How to Use the Irrigation Systems KPI Dashboard 🖥️
-
Enter actual and target values in the Excel sheets weekly or monthly.
-
Use the Summary Page to monitor overall system performance and identify KPIs that need attention.
-
Check the KPI Trend Page to track seasonal or long-term trends.
-
Drill into the KPI Definition Page for clear KPI explanations.
-
Apply filters such as Month and KPI Group to focus on specific areas or systems.
-
Share dashboard insights with your team to enable faster, data-driven decisions.
Who Can Benefit from This Irrigation KPI Dashboard 👥
-
Farm Managers: Quickly see pump efficiency, water usage, and system health.
-
Irrigation Operators: Monitor coverage, detect inefficiencies, and prevent downtime.
-
Agricultural Engineers: Analyze performance trends and recommend improvements.
-
Analysts: Compare MTD and YTD performance, generate actionable insights.
-
Decision Makers: Make data-backed operational and financial decisions.
Whether the goal is reducing water wastage, optimizing energy use, or improving crop output, this dashboard delivers a complete overview of irrigation performance in a visually intuitive way. It’s your ultimate tool for efficiency, sustainability, and growth.


Reviews
There are no reviews yet.