


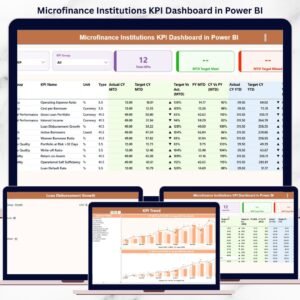
The Investment Management KPI Dashboard in Power BI is a powerful tool designed to help financial professionals, portfolio managers, and investors track and optimize their investment strategies. This customizable dashboard consolidates key performance indicators (KPIs) related to asset performance, portfolio returns, risk management, and investment allocation—all in one interactive platform.
With real-time data visualization, this dashboard allows users to monitor and evaluate the performance of individual assets, sectors, and portfolios, enabling data-driven investment decisions. Whether you are managing a single portfolio or a diverse range of investments, this tool provides clear insights into risk, return, and overall investment health, helping you to maximize profitability and minimize risk exposure.
Key Features of the Investment Management KPI Dashboard in Power BI
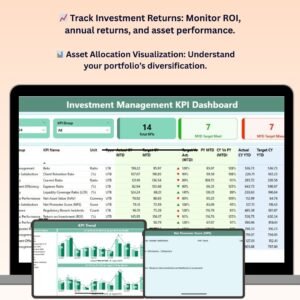
📈 Track Investment Returns
Monitor the return on investment (ROI), annualized returns, and comparative performance of different asset classes. Track performance against benchmarks to evaluate the success of your investment strategy.
📊 Asset Allocation Insights
Visualize and analyze the distribution of assets across various sectors, industries, and investment types. Understand how well your portfolio is diversified and ensure it aligns with your risk tolerance and goals.
📉 Risk Management Metrics
Track key risk indicators such as volatility, beta, value at risk (VaR), and maximum drawdown. Assess the risk levels of your investments to make informed decisions and mitigate potential losses.
💹 Performance Comparison & Benchmarking
Compare the performance of your portfolio and individual assets against market benchmarks, competitors, or historical performance. Make adjustments based on real-time performance insights.
🔄 Real-Time Data & Visual Reports
Receive real-time updates on portfolio performance and market conditions. Use interactive charts and reports to visualize trends, track progress, and share insights with stakeholders.
📝 Customizable KPIs & Reports
Tailor the dashboard to suit your specific investment strategy and objectives. Modify KPIs, performance metrics, and reports to reflect the unique characteristics of your portfolio.
Why You’ll Love the Investment Management KPI Dashboard in Power BI

✅ Maximize Portfolio Returns
Track key metrics like ROI, annual returns, and asset allocation to optimize your investment strategy and maximize portfolio profitability.
✅ Ensure Proper Risk Management
Monitor risk indicators such as volatility, beta, and Var to ensure your investments are in line with your risk tolerance and objectives.
✅ Gain Real-Time Insights
Track your investments and market conditions in real-time, allowing you to make proactive decisions and stay ahead of market trends.
✅ Optimize Asset Allocation
Visualize your asset allocation and make informed decisions about portfolio diversification. This will help ensure that your investments are balanced and aligned with your financial goals.
✅ Fully Customizable & Scalable
This dashboard can be customized to meet the specific needs of your portfolio or investment strategy. It is scalable to support large investment firms, individual investors, or financial advisors managing multiple portfolios.
What’s Inside the Investment Management KPI Dashboard Template in Power BI?
- Investment Performance Tracking: Monitor ROI, annual returns, and individual asset performance.
- Asset Allocation Analysis: Visualize how your assets are distributed across sectors and industries.
- Risk Management KPIs: Track metrics like volatility, VaR, beta, and maximum drawdown.
- Benchmark Comparisons: Compare your portfolio’s performance against industry benchmarks and competitors.
- Real-Time Updates & Reports: Receive up-to-date performance data and visual insights on your investments.
- Customizable Reports & KPIs: Modify KPIs and reports to align with your unique investment strategy and goals.
How to Use the Investment Management KPI Dashboard in Power BI
1️⃣ Download the Template: Get immediate access to the Investment Management KPI Dashboard in Power BI.
2️⃣ Input Investment Data: Enter your portfolio data, including asset classes, investment returns, and market benchmarks.
3️⃣ Track Performance: Use the dashboard to monitor key KPIs such as ROI, asset allocation, and risk metrics.
4️⃣ Make Data-Driven Decisions: Use real-time insights and performance comparisons to optimize your investment strategy.
5️⃣ Generate Reports & Insights: Create custom reports and visualizations to track progress, analyze performance, and share insights with stakeholders.
Who Can Benefit from the Investment Management KPI Dashboard in Power BI?
🔹 Portfolio Managers & Financial Advisors
🔹 Asset Managers & Hedge Fund Managers
🔹 Private Investors & Institutional Investors
🔹 Risk Management Professionals
🔹 Investment Analysts & Strategy Teams
🔹 CFOs & Financial Executives
Maximize your investment returns, manage risk, and optimize your portfolio with the Investment Management KPI Dashboard in Power BI. Track real-time performance, visualize asset allocation, and make smarter investment decisions.
Click here to read the Detailed blog post
Visit our YouTube channel to learn step-by-step video tutorials
Youtube.com/@PKAnExcelExpert


Reviews
There are no reviews yet.