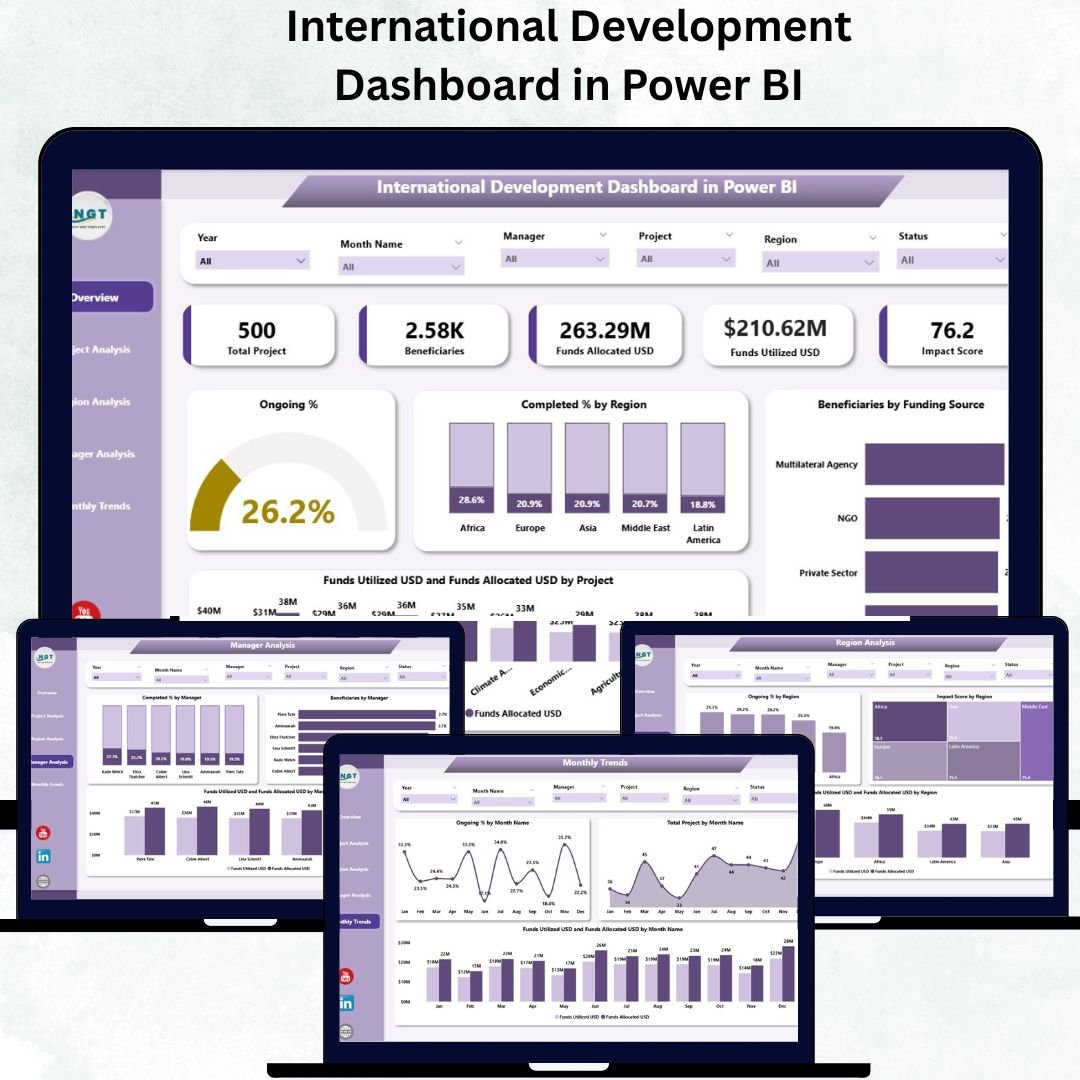
🌍 Managing global development projects across multiple countries can be complex — from tracking funds and beneficiaries to measuring long-term impact. The International Development Dashboard in Power BI solves this challenge by bringing all critical data into one dynamic, visual, and interactive platform.
Built for NGOs, donor agencies, and government departments, this ready-to-use Power BI template empowers decision-makers to monitor performance, evaluate funding utilization, and measure impact against international development goals — all in real time.
✨ Key Features of the International Development Dashboard
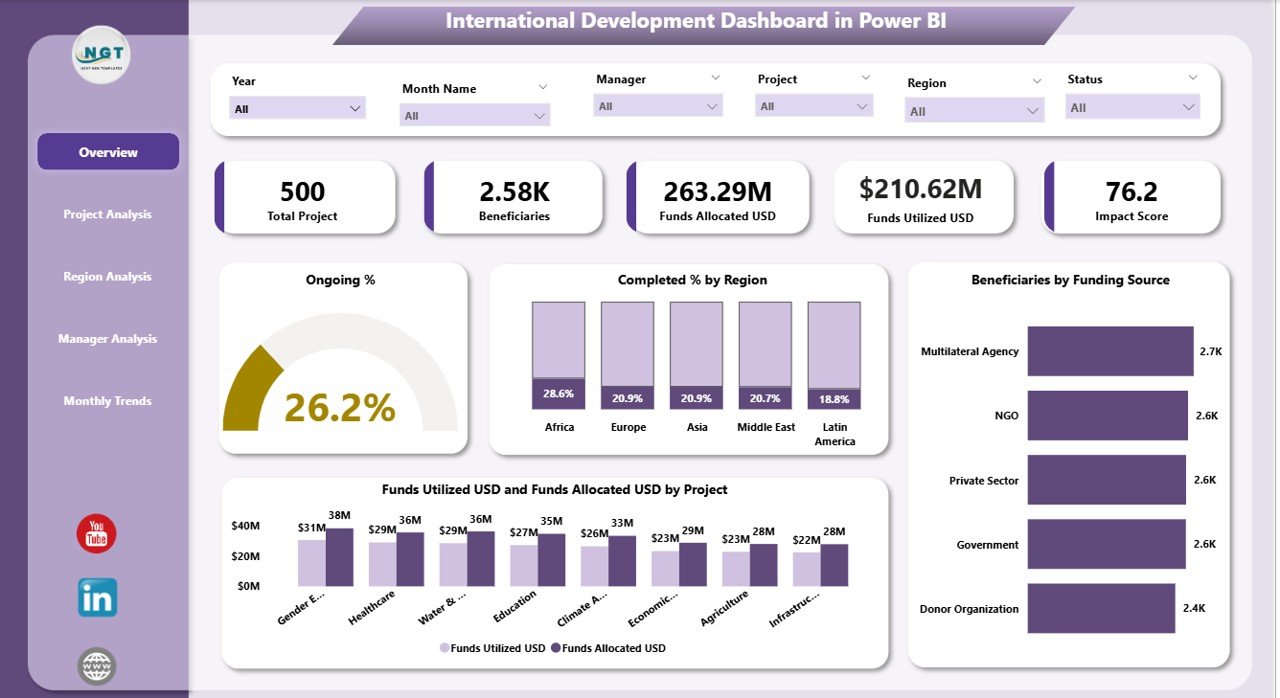
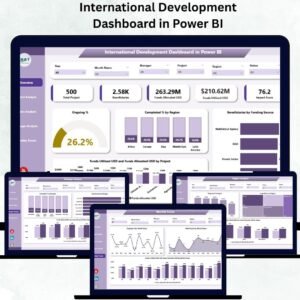
✅ 📊 Interactive Overview Page – Get an instant global snapshot with five KPI cards (Total Projects, Ongoing Projects, Completion %, Total Funds, and Beneficiaries) and four charts showing Ongoing %, Completed % by Region, Beneficiaries by Funding Source, and Funds Utilized vs Total Funds.
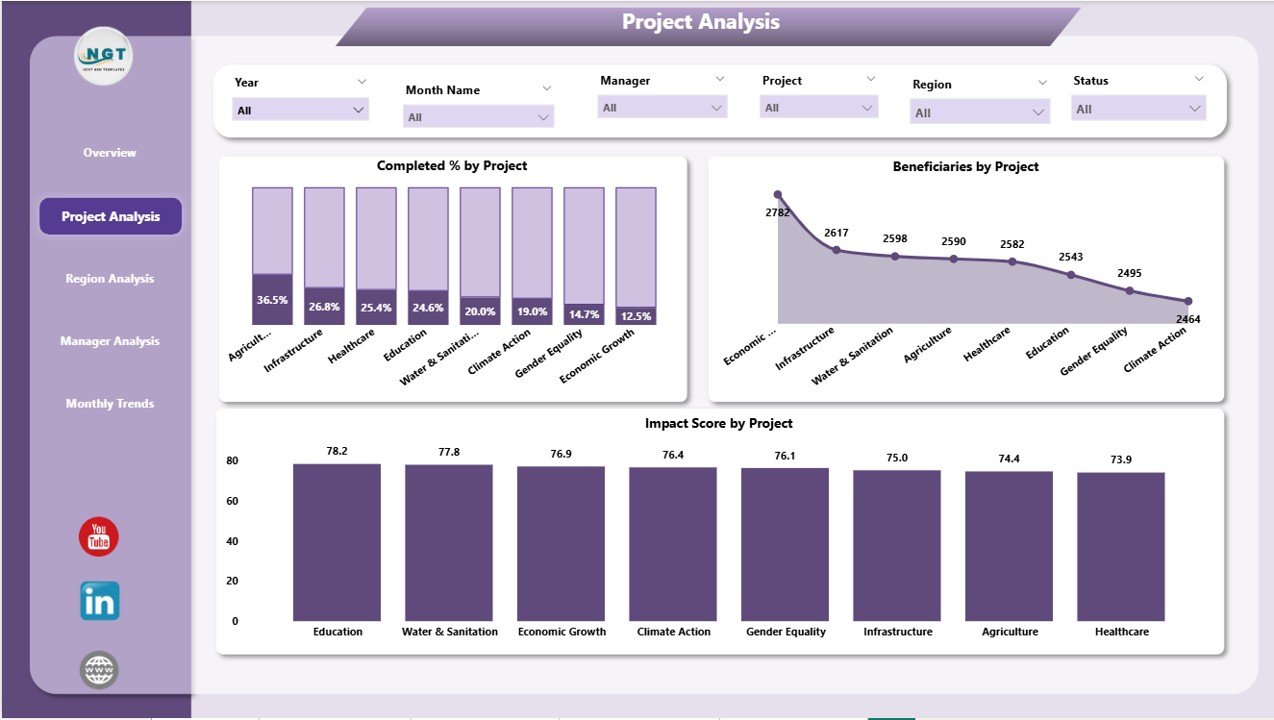
✅ 📁 Project Analysis Page – Evaluate individual project success with visual insights on Completed %, Beneficiaries, and Impact Score by project. Filter by project type, funding source, or duration to identify what’s driving the most change.
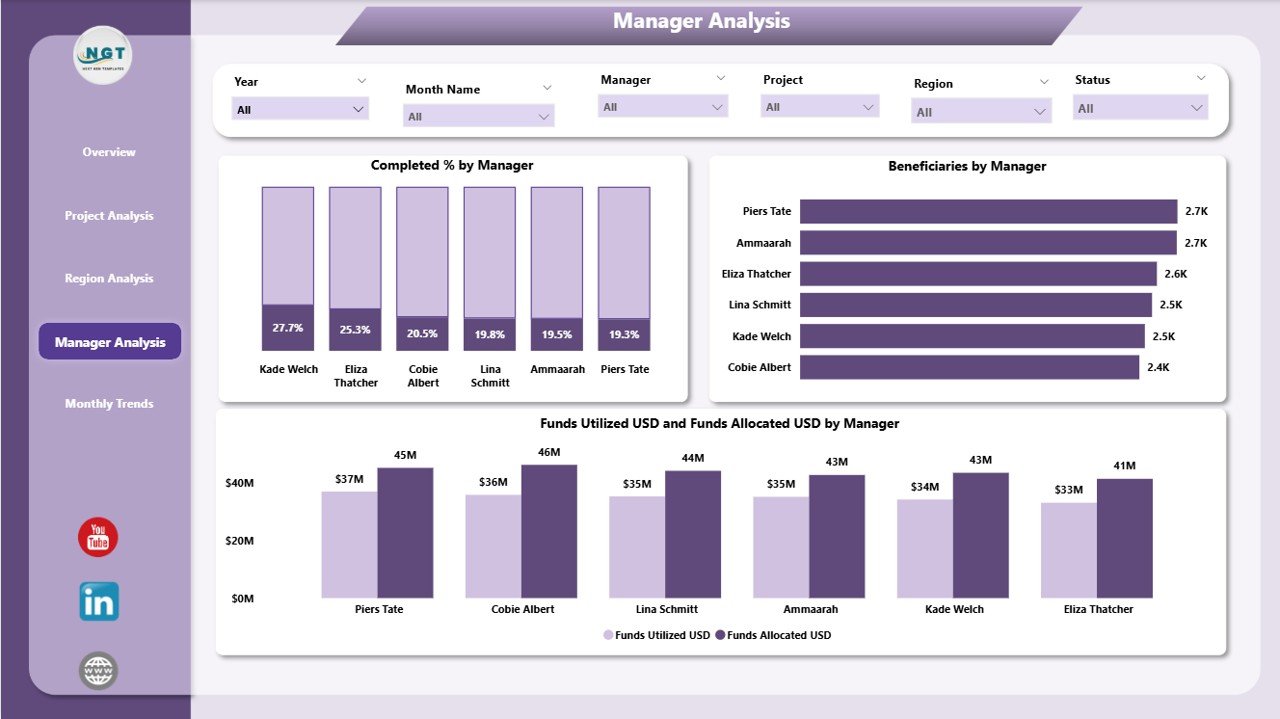
✅ 👩💼 Manager Analysis Page – Track managerial performance with charts displaying Completed %, Beneficiaries, and Funds Utilized by project manager. Perfect for performance reviews and accountability tracking.
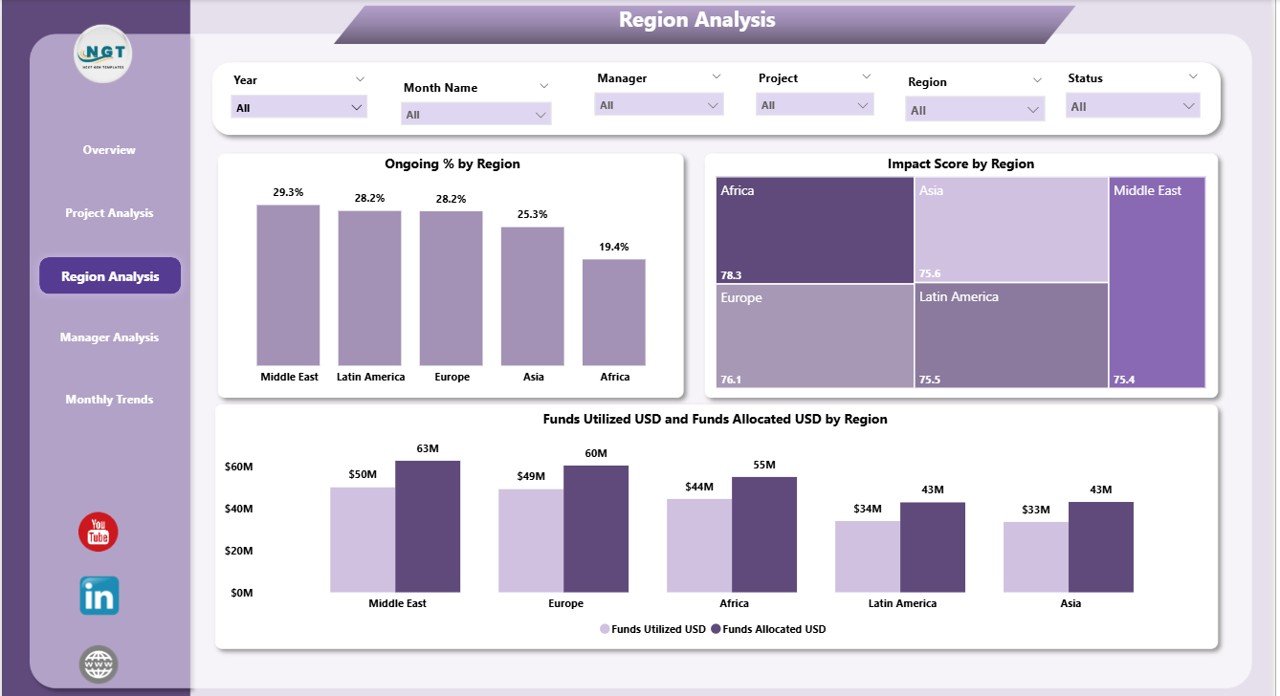
✅ 🌎 Region Analysis Page – Compare progress across countries and regions through Impact Scores, Ongoing %, and Fund Utilization charts. Easily pinpoint high-performing or under-funded areas.
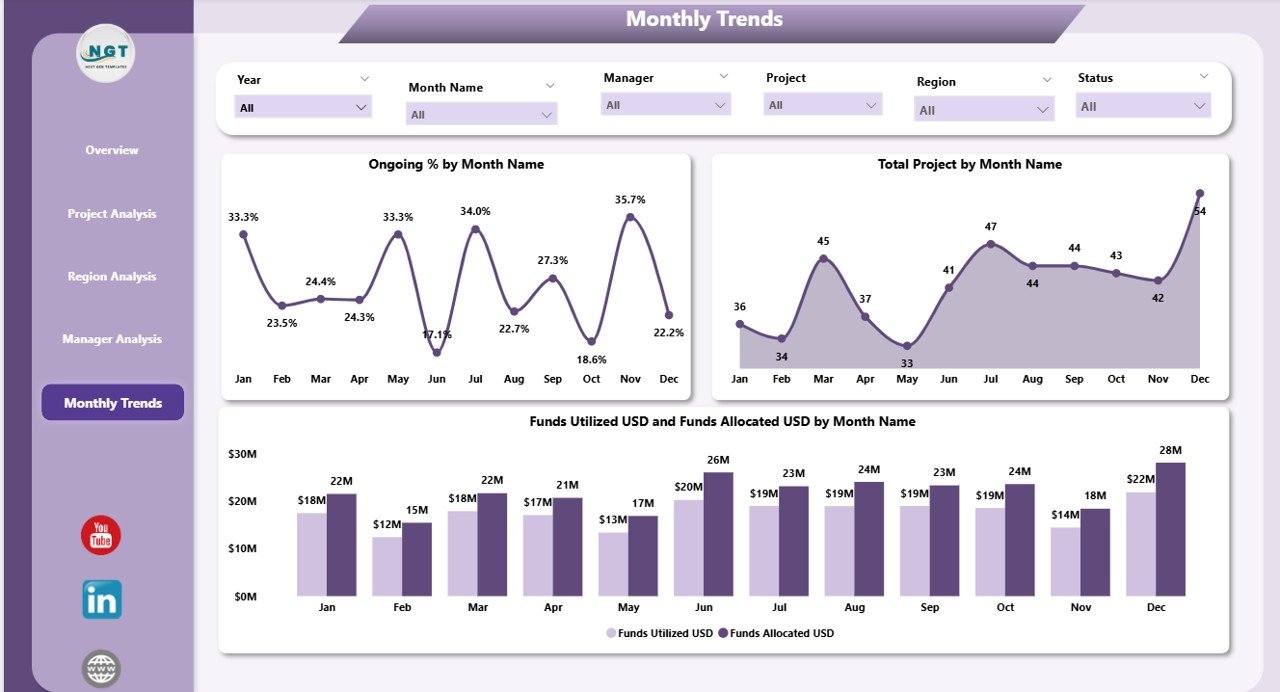
✅ 📆 Monthly Trends Page – Visualize performance evolution with time-based insights like Total Projects, Ongoing %, and Funding Trends by Month to forecast future growth and resource allocation.
✅ 🔄 Real-Time Updates – Built with automated refreshes, ensuring you always view the latest data without manual intervention.
✅ 🧩 Seamless Data Integration – Connects with Excel, SQL, SharePoint, or Google Sheets, consolidating data into one cohesive model.
✅ 🔒 Secure and Scalable – Supports role-based access and cloud sharing through Power BI Service, maintaining data confidentiality while enabling collaboration.
📦 What’s Inside the International Development Dashboard
📁 5 Professional Dashboard Pages:
-
Overview Page – Snapshot of all KPIs and global metrics.
-
Project Analysis Page – Deep dive into project outcomes.
-
Manager Analysis Page – Compare performance across managers.
-
Region Analysis Page – Country and regional performance breakdown.
-
Monthly Trends Page – Month-by-month project and funding visualization.
💡 Pre-Modeled Data Structure:
-
Ready-made data model linking Projects, Regions, Managers, and Funding tables.
-
Pre-defined DAX measures and KPIs for accuracy and speed.
📊 Custom Visuals & Filters:
-
Regional slicers, time-based filters, and dynamic comparisons.
🧠 User Guide Section:
-
Built-in notes and best practices for setup, refresh, and customization.
⚙️ How to Use the International Development Dashboard
1️⃣ Connect your Excel or SQL database containing project, region, and funding details.
2️⃣ Load data into Power BI using Power Query and enable auto refresh.
3️⃣ Review the Overview Page for a global snapshot.
4️⃣ Use Project, Manager, or Region pages to explore deeper insights.
5️⃣ Analyze Monthly Trends to identify seasonal or funding performance patterns.
6️⃣ Share the live dashboard securely via Power BI Service for real-time collaboration.
💡 Tip: Schedule daily or weekly data refreshes to keep dashboards live and reliable.
🌐 Who Can Benefit from This Dashboard
🤝 International NGOs – Track project progress and donor contributions effortlessly.
🏛️ Government Agencies – Monitor education, health, and infrastructure KPIs across regions.
💰 Donor & Funding Organizations – Ensure accountability and fund transparency.
🏥 Healthcare & Education Programs – Measure outreach, completion, and beneficiary impact.
⚙️ Project Managers – Gain 360° visibility into performance, timelines, and budgets.
📈 Data Analysts – Simplify reporting and automate visualization pipelines.
🌳 Sustainability & SDG Teams – Align and report outcomes with UN Sustainable Development Goals.
With this Power BI dashboard, every stakeholder — from donors to directors — can make faster, smarter, and more transparent decisions.
🔗 Click here to read the Detailed blog post
🎥 Visit our YouTube channel to learn step-by-step video tutorials


Reviews
There are no reviews yet.