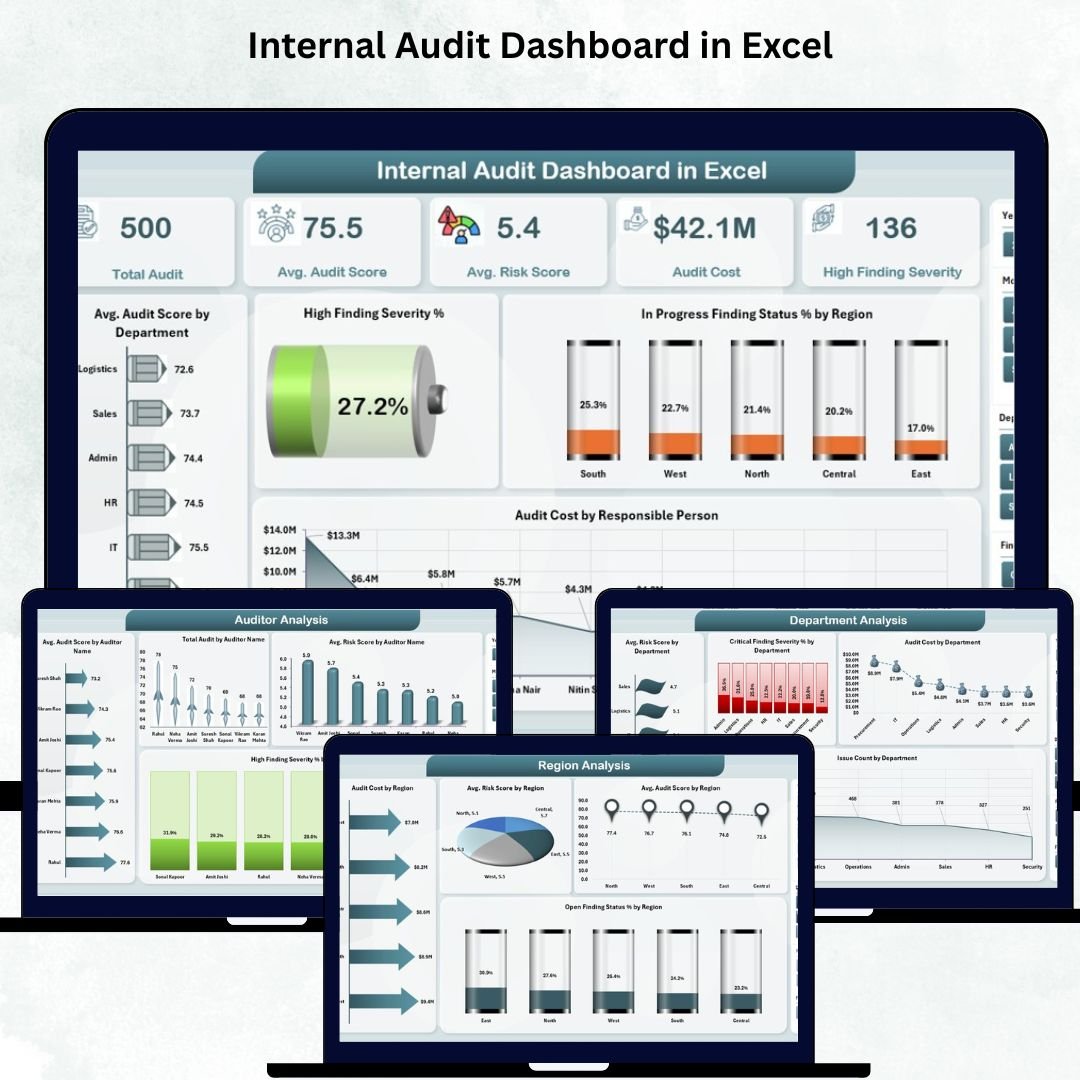
Internal Audit Dashboard are essential for strengthening internal controls, improving processes, and reducing organizational risk. But when audit information sits inside scattered spreadsheets, emails, and manual reports, leaders struggle to understand what’s happening. Tracking audit progress, analyzing severity levels, identifying high-risk areas, and reviewing audit costs becomes slow and confusing. To solve these challenges, we created the Internal Audit Dashboard in Excel — a powerful, visual, and interactive audit performance tracking tool designed for audit teams, compliance managers, and leadership.
This ready-to-use Excel template brings all audit metrics into one simple and organized dashboard. You can monitor audit scores, risk ratings, open findings, audit costs, severity distribution, and departmental trends instantly. Since the dashboard runs on Excel using slicers, pivot tables, charts, and conditional formatting, anyone can use it without technical or BI tool experience. Just update the data sheet and the entire dashboard refreshes automatically.
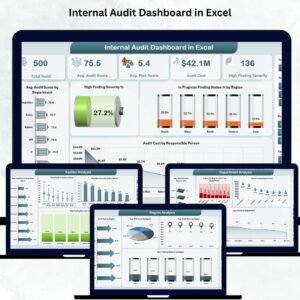
✨ Key Features of Internal Audit Dashboard in Excel
🧭 Left-Side Page Navigator
Move across all analysis pages—Overview, Department Analysis, Auditor Analysis, Region Analysis, and Month Analysis—with a single click. This navigation panel eliminates scrolling and makes the dashboard extremely user-friendly.
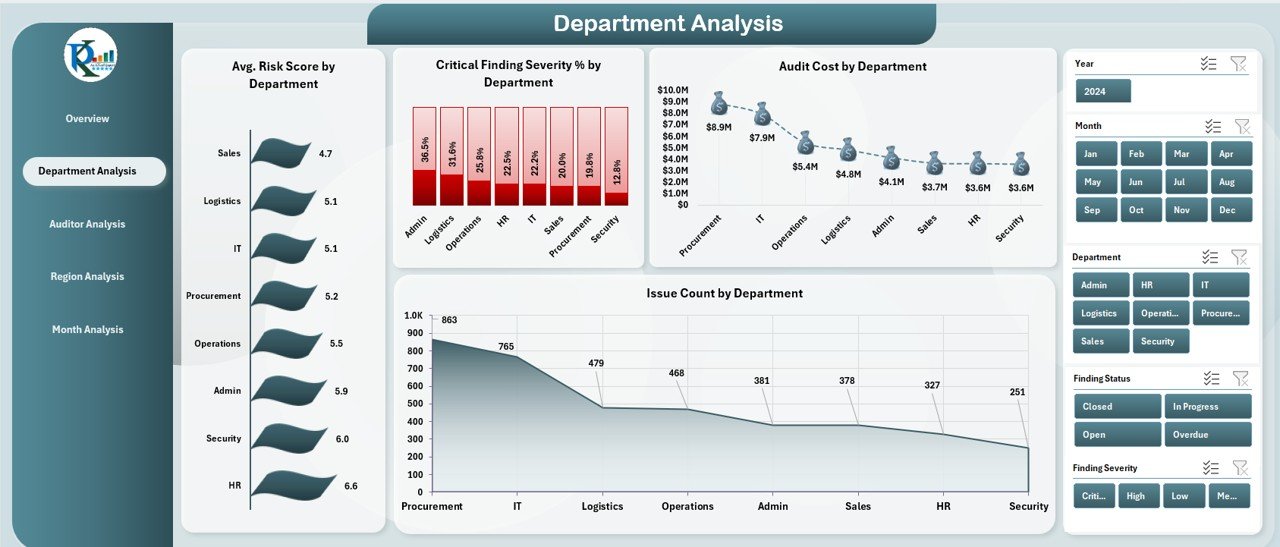
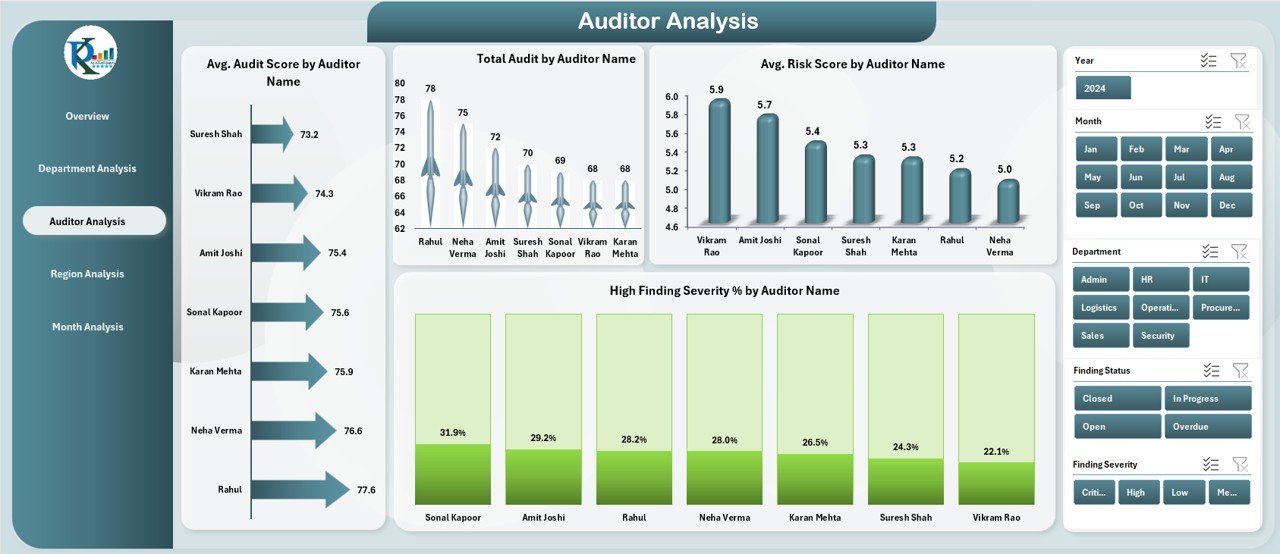
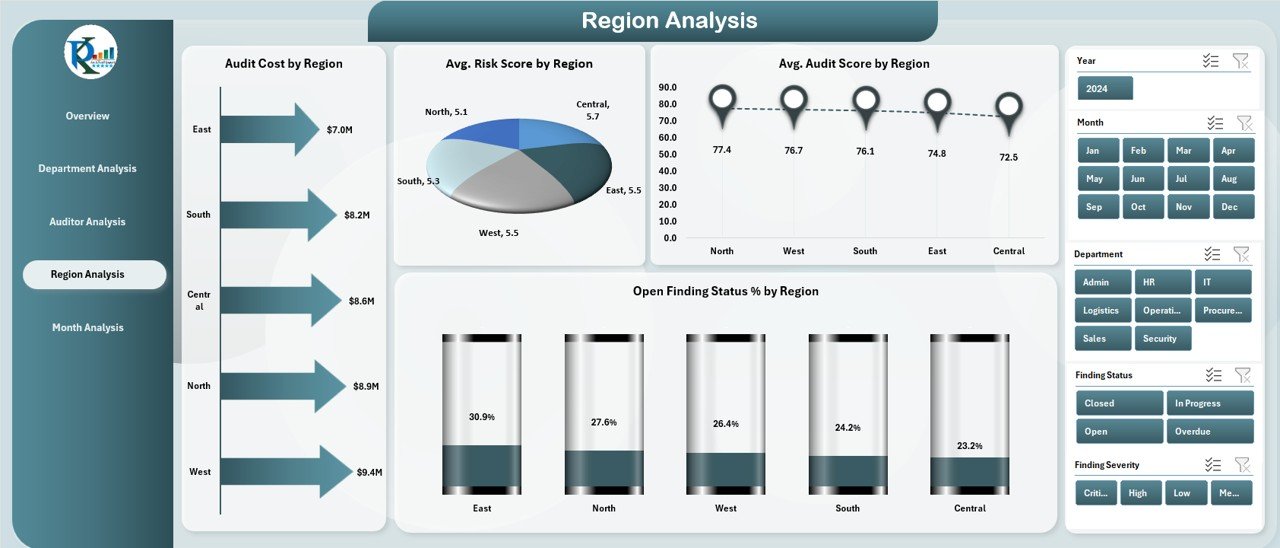
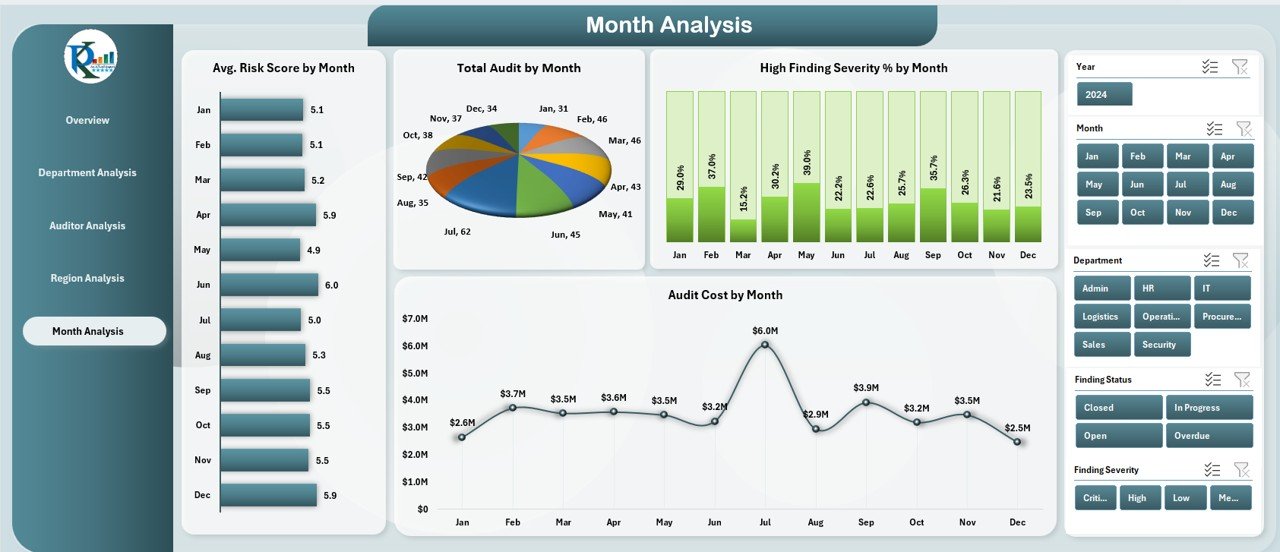
📊 5 Insightful Audit Analysis Pages
Each page delivers clear and actionable audit insights through charts, KPI cards, and slicers. Whether you want to analyze audit risk, severity, cost, or regional performance, the dashboard displays everything in a clean, well-structured layout.
⚡ Automatic Refresh & Real-Time Visibility
Once you update the Data Sheet, every chart, pivot table, pivot chart, KPI card, and severity indicator updates instantly—giving you real-time audit performance insights.
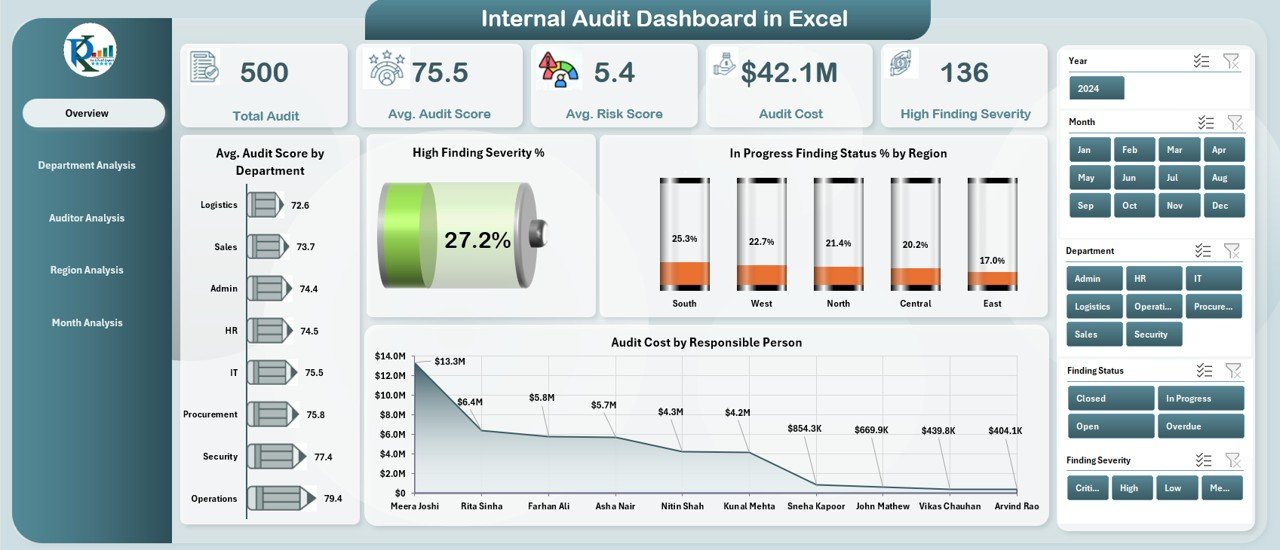
📈 Complete Audit KPI Visualization
See audit scores, risk ratings, severity %, open findings, audit costs, issue counts, auditor performance, and regional trends—all on one platform.
📦 What’s Inside the Internal Audit Dashboard in Excel
📁 1. Excel Dashboard File (.xlsx)
Includes all audit analysis pages, slicers, KPI cards, interactive visuals, and navigators—all professionally designed and ready to use.
📊 2. Data Sheet
Update fields such as:
-
Audit Score
-
Risk Score
-
Severity Rating
-
Department
-
Auditor
-
Region
-
Audit Cost
-
Open/Closed Findings
-
Month
All charts and KPIs update automatically after refresh.
🧩 3. Support Sheet
Contains dropdown lists, lookup values, severity mapping, and essential formulas. You can add more KPIs or categories anytime.
🛠️ How to Use the Internal Audit Dashboard
1️⃣ Update the Data Sheet
Enter the latest audit scores, cost, severity levels, auditors, and departments.
2️⃣ Click Refresh All
The dashboard updates automatically across all pages.
3️⃣ Use Slicers for Instant Filtering
Filter results by department, region, month, severity, auditor, and more.
4️⃣ Review KPIs on Overview Page
Track total audits, average scores, risk levels, and open findings.
5️⃣ Analyze Department, Auditor & Region Pages
Find performance gaps, high-risk areas, expensive audits, and severity patterns.
6️⃣ Study Monthly Trends
Understand how audit scores, risk, costs, and findings change month-to-month.
🎯 Who Can Benefit from This Internal Audit Dashboard
🧑💼 Internal Auditors
Review audit outcomes and identify areas needing follow-up.
🏢 Compliance Teams
Track high-severity issues and ensure policies are followed.
👨💼 Risk Managers
Monitor risk levels, open findings, and severity distribution.
🏙️ Leadership Teams
Get instant visibility into risk exposure, department performance, and audit cost trends.
🧩 Department Heads
Understand department-specific audit scores, issue count, and severity levels.
### Click hare to read the Detailed blog post
Visit our YouTube channel to learn step-by-step video tutorials
👉 Youtube.com/@PKAnExcelExpert


Reviews
There are no reviews yet.