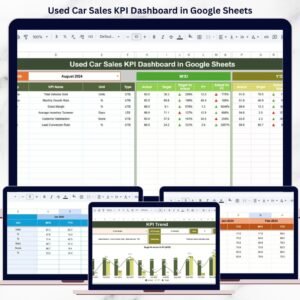
The Insurance KPI Dashboard in Google Sheets is a comprehensive tool designed to help insurance professionals track and analyze key performance indicators (KPIs) that are crucial for the success of their insurance business. Whether you’re managing policies, claims, or sales, this customizable dashboard provides a structured way to monitor your operations, make informed decisions, and drive performance improvements.
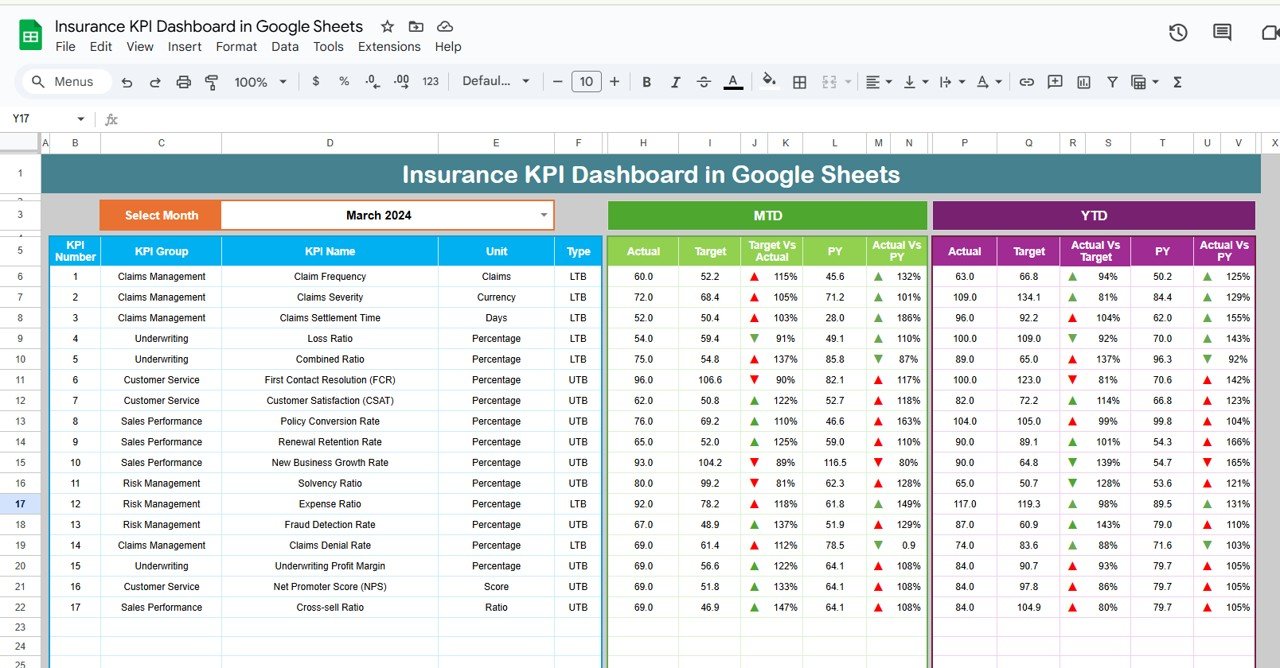
Key Features of the Insurance KPI Dashboard in Google Sheets
📊 Policy Tracking
-
Monitor Active Policies: Track the number of active policies, new policies issued, and cancellations to measure growth and retention.
-
Performance Metrics: Analyze key metrics such as policy lapse rates, renewal rates, and policyholder demographics.
📈 Claims Analysis
-
Track Claims: Monitor claim frequency, amounts, and claim settlement times to evaluate the effectiveness of claims processing.
-
Claims Processing Efficiency: Measure how quickly claims are processed and identify any bottlenecks in the system.
💼 Sales Performance
-
Sales Metrics: Track new business acquisition, sales conversion ratios, and overall performance of your sales team.
-
Target Achievement: Set monthly, quarterly, and annual sales goals and monitor progress.
📉 Customer Retention
-
Measure Retention Rates: Track customer retention and churn rates to assess customer loyalty and identify areas for improvement.
-
Loyalty Insights: Understand factors that influence customer retention and devise strategies to enhance loyalty.
💰 Financial Metrics
-
Evaluate Profitability: Monitor key financial indicators such as loss ratios, expense ratios, and profit margins to ensure your business is financially healthy.
-
Cost Management: Track the cost of claims, underwriting, and operational expenses to manage profitability effectively.
🔧 Customizable Template
-
Flexible and Adaptable: Modify the dashboard to suit your business needs by adding or adjusting KPIs relevant to your goals.
-
User-Friendly Design: The template is simple to use and doesn’t require advanced spreadsheet skills.
Benefits of Using the Insurance KPI Dashboard
✅ Improved Decision-Making
Get real-time insights into your insurance business, enabling better decision-making based on data rather than intuition.
✅ Operational Efficiency
Identify inefficiencies in policy issuance, claims processing, and customer service to streamline operations and reduce costs.
✅ Increased Profitability
Track and manage financial KPIs to ensure that your insurance business remains profitable and sustainable.
✅ Regulatory Compliance
Keep track of relevant KPIs and ensure that your business complies with industry regulations and standards.
How to Use the Insurance KPI Dashboard in Google Sheets
-
Download the Template: Download the Insurance KPI Dashboard template and save it to your Google Drive.
-
Input Your Data: Enter relevant insurance data, including policies, claims, and sales information into the respective sections of the dashboard.
-
Customize the Dashboard: Modify existing KPIs or add new ones to match your business objectives.
-
Analyze Trends: Use the visual charts and graphs to analyze trends, identify opportunities, and track performance over time.
-
Create Reports: Generate insightful reports to share with stakeholders, providing an overview of key business metrics.
By using the Insurance KPI Dashboard in Google Sheets, you can optimize your operations, track key metrics, and make data-driven decisions that propel your insurance business forward.
Click here to read the Detailed blog post
Insurance KPI Dashboard in Google Sheets
Visit our YouTube channel to learn step-by-step video tutorials
YouTube.com/@NeotechNavigators











Reviews
There are no reviews yet.