The insurance industry relies heavily on data. Every day, companies manage thousands of policies, premium payments, claim requests, and agent activities. Without proper analytics tools, it becomes extremely difficult to monitor portfolio performance, analyze claim patterns, and evaluate sales productivity.
This is where the Insurance Analytics Dashboard in HTML becomes a powerful solution.
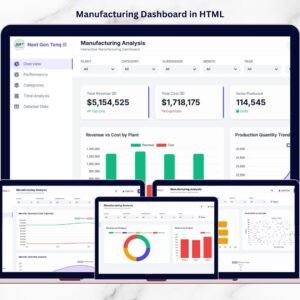
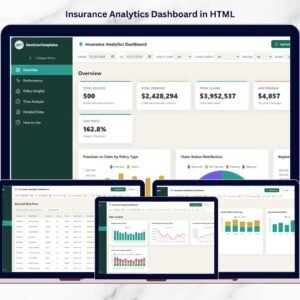
The Insurance Analytics Dashboard by NextGenTemplates is a premium, single-file analytics solution that converts raw insurance data into powerful visual insights. Built using Chart.js and SheetJS, this dashboard runs entirely inside your web browser without requiring any server, database, or installation.
Because everything works directly in your browser, your data remains 100% private and secure. Simply open the HTML file, upload your Excel data, and start exploring powerful analytics instantly.
With 20+ interactive charts, global filters, six analytical pages, and a built-in Excel upload system, this dashboard allows insurance professionals to analyze policies, premiums, claims, regions, and agent performance in seconds.
Whether you are an insurance manager, claims analyst, sales leader, or business consultant, this dashboard provides the insights you need to make faster and smarter decisions.
🚀 Key Feature of Insurance Analytics Dashboard in HTML
The dashboard includes a wide range of powerful features designed for insurance analytics.
📊 Single-File HTML Dashboard – A fully standalone analytics solution that runs directly in your browser.
📈 20+ Interactive Charts – Visualize insurance data using dynamic charts built with Chart.js.
📁 Excel File Upload Support – Upload your own .xlsx insurance dataset using drag-and-drop functionality.
🎛 Global Filter System – Filter all charts simultaneously by Date Range, Policy Type, Claim Status, Region, and Sales Agent.
🌙 Dark / Light Theme Toggle – Instantly switch between light and dark modes for better viewing comfort.
📊 Real-Time Chart Updates – All charts automatically update when filters change.
📤 CSV Data Export – Export filtered insurance data instantly.
📂 Multi-Sheet Excel Support – Upload workbooks with multiple sheets and select the dataset you want to analyze.
📱 Responsive Layout – Works perfectly on desktops, laptops, and tablets.
🔒 100% Client-Side Privacy – No server, no tracking, and no data sharing.
Because of these features, the dashboard provides enterprise-level analytics without expensive BI software.
📦 What’s Inside the Insurance Analytics Dashboard
This premium dashboard includes six fully designed analytics pages that help insurance professionals explore data from multiple perspectives.
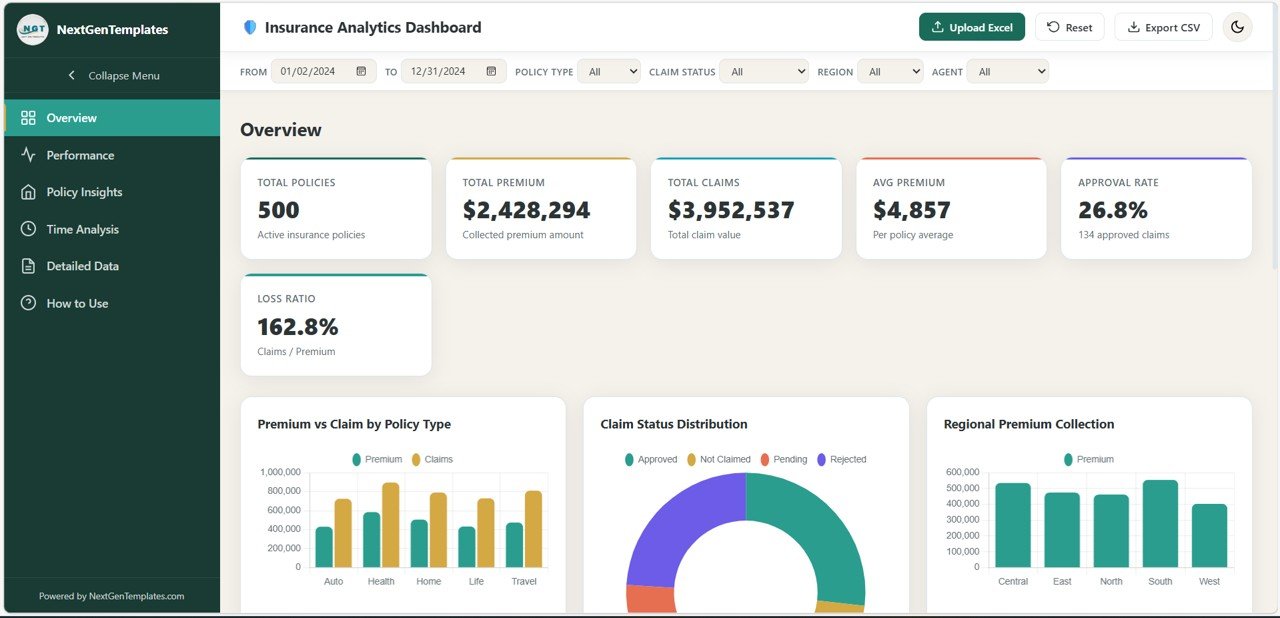
Overview Page
Provides a quick snapshot of your entire insurance portfolio.
KPI cards include:
Total Policies
Total Premium
Total Claims
Average Premium
Claim Approval Rate
Loss Ratio
Charts included:
Premium vs Claim by Policy Type
Claim Status Distribution
Regional Premium Collection
Monthly Premium Trend
Top 10 Sales Agents by Premium
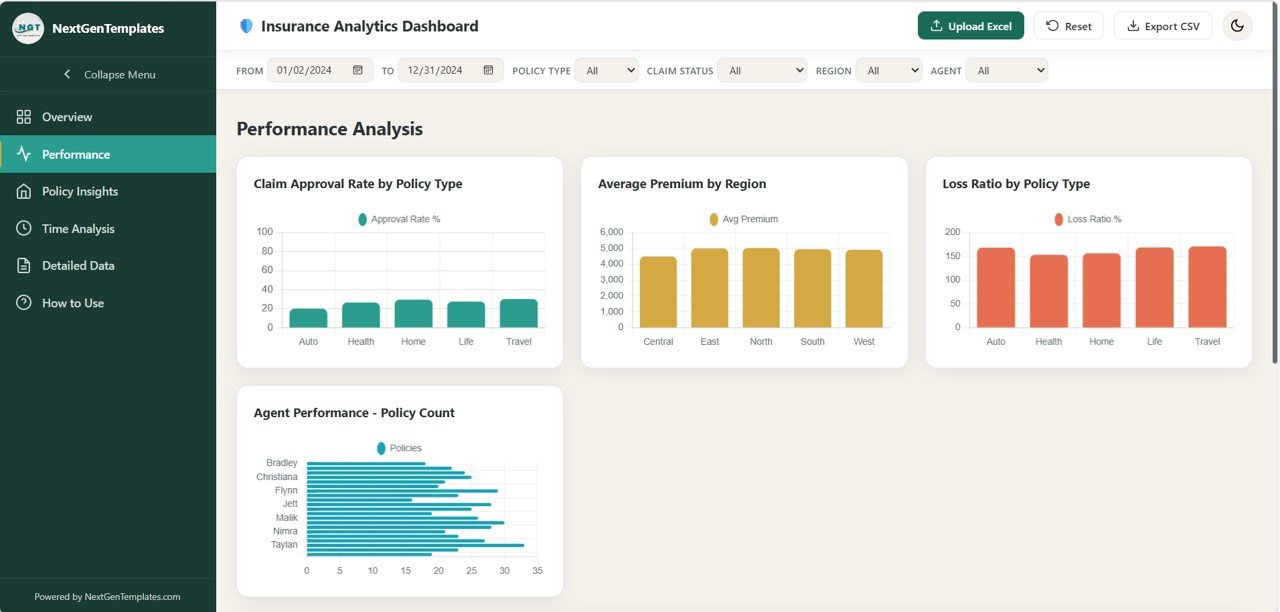
Performance Analysis Page
Analyzes operational performance across agents, regions, and policy categories.
Charts include:
Claim Approval Rate by Policy Type
Average Premium by Region
Loss Ratio by Policy Type
Agent Performance by Policy Count
Premium vs Claim Scatter (Age)
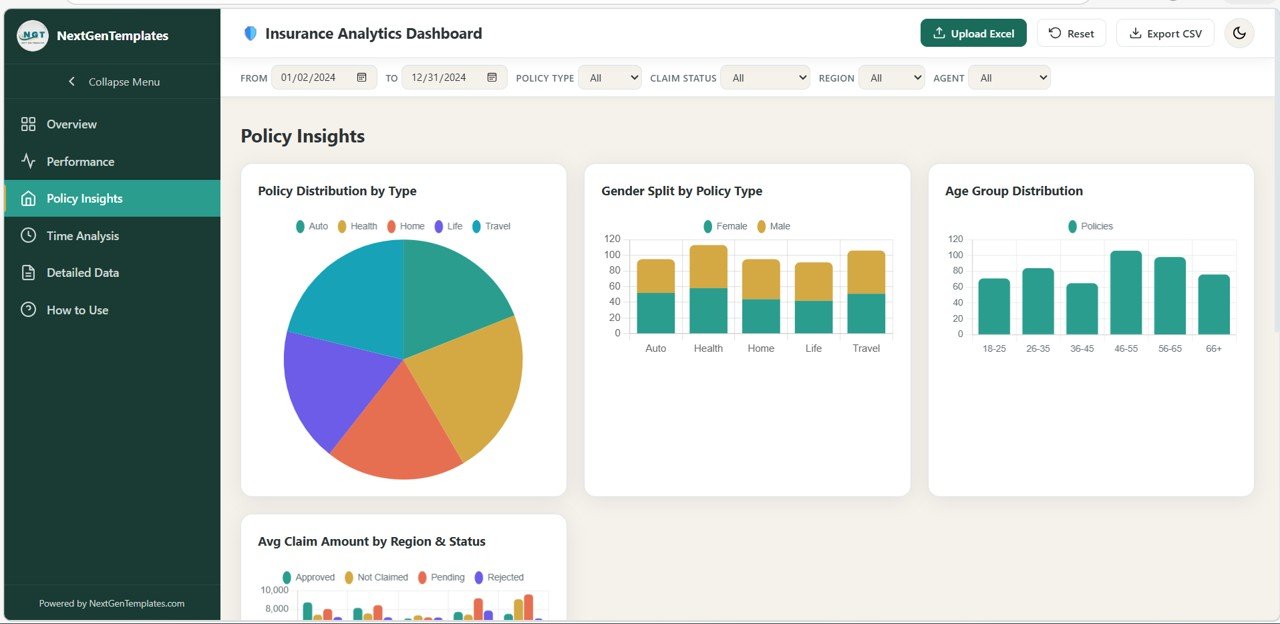
Policy Insights Page
Explores customer demographics and portfolio structure.
Charts include:
Policy Distribution by Type
Gender Split by Policy Type
Age Group Distribution
Average Claim Amount by Region & Status
Policy Type Premium Heatmap by Region
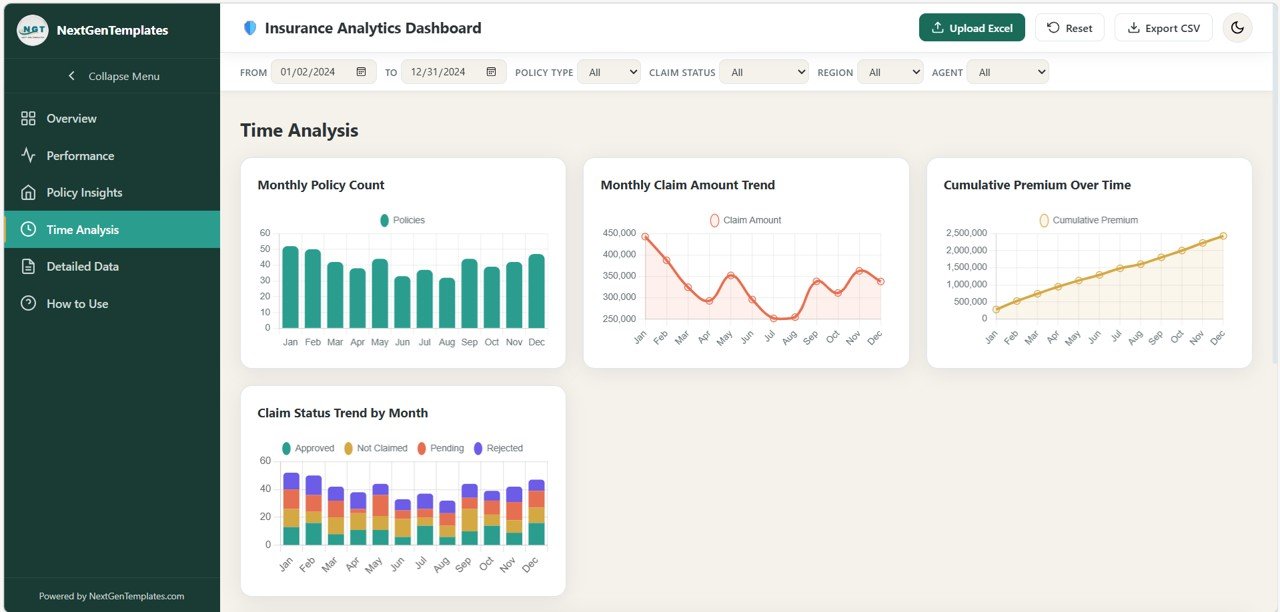
Time Analysis Page
Analyzes insurance performance trends over time.
Charts include:
Monthly Policy Count
Monthly Claim Amount Trend
Cumulative Premium Over Time
Claim Status Trend by Month
Year-over-Year Performance Comparison
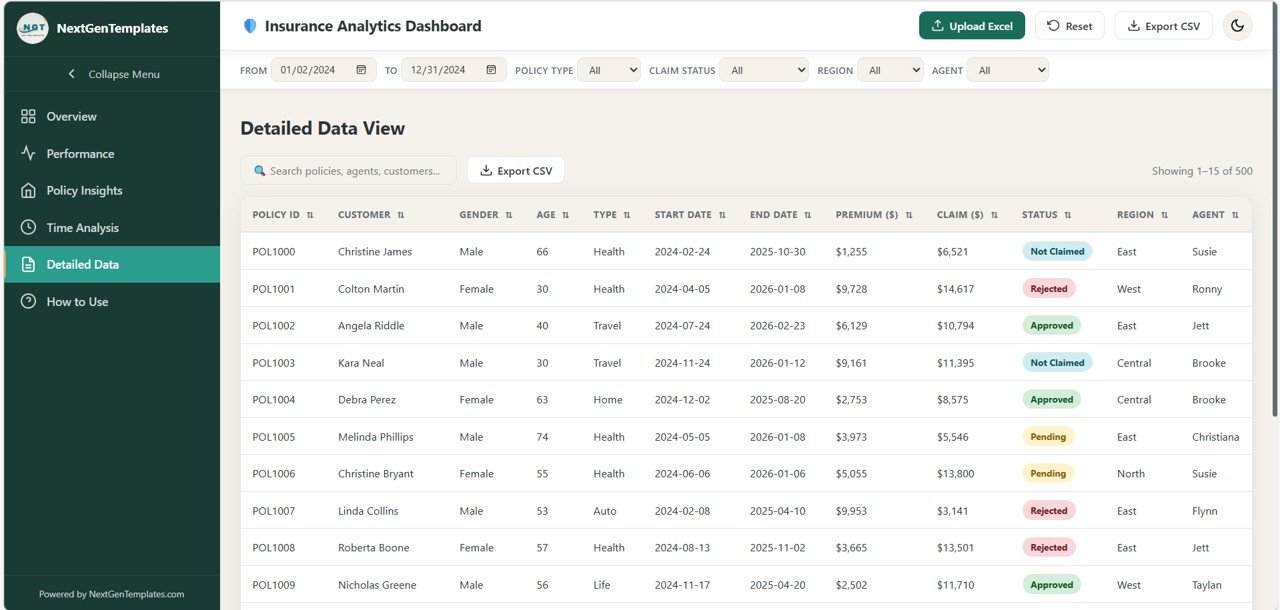
Detailed Data Page
Allows users to explore raw insurance records directly.
Features include:
Searchable data table
Sortable columns
Claim status badges
Pagination system
CSV export functionality
How to Use Page
Built-in user guide explaining:
Excel upload instructions
Required data columns
Dashboard navigation
Filter usage
Privacy and theme settings
⚙️ How to Use the Insurance Analytics Dashboard
Using this dashboard is extremely simple.
1️⃣ Open the HTML file in any modern browser.
2️⃣ Upload your Excel insurance dataset using the upload tool.
3️⃣ Select the sheet you want to analyze.
4️⃣ Apply filters such as region, policy type, claim status, or agent.
5️⃣ Explore charts and KPIs to understand insurance performance.
Because everything runs locally in the browser, the dashboard works even without an internet connection.
👥 Who Can Benefit from This Dashboard
The Insurance Analytics Dashboard is designed for professionals working in the insurance and financial services industry.
It is especially useful for:
🏢 Insurance Company Managers
📊 Claims Analysts
💼 Sales Team Leaders
📈 Insurance Consultants
💰 Financial Analysts
🏦 Small Insurance Agencies
Because the dashboard provides real-time visual analytics, it helps teams monitor insurance operations efficiently.
💡 Why Choose a Single-File HTML Dashboard
One of the biggest advantages of this product is its single-file HTML architecture.
✔ No installation required
✔ Works offline
✔ No database required
✔ Easy to share with teams
✔ Completely customizable
✔ Compatible with all modern browsers
This makes it perfect for organizations that want powerful analytics without complicated infrastructure.
### Click here to read the Detailed blog post
Watch the step-by-step video tutorial:
Visit our YouTube channel to learn step-by-step video tutorials
Youtube.com/@NextGenTemplates