In the era of digital disruption, every business strives to innovate faster and transform smarter. The Innovation & Transformation Dashboard in Power BI is a ready-to-use, data-driven analytics solution that gives leaders, managers, and transformation teams complete visibility into their innovation performance and project impact — all in one dynamic Power BI file. 📊💡
Built on Microsoft Power BI, this dashboard connects to your existing data sources and transforms complex figures into beautiful, interactive visuals. It empowers decision-makers to track innovation KPIs, monitor budgets, measure impact, and evaluate transformation success — without needing coding or technical expertise.
Whether you’re managing product innovation, digital transformation, or process improvement programs, this dashboard brings all your insights together in real time, helping you accelerate progress and maximize ROI.
🌟 Key Features of the Innovation & Transformation Dashboard
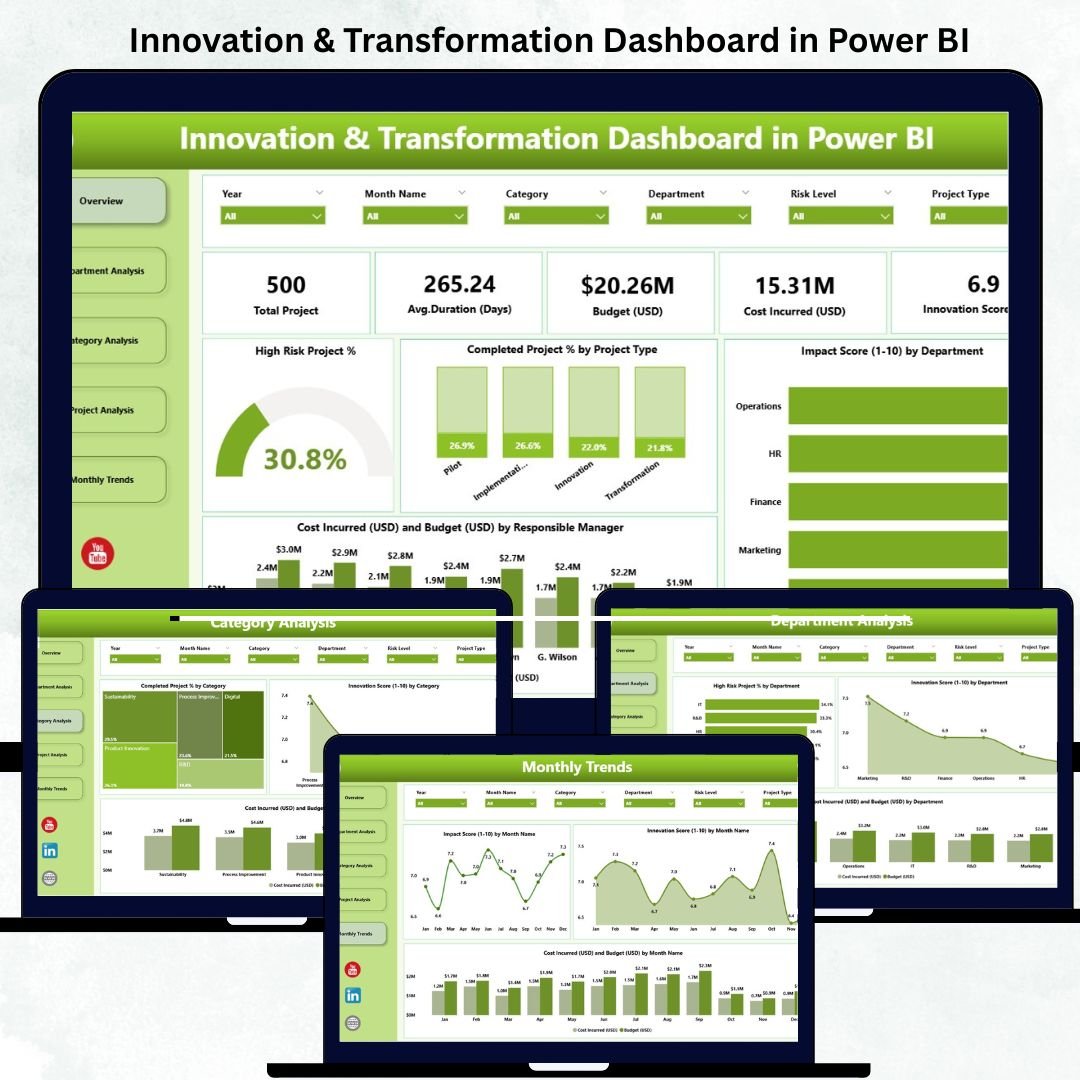
🏠 1️⃣ Overview Page – Your Command Center
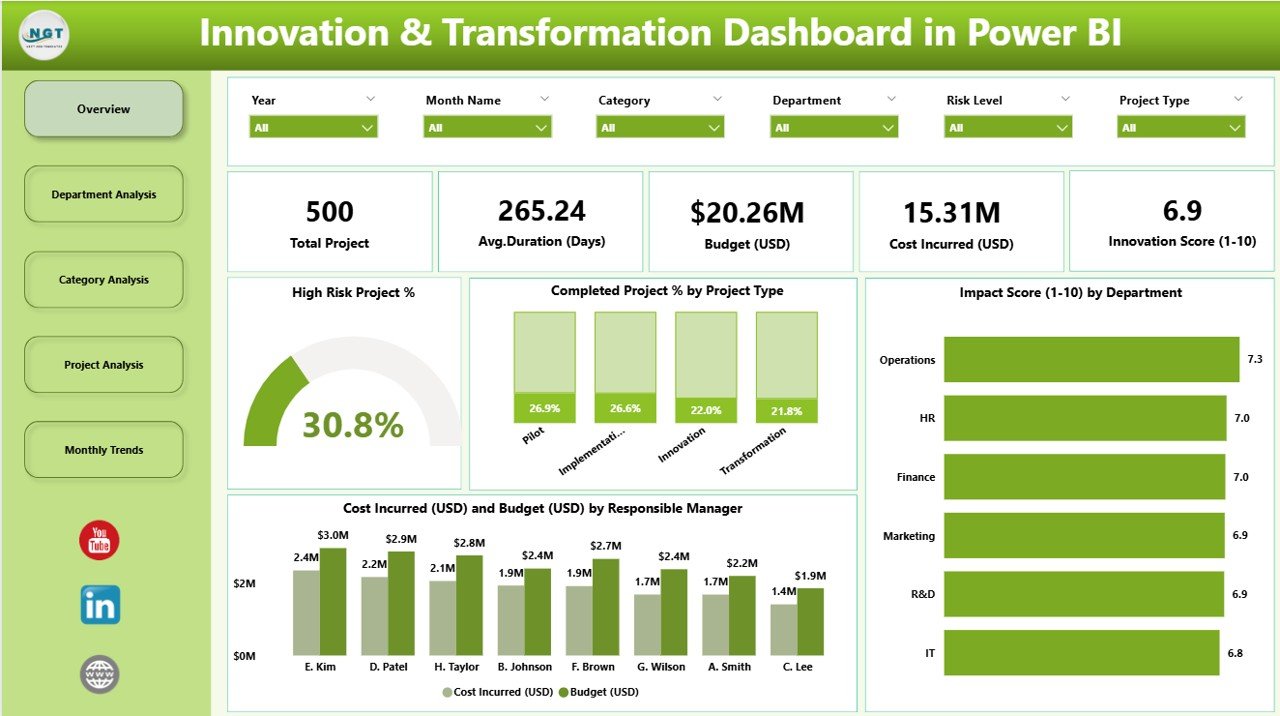
Gain an instant snapshot of your organization’s innovation and transformation landscape.
Includes:
-
🧮 Five KPI Cards — Total Projects, Completed Project %, High-Risk Project %, Budget (USD), and Cost Incurred (USD).
-
📊 Four Interactive Charts: High-Risk Project %, Completed Project % by Type, Impact Score by Department, Cost vs Budget by Manager.
💡 Purpose: Track progress toward innovation goals and identify high-risk areas at a glance.
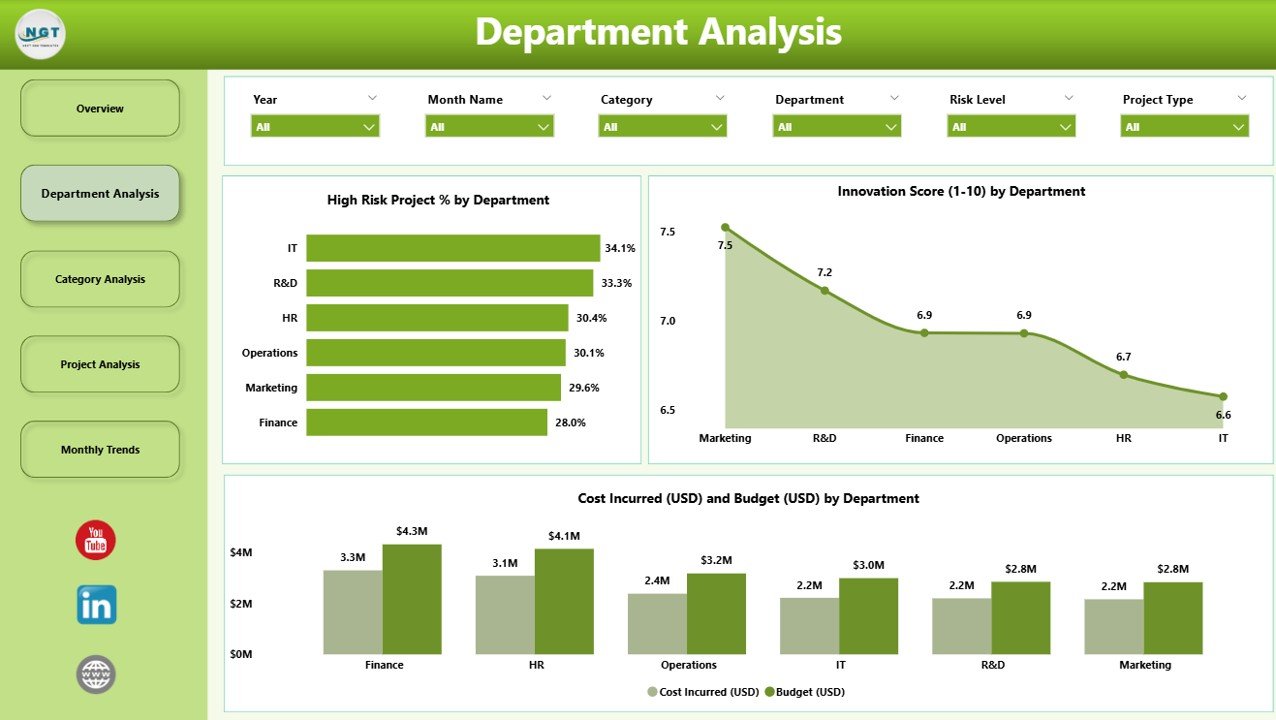
🧩 2️⃣ Department Analysis Page – Performance by Department
Visualize departmental contributions to innovation success.
Key Charts:
-
High-Risk Project % by Department
-
Budget vs Cost Incurred (USD) by Department
-
Innovation Score by Department
🎯 Benefit: Identify which departments excel and which need additional support or resources.
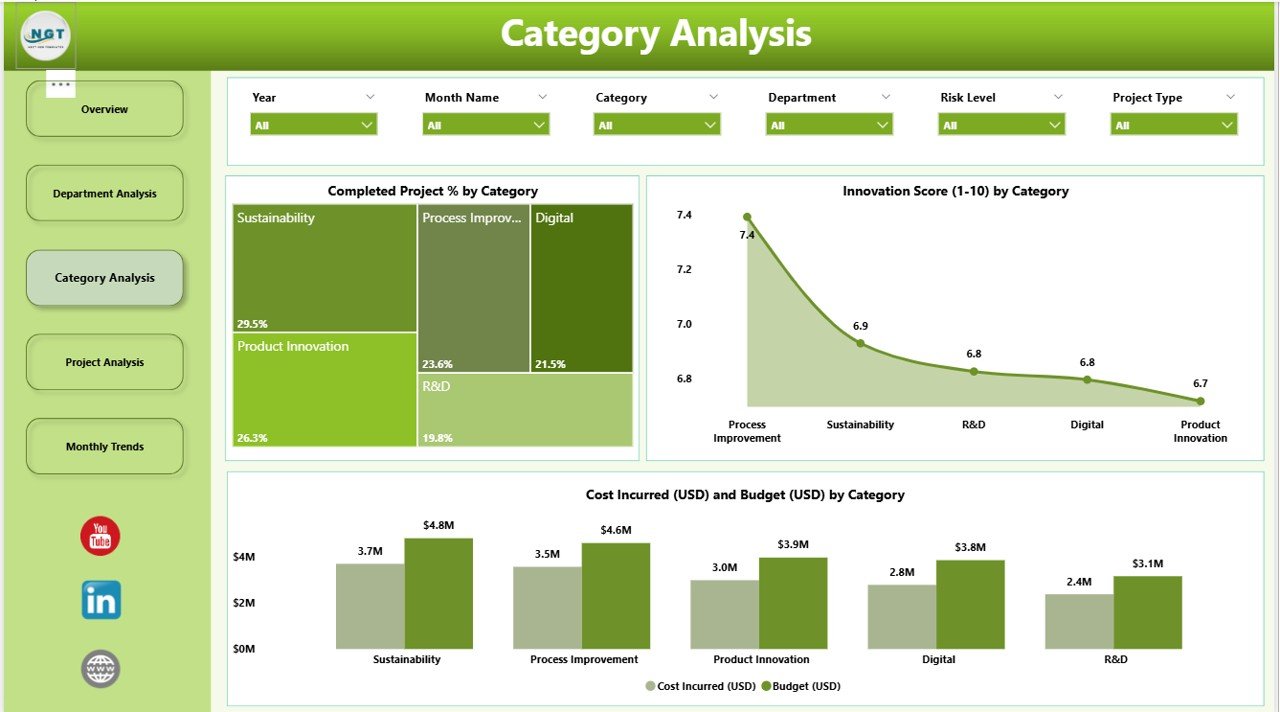
📂 3️⃣ Category Analysis Page – Innovation Type Insights
Understand how different innovation categories perform — from product launches to process improvements.
Visuals Include:
-
Completed Project % by Category
-
Innovation Score by Category
-
Budget vs Cost (USD) by Category
📈 Outcome: Prioritize high-impact innovation streams and optimize spending efficiency.
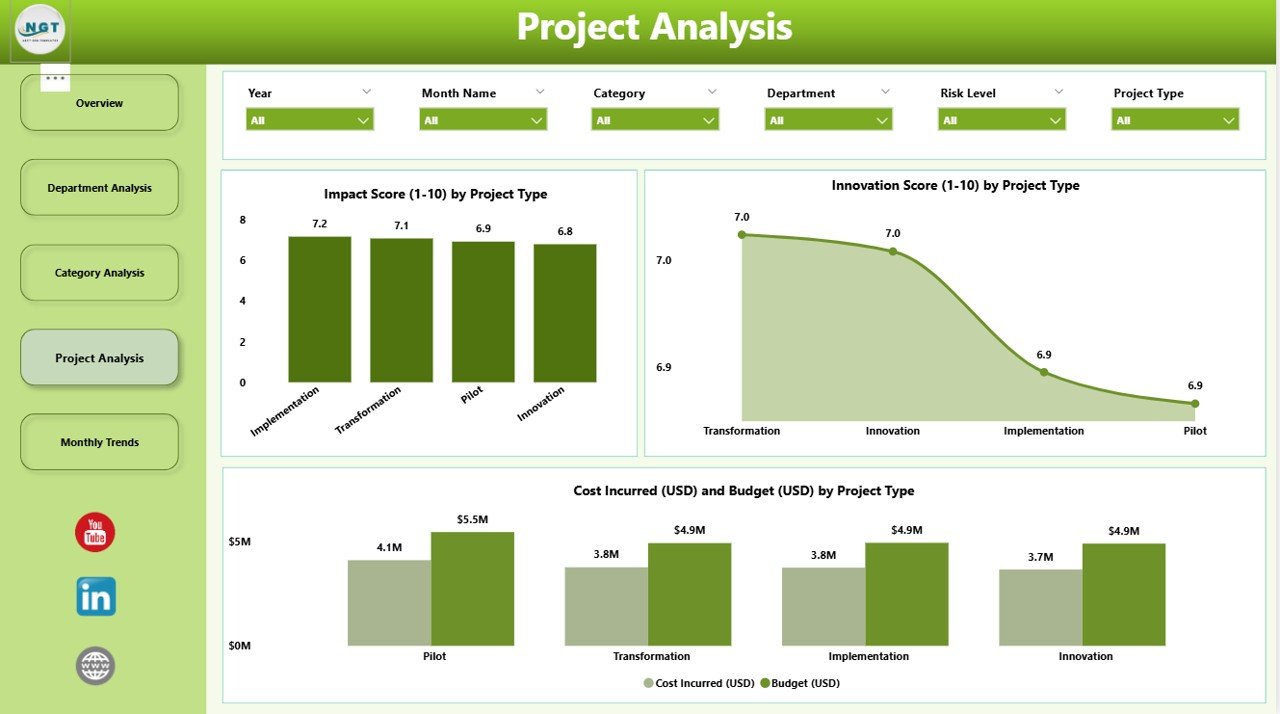
🧠 4️⃣ Project Analysis Page – Project-Level Impact Evaluation
Drill down into individual projects to see what’s driving transformation.
Visuals Show:
-
Impact Score by Project Type
-
Innovation Score by Project Type
-
Cost vs Budget (USD) by Project Type
💬 Purpose: Empower project managers to balance creativity, budget discipline, and impact.
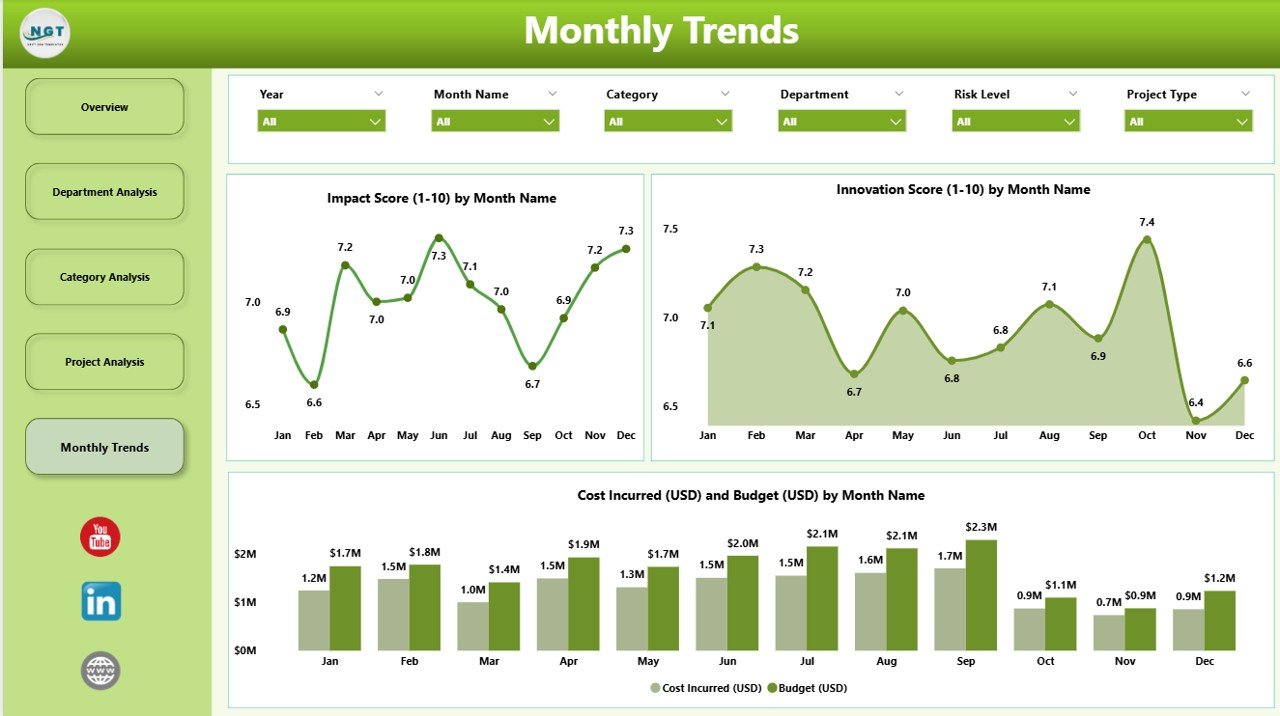
📅 5️⃣ Monthly Trends Page – Time-Based Performance Tracking
Measure progress month over month to spot patterns and predict future trends.
Charts Displayed:
-
Impact Score by Month
-
Innovation Score by Month
-
Budget vs Cost (USD) by Month
🧭 Benefit: Track growth momentum and budget efficiency over time.
💼 Advantages of the Innovation & Transformation Dashboard
✅ Real-Time Insights — Instantly see innovation progress and project performance.
✅ Centralized KPIs — All innovation and transformation metrics in one place.
✅ Improved Decision-Making — Make faster, data-driven strategic choices.
✅ Enhanced Accountability — Highlight underperforming areas and ownership gaps.
✅ Cross-Department Collaboration — Encourage alignment between teams.
✅ Budget Optimization — Compare actual vs planned spending to maintain financial control.
✅ Customizable & Scalable — Adapt KPIs and visuals as your organization evolves.
⚙️ How Power BI Drives Innovation Analytics
-
🔗 Seamless Integration: Connect Excel, SharePoint, or SQL data sources effortlessly.
-
🎨 Interactive Visuals: Drill through data by month, department, or project type.
-
🤖 Automation: Set scheduled refreshes for real-time updates.
-
👥 Collaboration: Securely share dashboards across teams and executives.
-
🧠 AI-Driven Insights: Detect anomalies and forecast performance trends instantly.
👥 Who Can Benefit from This Dashboard
-
💼 Business Leaders & Executives – Track organization-wide innovation ROI.
-
🧩 Transformation Offices – Monitor digital initiatives and alignment with strategy.
-
👨💼 Department Heads – Oversee departmental innovation scores and budget usage.
-
🧑🔬 Project Managers – Evaluate project impact and performance trends.
-
🌍 Consultants & Analysts – Visualize client innovation data with professional dashboards.
💡 Best Practices
1️⃣ Define clear KPIs and update them regularly.
2️⃣ Ensure data accuracy for reliable visuals.
3️⃣ Use slicers and filters to customize views.
4️⃣ Track monthly trends to forecast future performance.
5️⃣ Refresh data weekly or monthly for real-time accuracy.
🏁 Conclusion
The Innovation & Transformation Dashboard in Power BI is more than a reporting tool — it’s your organization’s strategic compass for tracking innovation, managing transformation projects, and measuring real business impact.
With five interactive pages, automated visuals, and a clean Power BI interface, this dashboard helps you analyze KPIs instantly, optimize costs, and accelerate your digital growth journey.
Take control of your innovation success today with this Power BI dashboard — available exclusively on NextGenTemplates.com.
### Click here to read the Detailed blog post
Visit our YouTube channel for step-by-step tutorials


Reviews
There are no reviews yet.