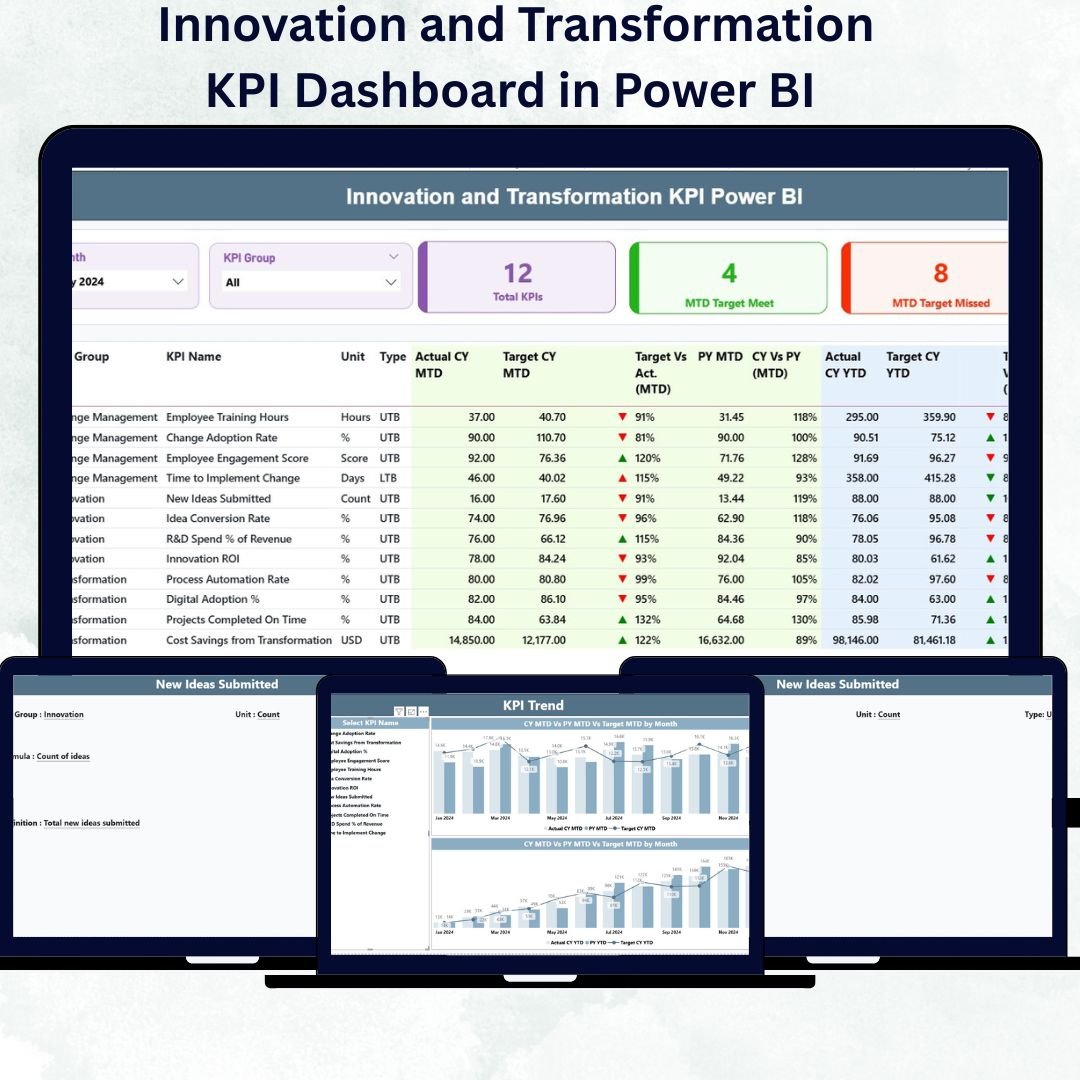
In a world where change is constant, innovation and transformation are the engines that drive growth and competitiveness. The Innovation and Transformation KPI Dashboard in Power BI helps organizations measure, visualize, and manage their innovation efforts and digital transformation progress with precision.
This ready-to-use Power BI dashboard consolidates key performance indicators (KPIs) such as idea generation, project implementation, automation levels, and ROI from transformation initiatives — all in one dynamic, interactive view. With real-time updates and professional visuals, this dashboard enables leaders to make faster, smarter, data-driven decisions.
⚙️ Key Features of Innovation and Transformation KPI Dashboard in Power BI
✅ Three Dynamic Pages: Summary, KPI Trend, and KPI Definition for complete visibility.
✅ Interactive Filters: Month and KPI Group slicers for focused analysis.
✅ Performance Cards: Instantly view Total KPIs, Target Met, and Target Missed counts.
✅ Real-Time Visualization: Automatically refreshes from Excel or cloud data sources.
✅ Drill-Through Capability: Access KPI definitions, formulas, and metadata directly from visuals.
✅ Trend Analysis: Combo charts display MTD, YTD, and Previous-Year performance side by side.
✅ KPI Documentation: Every KPI has defined formulas, units, and measurement types (UTB/LTB).
✅ Excel-Integrated Source: Simple to update — just refresh Power BI to sync new data.
✅ Fully Customizable: Add, remove, or edit KPIs and visuals as per your business needs.
✅ Collaboration Ready: Share live dashboards via Power BI Service for team alignment.
This dashboard empowers your organization to align innovation initiatives with strategic transformation goals — tracking performance from concept to execution.
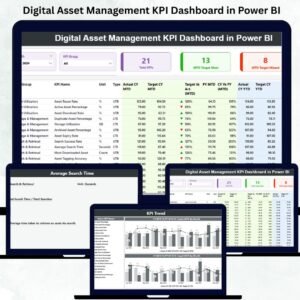
📊 What’s Inside the Innovation and Transformation KPI Dashboard
The Power BI file includes three interactive pages and connects seamlessly with an Excel backend consisting of three structured worksheets.
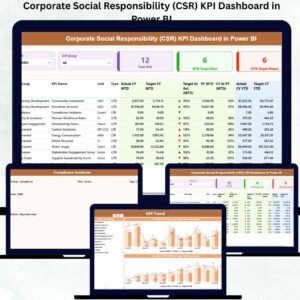
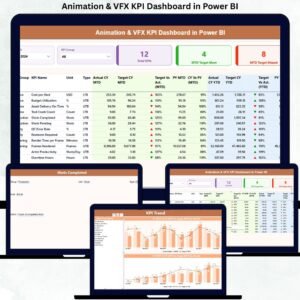
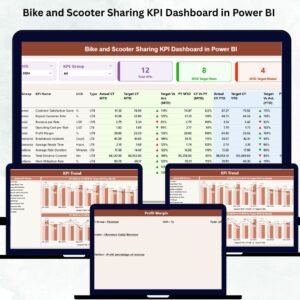
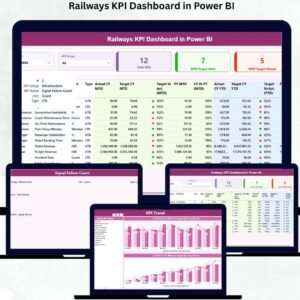
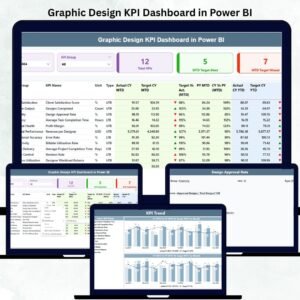
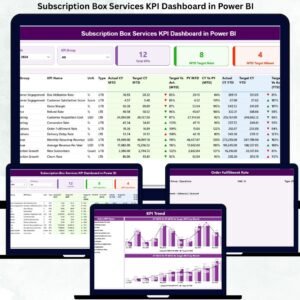
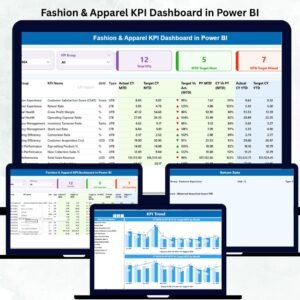
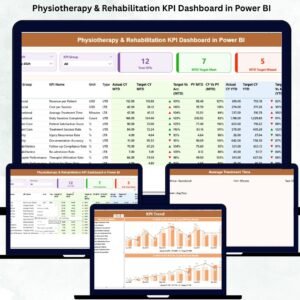
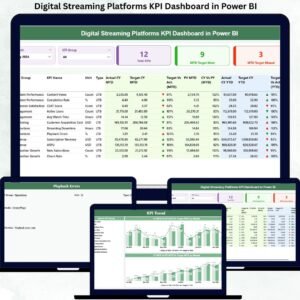
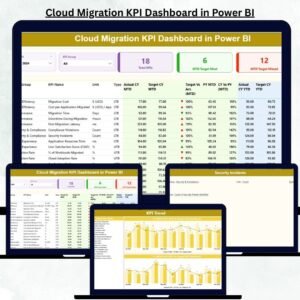
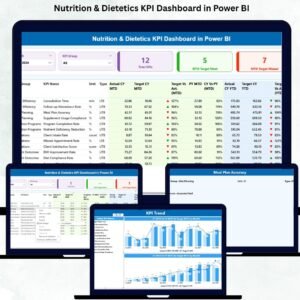
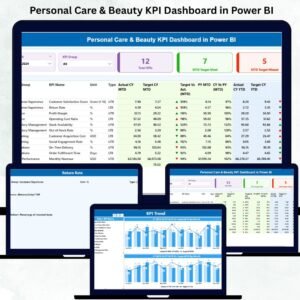
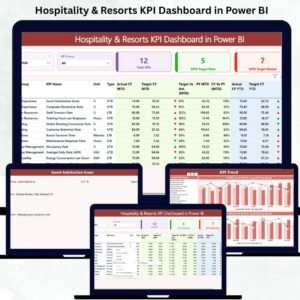
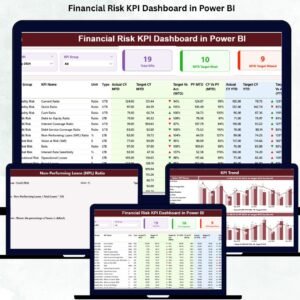
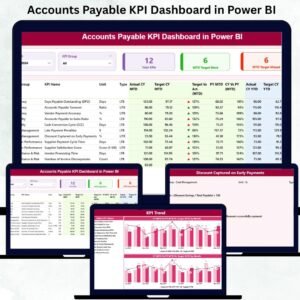
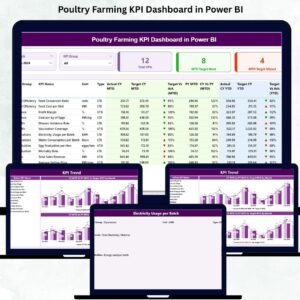
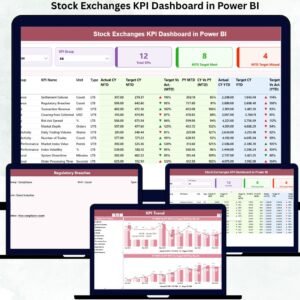
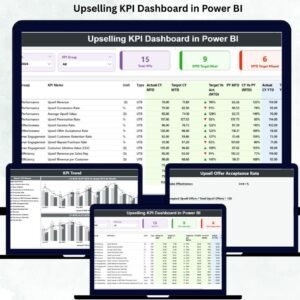
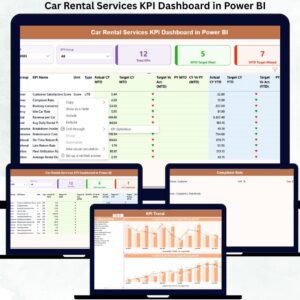
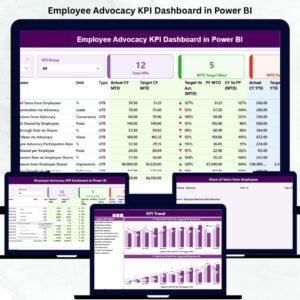
1️⃣ Summary Page – Performance Overview
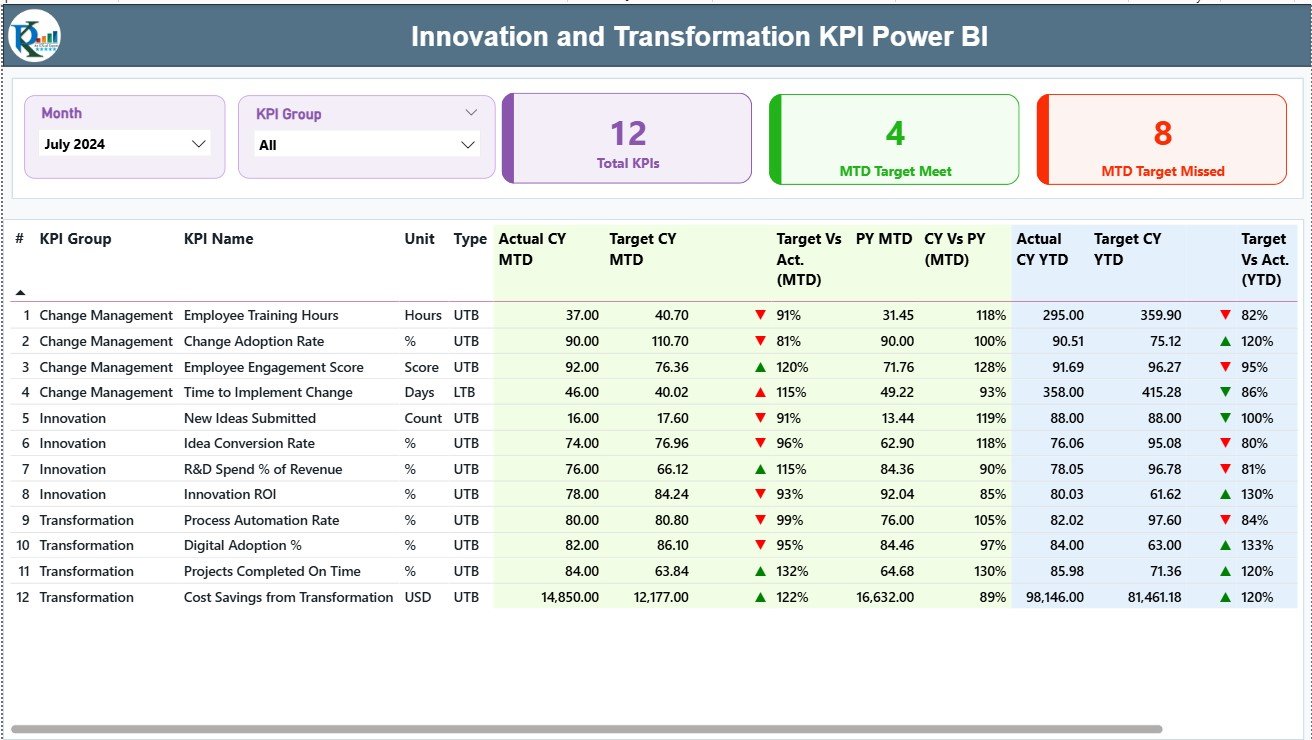
Your main control center, providing a holistic snapshot of innovation KPIs.
-
Month and KPI Group Slicers let you switch focus easily.
-
Performance Cards display KPI counts and results instantly.
-
Detailed KPI Table includes MTD, YTD, and PY comparisons, colored arrows, and % variances.
This page helps decision-makers quickly assess which KPIs are excelling and which need attention.
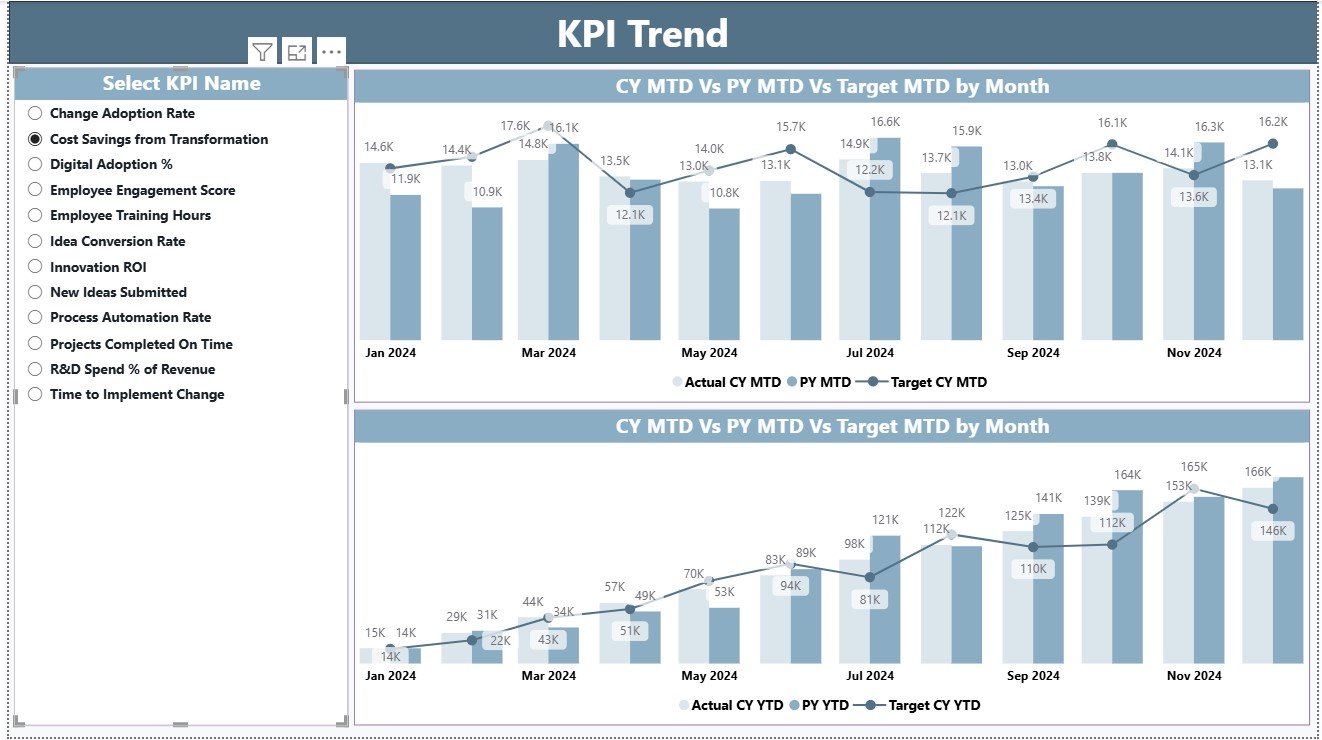
2️⃣ KPI Trend Page – Visualizing Progress Over Time
Analyze month-by-month performance trends for any KPI.
-
KPI Selector: Choose a KPI to view its historical pattern.
-
Dual Combo Charts: Compare MTD and YTD results vs. Target and PY.
This page is perfect for identifying performance gaps, improvement areas, and innovation momentum.
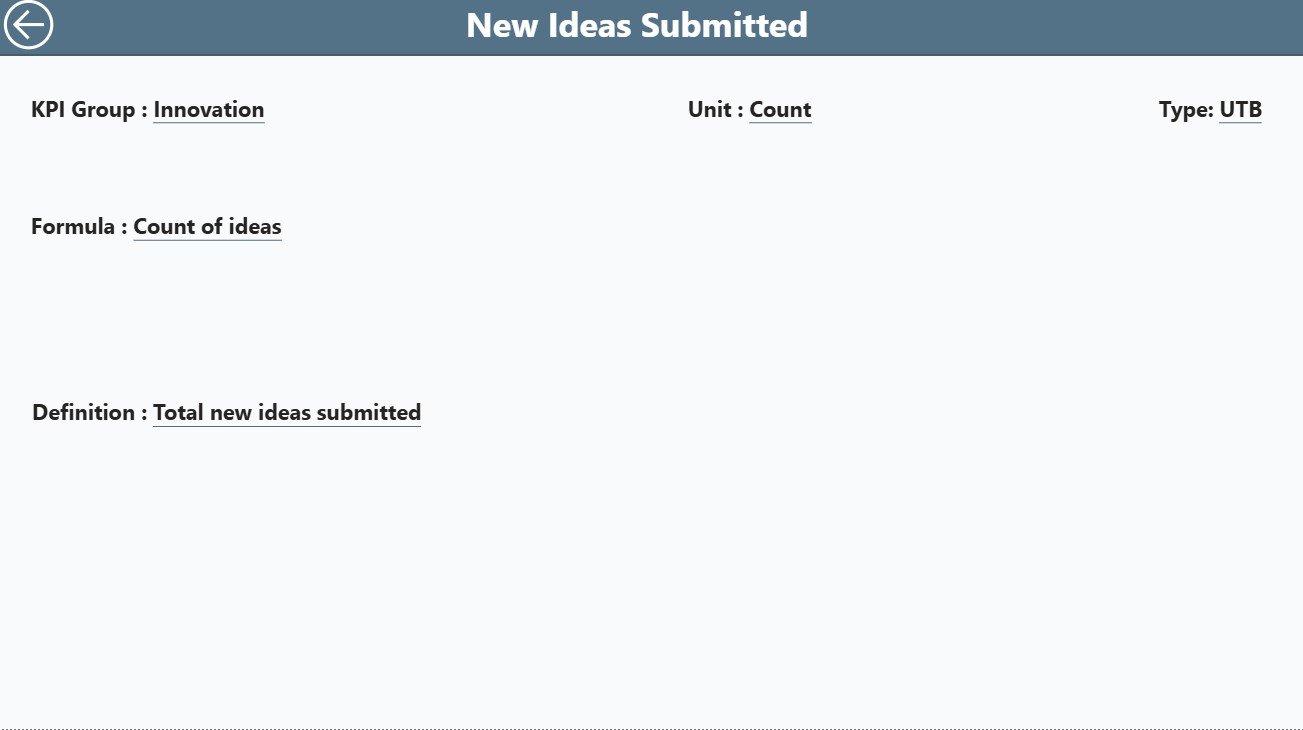
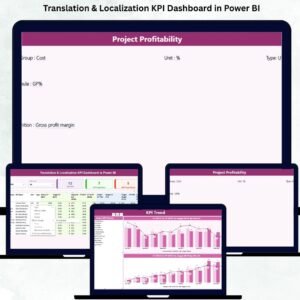
3️⃣ KPI Definition Page – Complete Transparency
This hidden drill-through page defines every KPI.
-
Displays Formula, Definition, Unit, and Type (UTB/LTB).
-
Back Button allows easy navigation to the Summary Page.
Transparency ensures everyone understands what each metric means and how it’s calculated.
📂 Excel Data Source Structure
The dashboard connects to an Excel file with three sheets:
-
Input_Actual: Enter actual KPI results (Month, MTD, YTD).
-
Input_Target: Define benchmark targets for each KPI.
-
KPI Definition: Record KPI Group, Formula, Unit, and Type.
Once the Excel file is updated, simply refresh Power BI — the dashboard updates automatically.
🧠 How to Use the Dashboard
1️⃣ Update Excel Data: Input actual and target KPI numbers.
2️⃣ Load into Power BI: Refresh to visualize updated performance.
3️⃣ Filter Insights: Use slicers to explore KPI groups and time periods.
4️⃣ Drill Through: Right-click any KPI to view its formula and definition.
5️⃣ Review Trends: Use the KPI Trend Page to compare monthly or yearly performance.
6️⃣ Share Reports: Publish to Power BI Service for team collaboration.
In minutes, you’ll have a real-time innovation management system ready to guide strategic decisions.
👥 Who Can Benefit from This Dashboard
💼 Executives: Monitor transformation ROI and innovation output.
🧠 Innovation Teams: Track idea generation, implementation, and impact.
⚙️ IT & Digital Transformation Leaders: Measure automation and adoption KPIs.
📈 Strategy Departments: Align performance with corporate objectives.
🏭 Project Managers: Evaluate ongoing initiatives across departments.
🔗 Click here to read the Detailed Blog Post
🎥 Visit our YouTube channel for step-by-step tutorials
👉 YouTube.com/@PKAnExcelExpert


Reviews
There are no reviews yet.