Influencer marketing decisions should never rely on guesswork. As influencer platforms scale rapidly, brands, agencies, and marketing teams need clear, reliable, and actionable performance insights. However, when data is scattered across multiple spreadsheets, reports become slow, unclear, and error-prone.
That is exactly where the Influencer Platforms KPI Dashboard in Excel becomes a game-changing performance management tool.
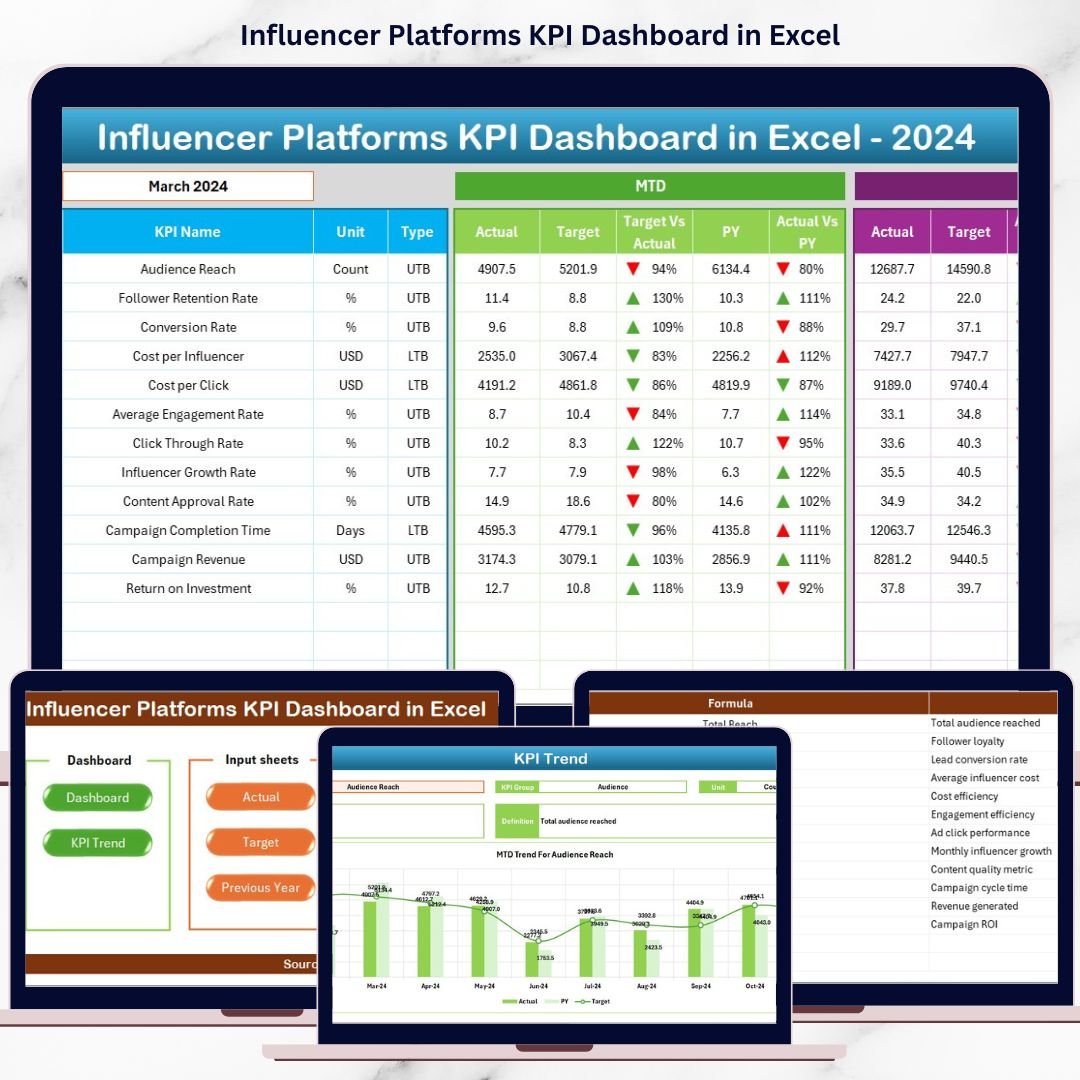
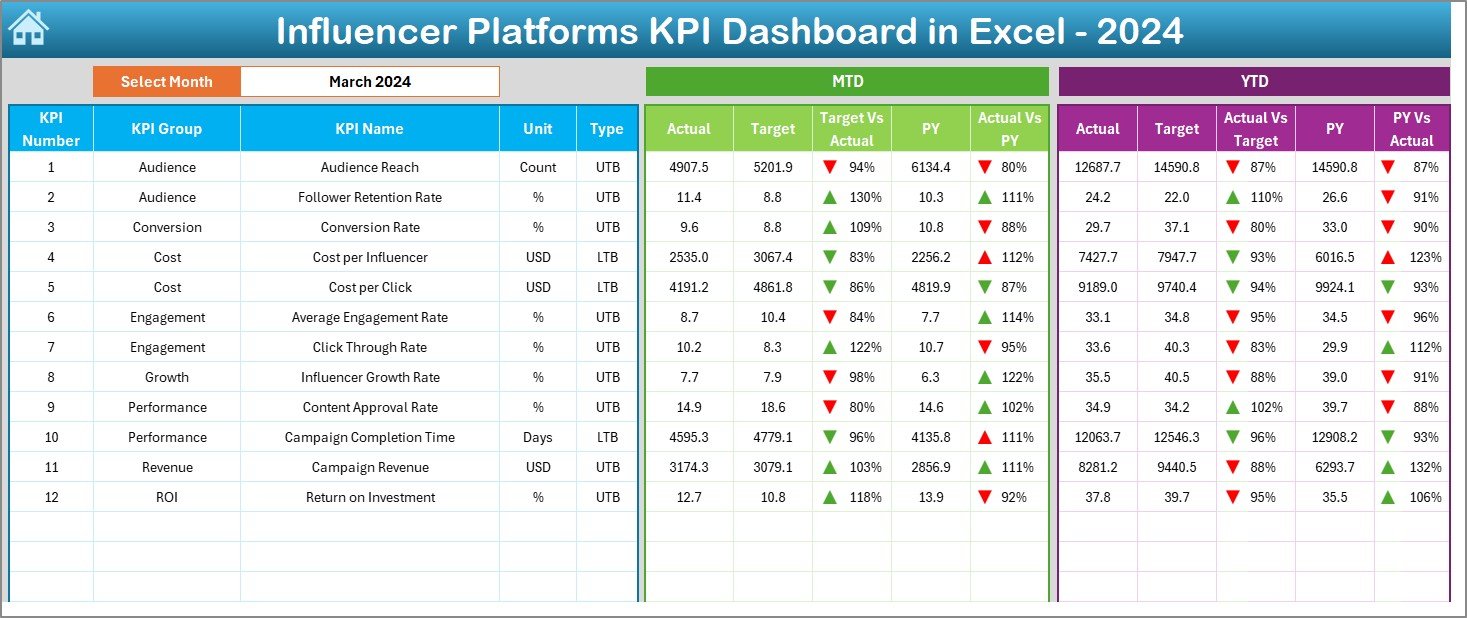
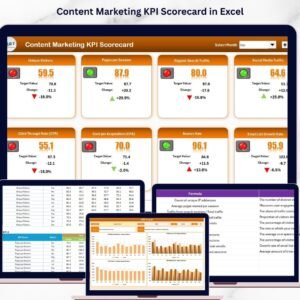
This ready-to-use Excel dashboard converts raw influencer platform data into clear KPIs, visual trends, and actionable insights—all in one centralized view. Instead of spending hours preparing reports, you can instantly track performance, compare targets, and make confident, data-driven decisions.
🚀 Key Features of Influencer Platforms KPI Dashboard in Excel
📌 Interactive Month Selection
Easily select any month from a drop-down and watch the entire dashboard update automatically.
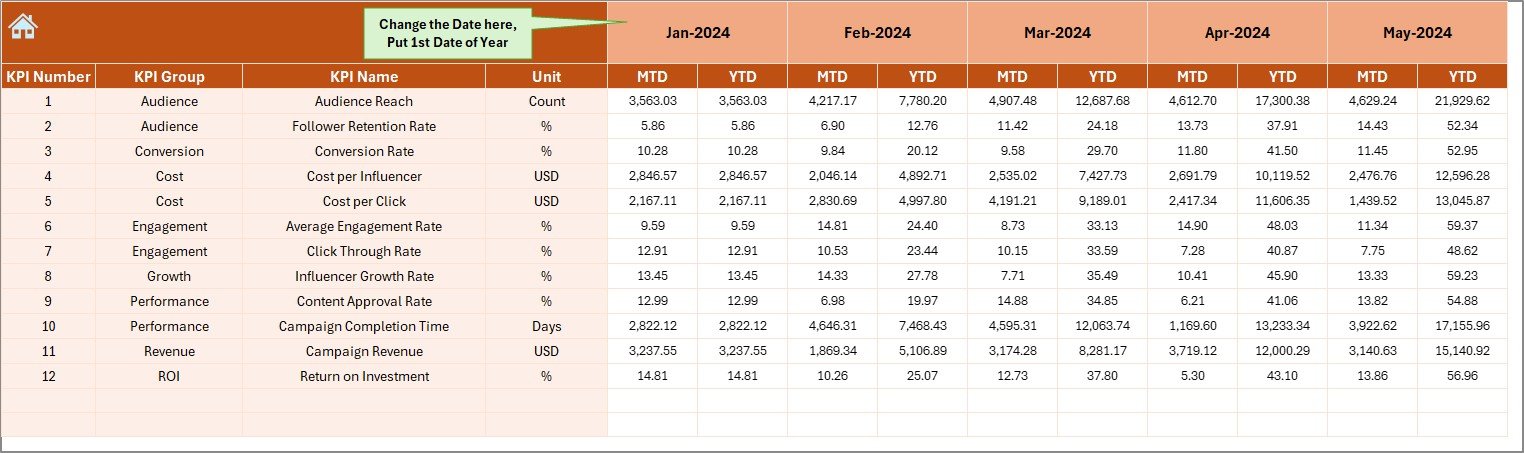
📌 MTD & YTD Performance Tracking
Monitor Month-to-Date and Year-to-Date performance side-by-side for better short-term and long-term visibility.
📌 Actual vs Target vs Previous Year Comparison
Quickly identify performance gaps and improvements using structured comparisons.
📌 Conditional Formatting with Up/Down Arrows
Instantly understand KPI performance status without reading numbers.
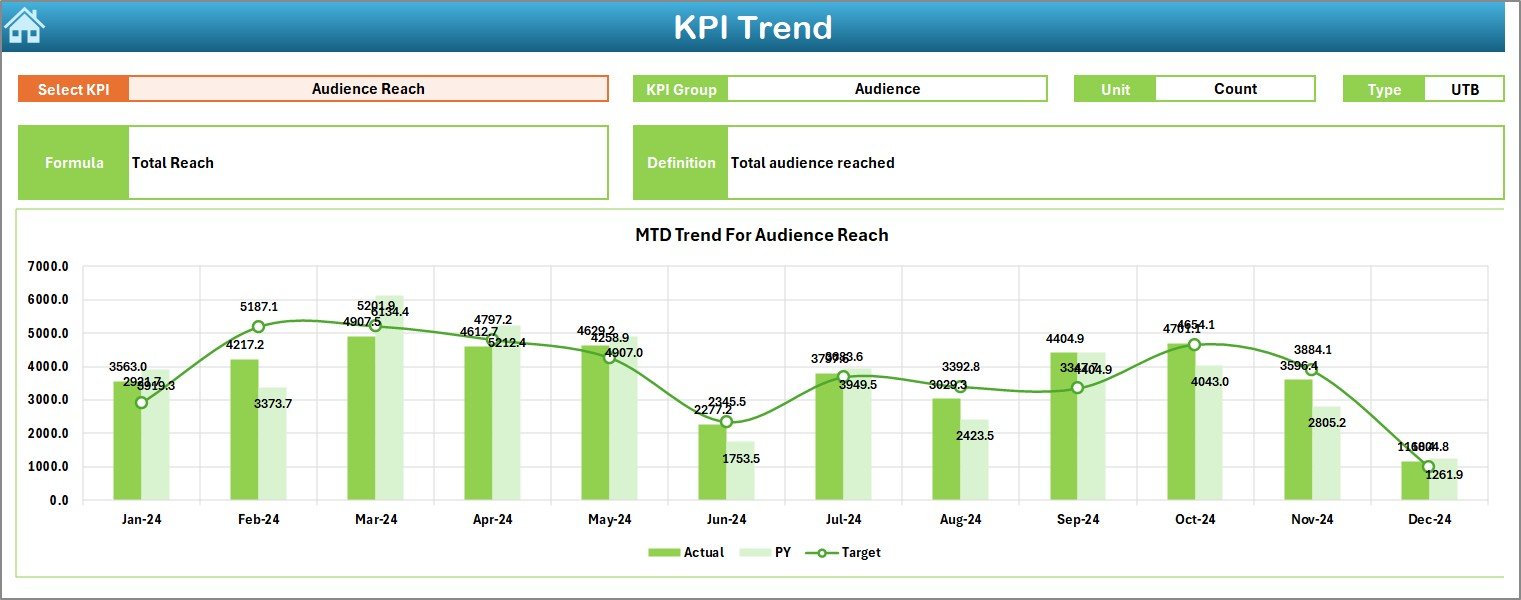
📌 Dedicated Trend Analysis
Analyze KPI trends visually to detect growth patterns, seasonality, and risks.
📌 Clean Navigation with Summary Page
Jump between sheets instantly using built-in navigation buttons.
📌 Fully Customizable Structure
Add, remove, or modify KPIs without breaking formulas or layouts.
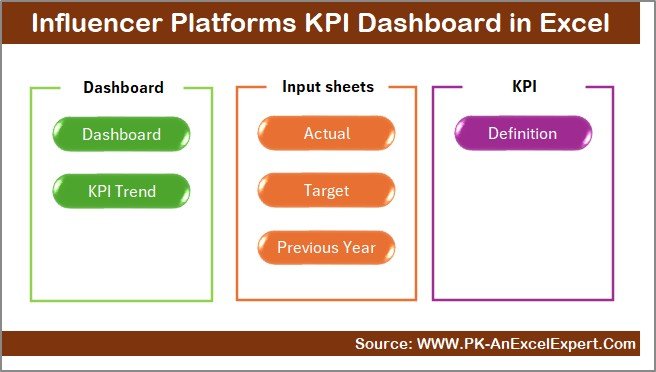
📦 What’s Inside the Influencer Platforms KPI Dashboard in Excel
This dashboard includes 7 professionally designed worksheets, each with a specific purpose:
📄 Summary Page – Acts as an index with navigation buttons for easy access
📊 Dashboard Sheet – Displays all KPI insights in one powerful view
📈 Trend Sheet – Shows MTD and YTD trends for selected KPIs
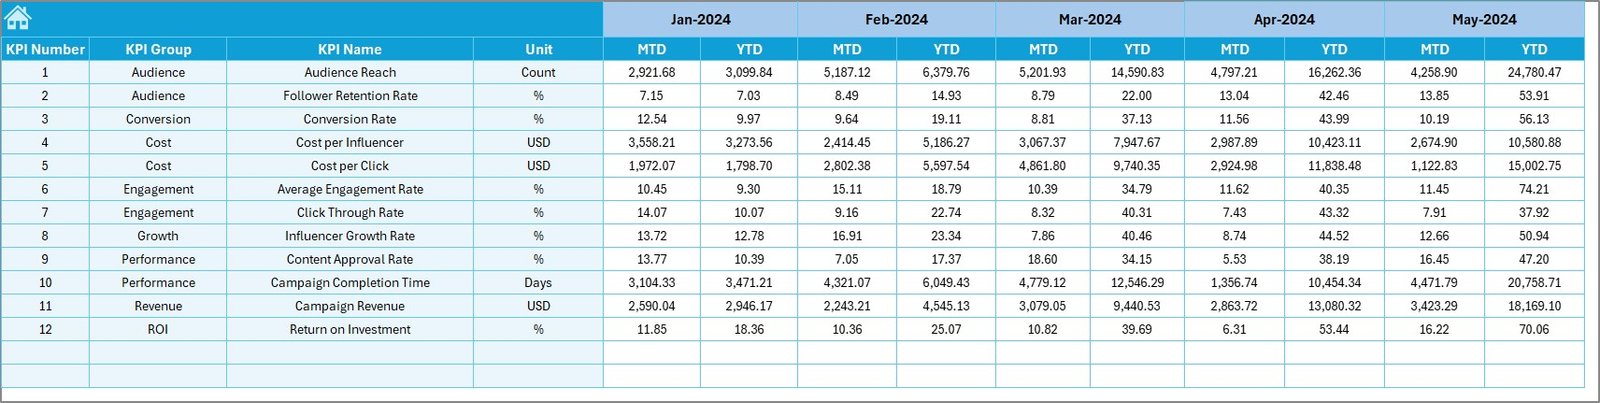
🧾 Actual Numbers Input Sheet – Secure input area for actual KPI values
🎯 Target Sheet – Maintain monthly MTD and YTD targets
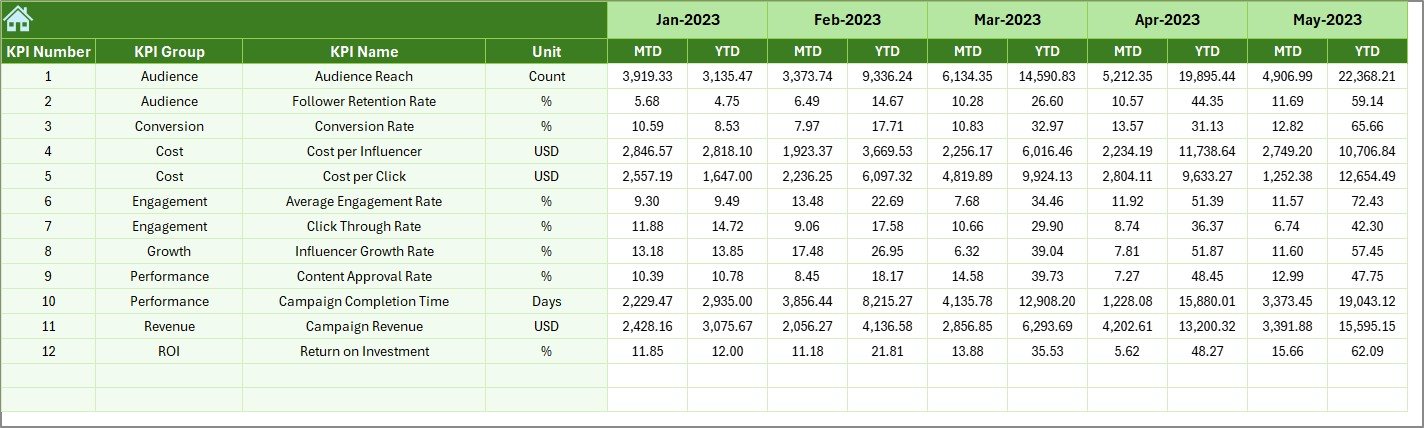
📆 Previous Year Sheet – Store historical data for YoY comparison
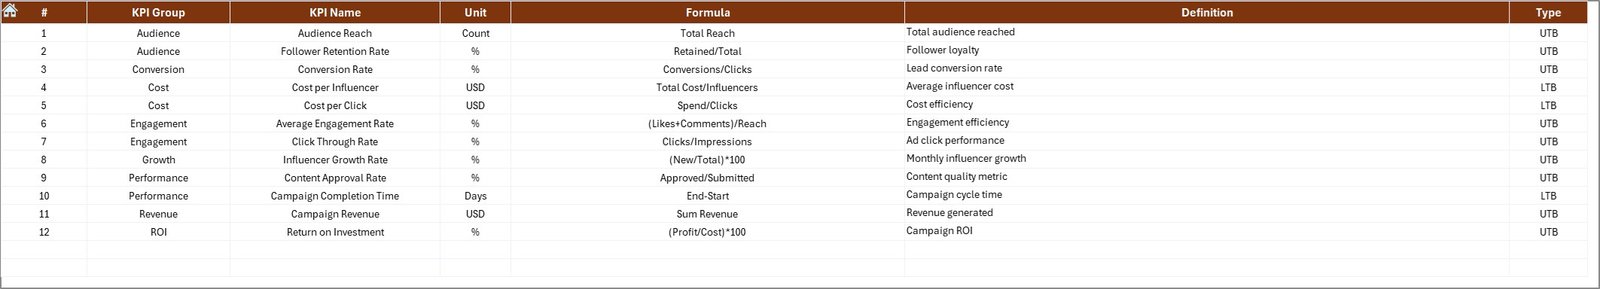
📘 KPI Definition Sheet – Central library for KPI formulas, units, and explanations
This structure ensures data integrity, clarity, and scalability.
🛠️ How to Use the Influencer Platforms KPI Dashboard in Excel
Using this dashboard is simple and intuitive:
1️⃣ Enter KPI definitions once in the KPI Definition Sheet
2️⃣ Input monthly actual values in the Actual Numbers Sheet
3️⃣ Define targets in the Target Sheet
4️⃣ Add previous year values in the Previous Year Sheet
5️⃣ Select the month from cell D3 on the Dashboard
6️⃣ Instantly review MTD, YTD, trends, and comparisons
No advanced Excel skills are required. The dashboard handles all calculations automatically.
🎯 Who Can Benefit from This Influencer Platforms KPI Dashboard
This dashboard is ideal for:
✔ Influencer platform managers
✔ Digital marketing teams
✔ Brand partnership managers
✔ Influencer marketing agencies
✔ Campaign analysts
✔ Performance reporting teams
✔ Growth and strategy professionals
Whether you manage one platform or multiple campaigns, this dashboard adapts effortlessly.
Click here to read the Detailed Blog Post
Watch the step-by-step video tutorial:


Reviews
There are no reviews yet.