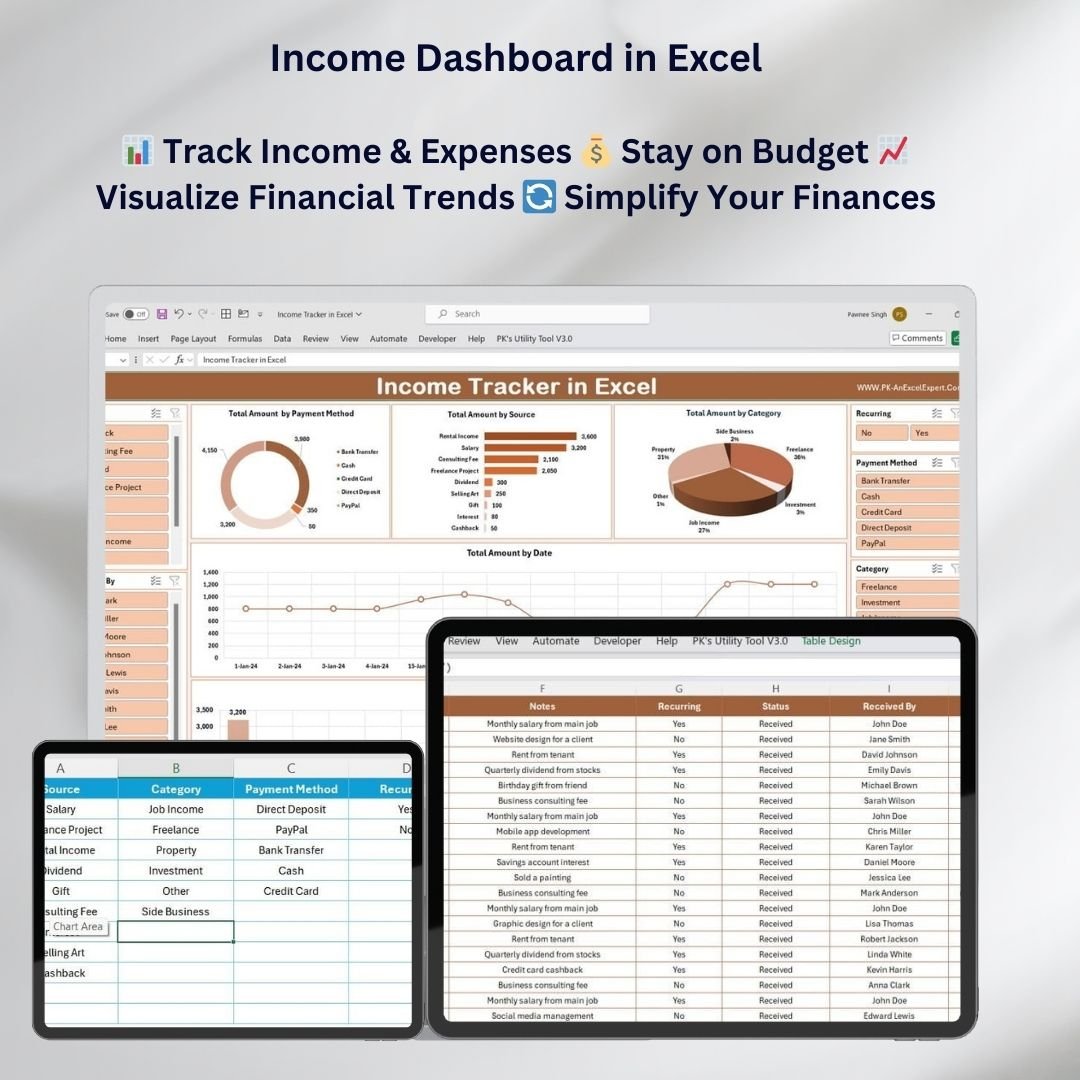

The Income Dashboard in Excel is a powerful and customizable tool designed to help individuals, freelancers, and small business owners track their income, expenses, and overall financial health. This intuitive dashboard provides a clear, visual representation of your financial data, enabling you to make informed decisions about saving, budgeting, and growing your income.
With automated features, customizable categories, and easy-to-read charts, this Excel-based dashboard simplifies income tracking and financial planning. Whether you are tracking monthly earnings, yearly trends, or visualizing your expenses, this dashboard makes managing your finances straightforward and efficient.
Key Features of the Income Dashboard in Excel
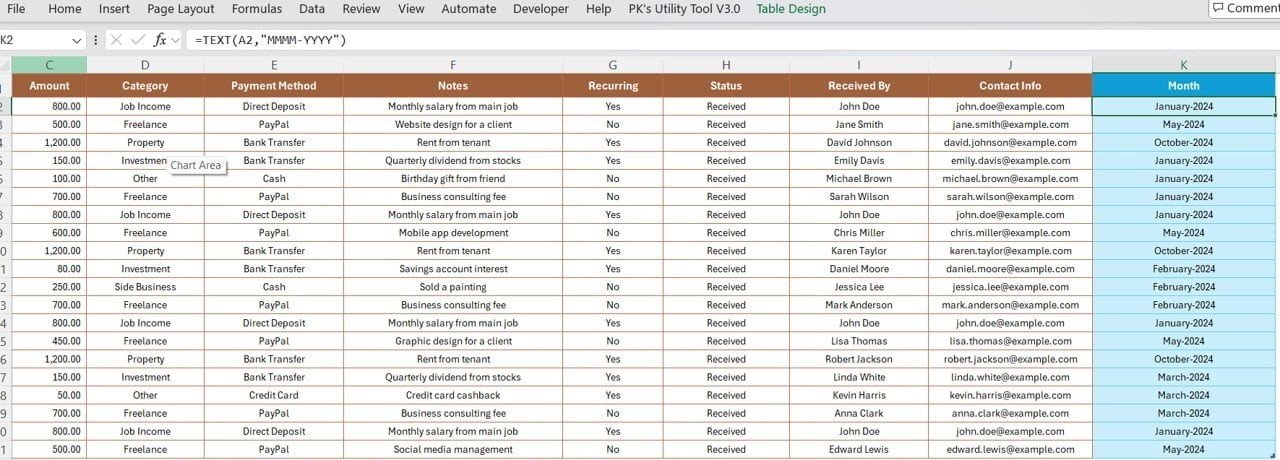
📊 Real-Time Income Tracking: Automatically track income from various sources, such as salaries, freelance work, or business earnings.
⚙️ Expense Tracking: Categorize and track your expenses, helping you understand where your money is going.
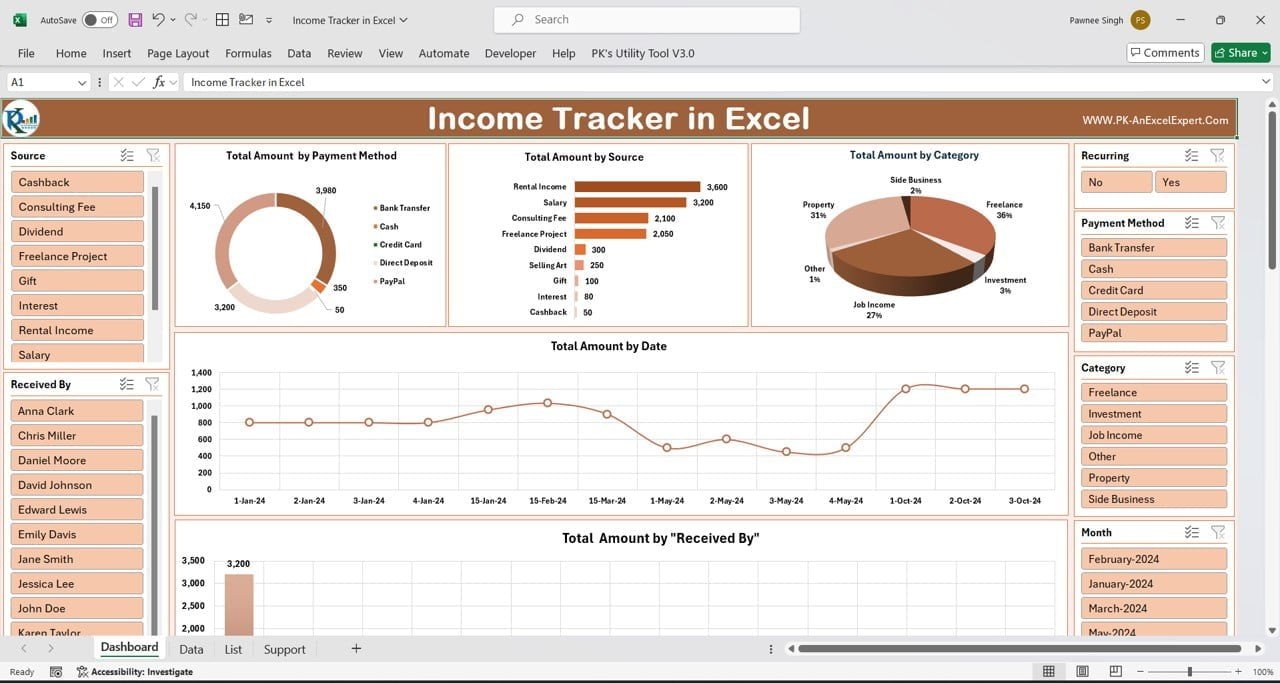
📈 Visual Data Representation: Visualize income, expenses, and savings through interactive charts for easy analysis.
📅 Time-Based Insights: Track income and expenses over various time periods (monthly, quarterly, yearly) to evaluate trends.
📉 Budget vs. Actual Comparison: Compare your planned income and expenses with actual results to stay on track.
🔄 Customizable Categories: Add and modify categories to suit your income and expense tracking needs.
🧑💼 User-Friendly Interface: Designed with simplicity in mind, making it easy for anyone to navigate and use.
Why You’ll Love the Income Dashboard in Excel
✅ Simplifies Financial Tracking: Keep all your income and expense data in one place for easy management.
✅ Data-Driven Insights: Make better financial decisions based on clear, visual data.
✅ Saves Time: Automate income and expense tracking to spend more time focusing on growing your finances.
✅ Customizable to Your Needs: Adapt the dashboard to suit your specific financial tracking needs.
✅ Helps You Stay on Budget: Visualize your spending habits and income to make informed budgeting decisions.
What’s Inside the Income Dashboard in Excel?
📊 Income Tracking: Monitor all sources of income, from salaries to side hustles and passive income.
📈 Expense Categorization: Track all expenses, including fixed costs, variable costs, and discretionary spending.
⚙️ Budgeting Tools: Set up and track your budget to ensure you stay within your financial goals.
📉 Savings Tracker: Monitor your savings and visualize your progress toward financial goals.
🔄 Time-Based Trends: Compare income and expenses over different time periods to see long-term trends.
How to Use the Income Dashboard in Excel
1️⃣ Download the Template – Instantly access the Excel file upon purchase.
2️⃣ Input Your Income and Expenses: Enter your income and expenses into the customizable fields.
3️⃣ Track Your Finances: Use the dashboard to monitor income, expenses, and savings in real time.
4️⃣ Generate Reports: Create monthly or yearly reports to track your financial progress.
5️⃣ Analyze Trends: Use charts to analyze your spending habits and income trends.
Who Can Benefit from the Income Dashboard in Excel?
🔹 Freelancers
🔹 Small Business Owners
🔹 Entrepreneurs
🔹 Households/Individuals Managing Their Finances
🔹 Financial Planners
🔹 Budget-Conscious Individuals
Take control of your finances with this easy-to-use and interactive Income Dashboard in Excel, designed to help you track your income, manage your expenses, and grow your savings.
Click here to read the detailed blog post
Visit our YouTube channel to learn step-by-step video tutorials
Watch the step-by-step video tutorial:
Also check our Expense Tracking Dashboard in Power BI


Reviews
There are no reviews yet.